. 2025 Jan;637(8046):744-748.
doi: 10.1038/s41586-024-08319-7. Epub 2025 Jan 1.

Centrophilic retrotransposon integration via CENH3 chromatin in Arabidopsis

Affiliations

Centrophilic retrotransposon integration via CENH3 chromatin in Arabidopsis

Sayuri Tsukahara et al. Nature. 2025 Jan.

Abstract

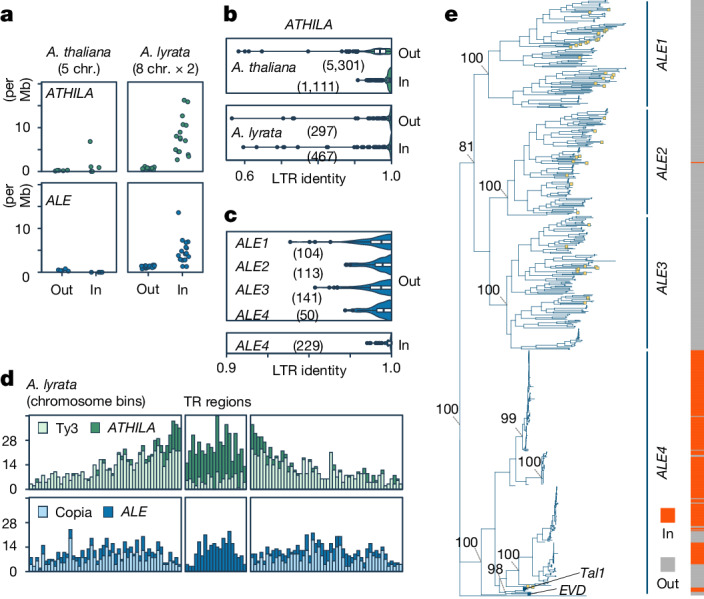
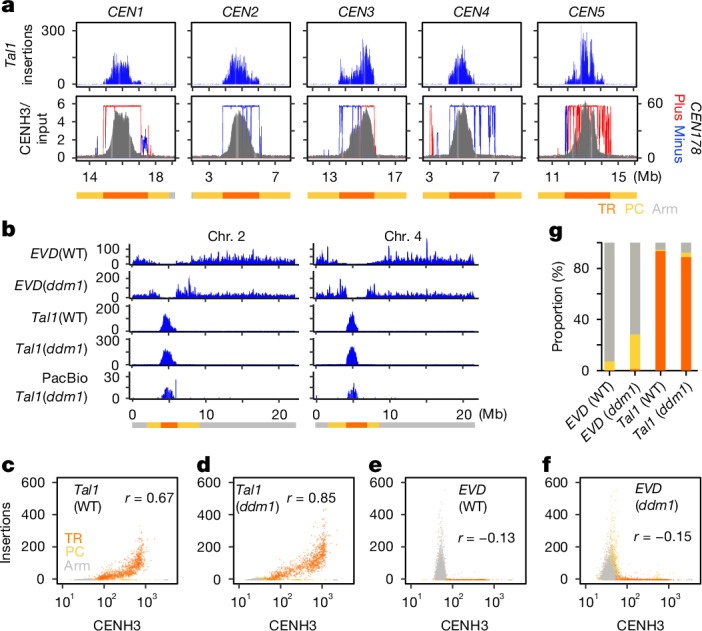
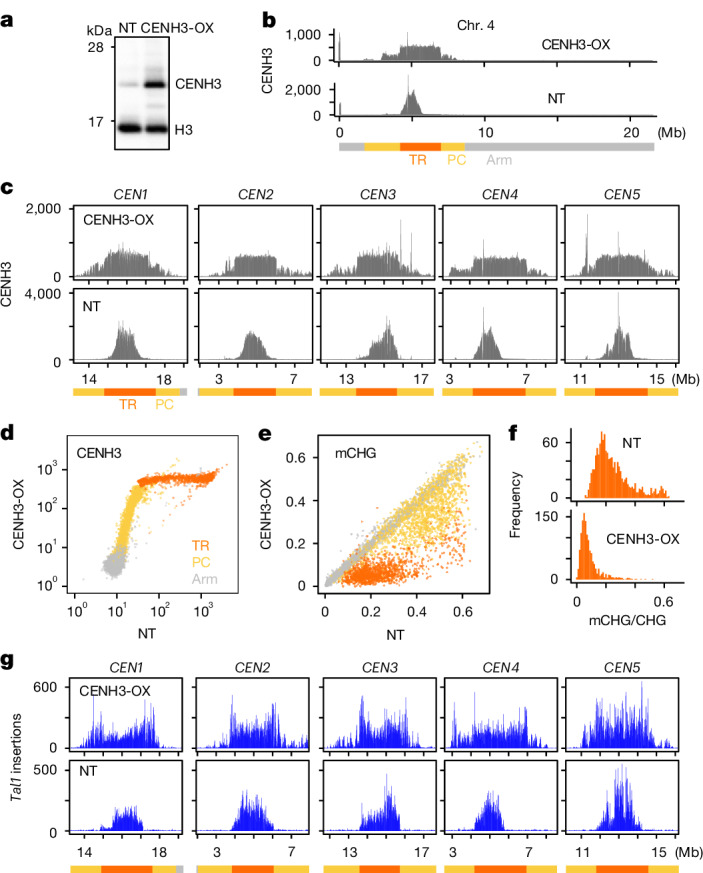
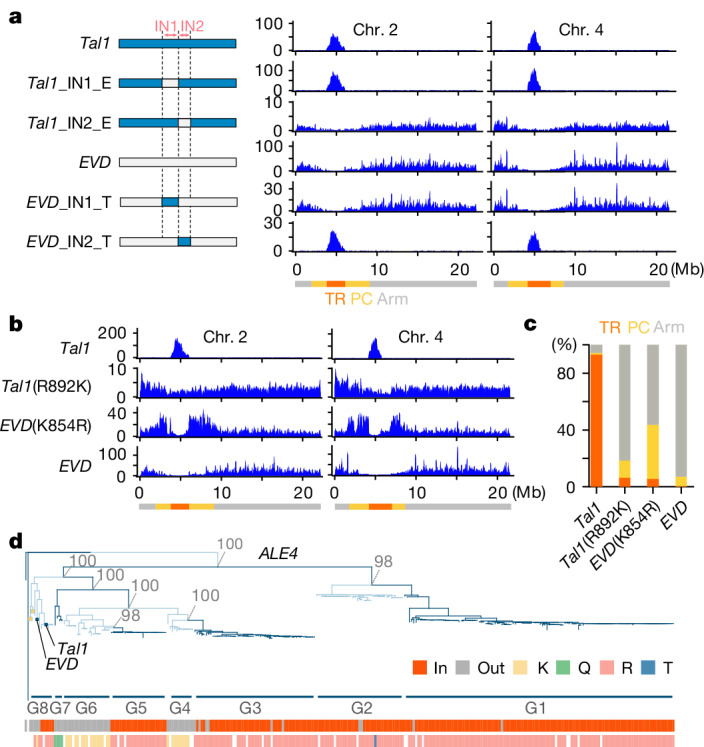
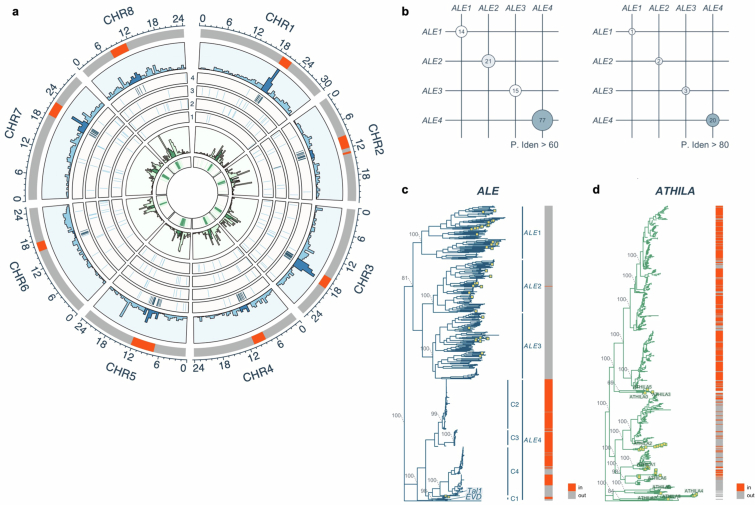
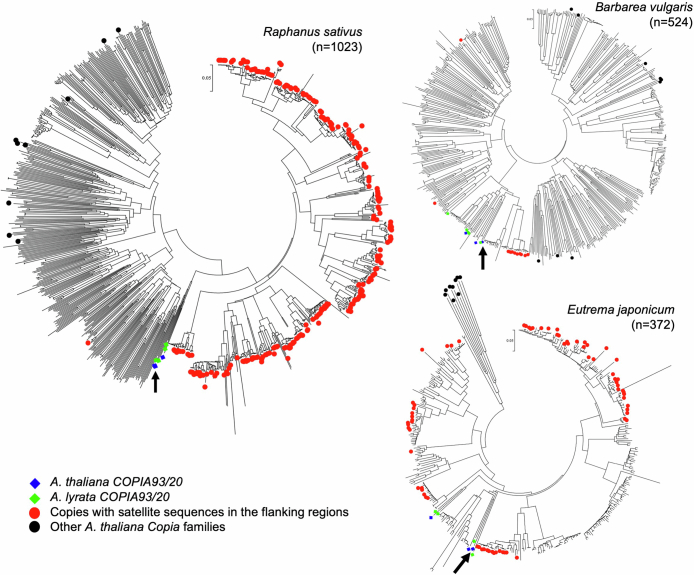
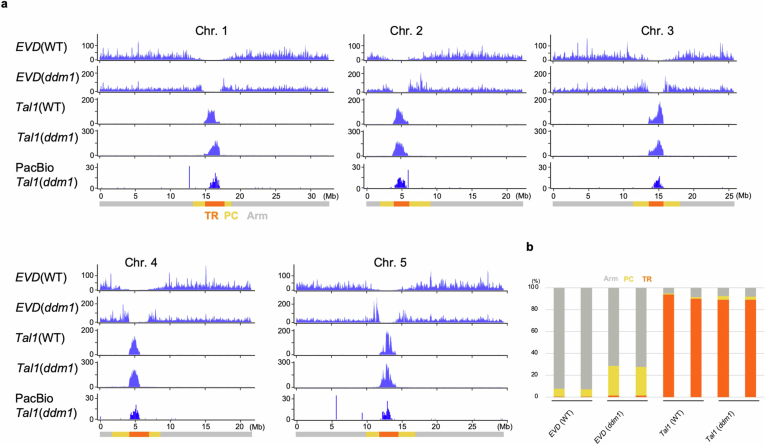
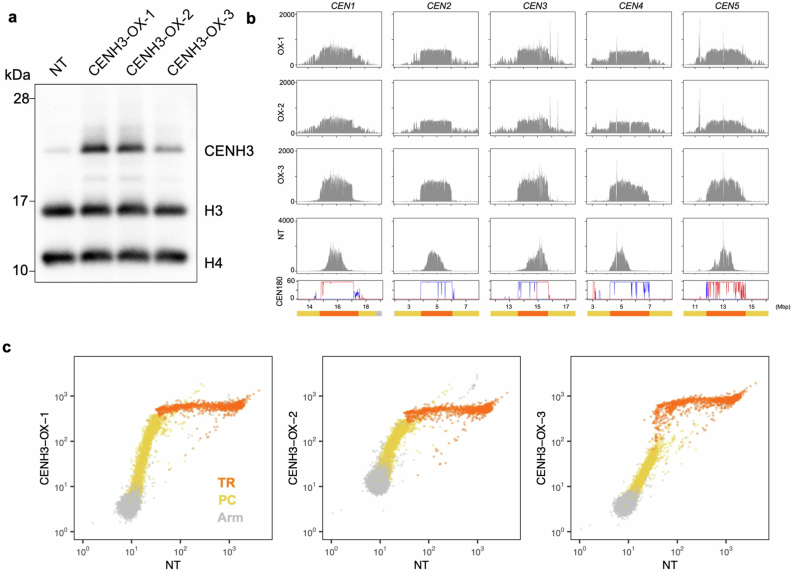
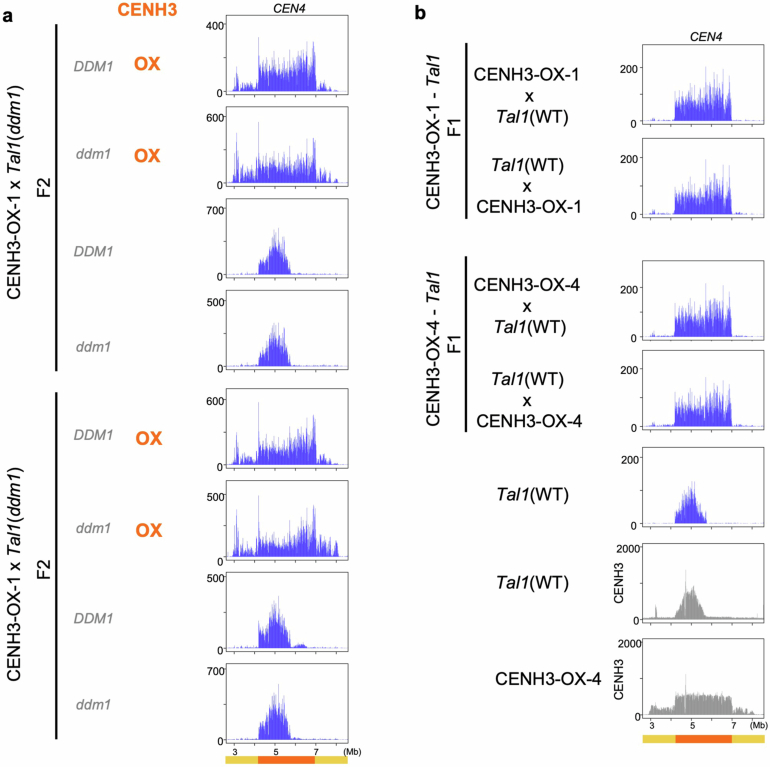
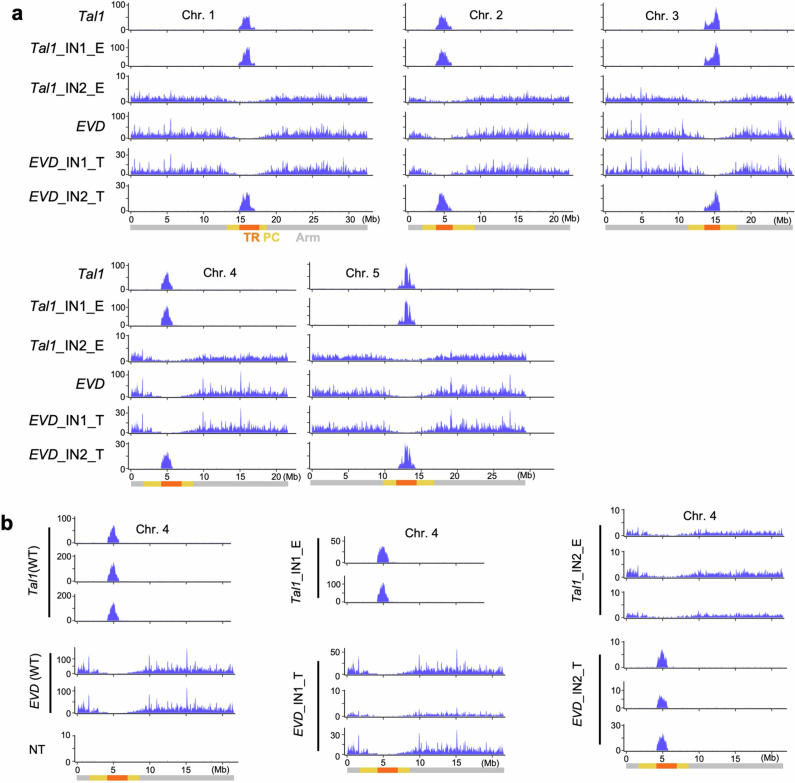
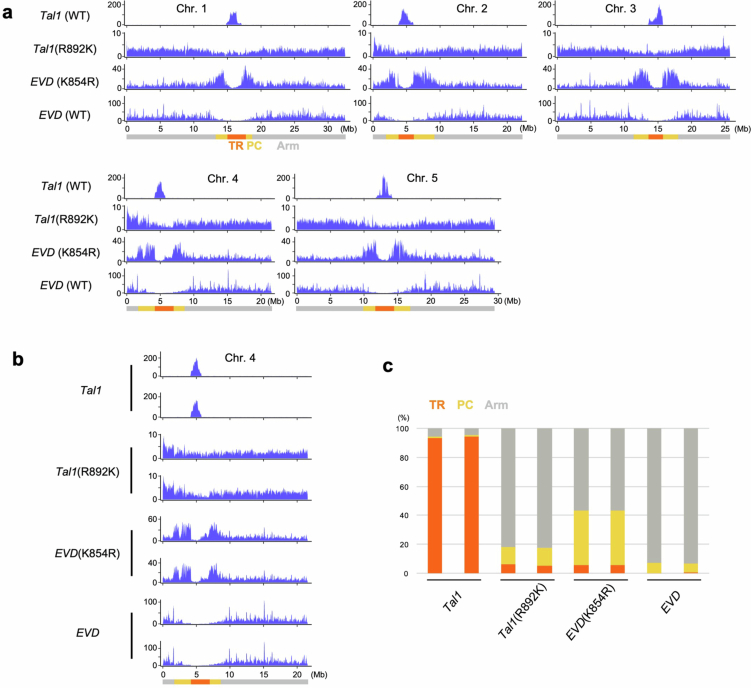
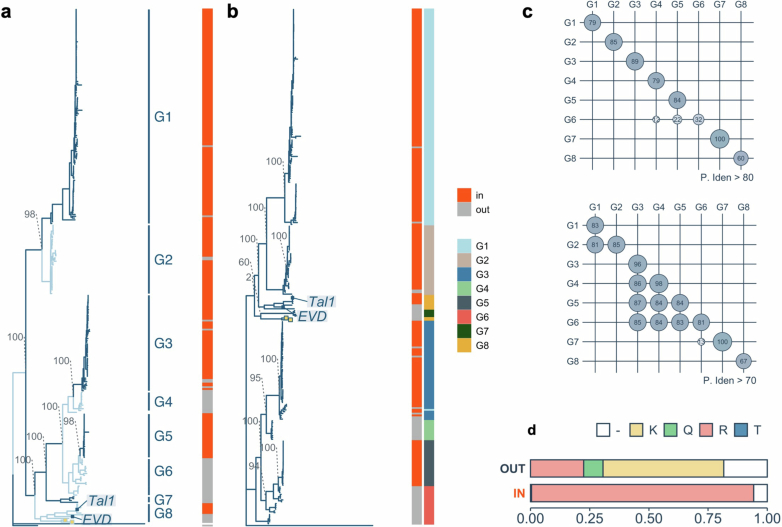
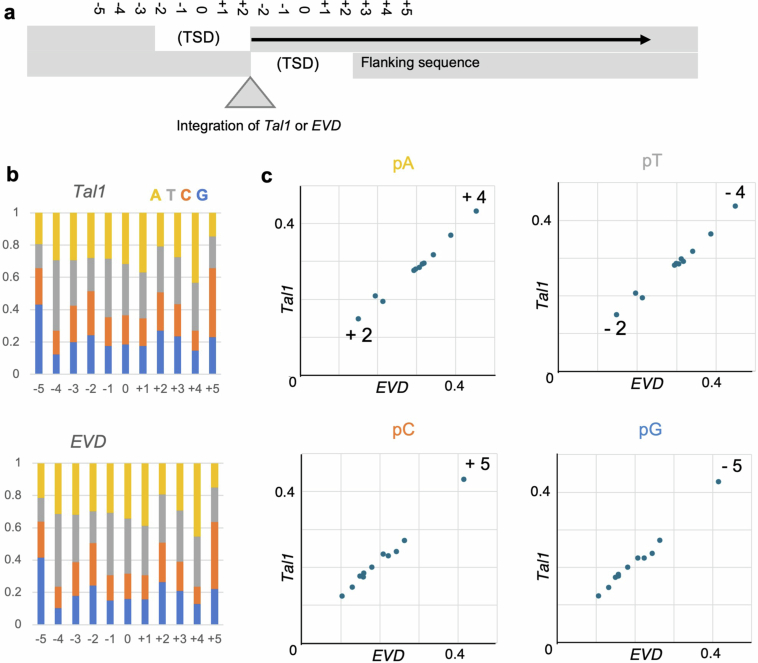
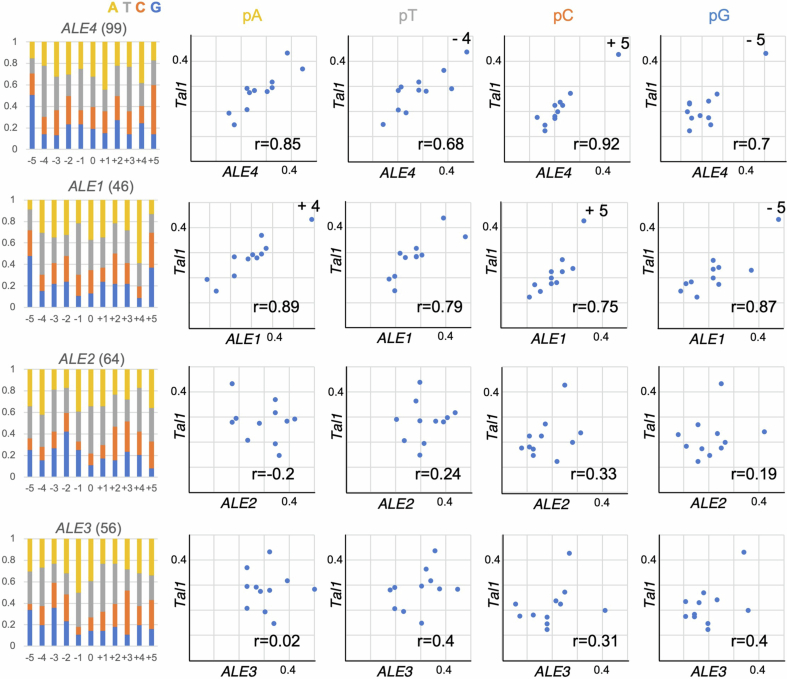
In organisms ranging from vertebrates to plants, major components of centromeres are rapidly evolving repeat sequences, such as tandem repeats (TRs) and transposable elements (TEs), which harbour centromere-specific histone H3 (CENH3)1,2. Complete centromere structures recently determined in human and Arabidopsis suggest frequent integration and purging of retrotransposons within the TR regions of centromeres3-5. Despite the high impact of 'centrophilic' retrotransposons on the paradox of rapid centromere evolution, the mechanisms involved in centromere targeting remain poorly understood in any organism. Here we show that both Ty3 and Ty1 long terminal repeat retrotransposons rapidly turnover within the centromeric TRs of Arabidopsis species. We demonstrate that the Ty1/Copia element Tal1 (Transposon of Arabidopsis lyrata 1) integrates de novo into regions occupied by CENH3 in Arabidopsis thaliana, and that ectopic expansion of the CENH3 region results in spread of Tal1 integration regions. The integration spectra of chimeric TEs reveal the key structural variations responsible for contrasting chromatin-targeting specificities to centromeres versus gene-rich regions, which have recurrently converted during the evolution of these TEs. Our findings show the impact of centromeric chromatin on TE-mediated rapid centromere evolution, with relevance across eukaryotic genomes.


Conflict of interest statement

Competing interests: The authors declare no competing interests.

Figures

Fig. 1
Fig. 1. LTR elements in A. lyrata centromeres.
a, ATHILA and ALE density shown as the number of intact insertions per Mb inside (In) and outside (Out) the TRs associated with centromeres. Each circle represents one chromosome (chr.) from the A. thaliana (Columbia strain) or A. lyrata (two strains) genome including the centromeres,. b, Distribution of LTR sequence identities of ATHILA elements in A. lyrata and A. thaliana. In and Out copies are separately characterized. Data for 66 A. thaliana accessions are used (Methods). c, Distribution of LTR sequence identities of the ALE branches. In b and c, centre lines represent median values, box borders correspond to the first and third quartiles (interquartile range), whiskers are extended up to the largest value no further than 1.5× interquartile range, outliers are shown as black dots and the numbers of elements are shown within the parenthesis. d, The number of intact Ty1/Copia, ALE, Ty3 and ATHILA insertions in the TR and surrounding areas. The TRs were split into 20 bins of varying size, depending on their length. The mean size of these bins was used for 50 upstream and downstream bins to count insertions. e, Phylogeny of intact ALE elements based on the concatenated integrase (PF00665) and reverse transcriptase (PF07727) core domains in A. lyrata and A. thaliana (yellow boxes), rooted with the Ty1 element (M18706.1) from Saccharomyces cerevisiae (bottom). The four main branches are indicated, and the relationship of each element (In/Out) to the TRs (the numbers are shown in Supplementary Table 1). Bootstrap support of key nodes and the position of Tal1 and EVD are shown. In this figure, A. lyrata genomes of NT1 from Siberia and MN47 from North America were used. A Circos plot in Extended Data Fig. 1a shows TE distribution along A. lyrata MN47 chromosomes.
Fig. 2
Fig. 2. De novo Tal1 integrations are confined to the TR regions occupied by CENH3.
a, Top, distribution of somatic neo-insertions of Tal after introduction of a Tal1 transgene into A. thaliana. Bottom, CENH3 (ChIP/input) (grey) and CEN178 per 10 kb for forward (red) or reverse (blue) strand orientations. Each of these values were counted in adjacent 10 kb intervals. TR (orange), pericentromeric (PC, yellow) and chromosomal arm (Arm, grey) regions are indicated by different colours at the bottom. b, Somatic neo-insertions of EVD and Tal1 in wild-type and ddm1 backgrounds. The integrations were counted in 10 kb intervals and shown by sliding windows of size 9 and step 1. Tal1 (wild type), Tal1 (ddm1) and EVD (wild type) show neo-insertions of respective TEs in the transgenic A. thaliana lines, whereas EVD (ddm1) show neo-insertions of endogenous EVD in the ddm1 mutant plants without the transgene. Results of chromosomes two and four are shown, and the results of all five chromosomes are shown in Extended Data Fig. 3a. Detection of Tal1 integration by PacBio-seq are also shown in the bottom. cf, Scatter plots comparing CENH3 enrichment and Tal1 (c,d) or EVD (e,f) integration frequencies in wild-type (WT) (c,e) or ddm1 (d,f) backgrounds. Each dot represents values in a single 10 kb interval. The Pearson correlation coefficient (r) is shown in each panel. g, Summary of integration specificities of EVD and Tal1 into TR, pericentromeric and arm regions in wild-type and ddm1 backgrounds. Proportion of integrations in each of these regions are shown. Results of extra lines are shown in Extended Data Fig. 3b.
Fig. 3
Fig. 3. Spread of CENH3 deposition induces mirrored expansion of Tal1 integration.
a, Western blot analyses of purified nuclei from non-transgenic (NT) line and transgenic line overexpressing CENH3 (CENH3-OX). Antibody against CENH3, which is weakly cross-reactive with H3 (anti-CENH3 C-terminal antibody) is used (validation shown in Supplementary Fig. 1a,b). Biological replicates of the same conditions and with extra anti-H4 antibody and extra independent transgenic lines are shown in Extended Data Fig. 4a and Supplementary Figs. 3 and 4 (n = 6 in total). b,c, Overexpression of CENH3 induces expansion of genomic regions covered by CENH3. b, Entire chromosome. c, Centromeric regions. Antibody recognizing CENH3 but not H3 (anti-HTR12 (CENH3 N-terminal) antibody) is used (validation in Supplementary Fig. 1a,b). ChIP–seq profiles of CENH3 (normalized by million total mapped reads and counted in 10 kb intervals) are shown for NT and CENH3-OX line. CENH3 profiles in other independent transgenic lines are shown in Extended Data Fig. 4b,c. d, Genome-wide comparison of CENH3 levels between wild type and the CENH3-OX backgrounds. Each dot represents a single 10 kb region, with different colours for TR, pericentromere and arm regions. e, DNA mCHG level of the CENH-OX line compared to parental NT line. f, Histogram of mCHG level in centromeric TR regions shown for 10 kb units. g, Distribution of Tal1 integrations compared between sibling plants with and without the CENH3-OX transgene, both in the ddm1 mutant background. Results of F2 plants in DDM1 wild-type and the ddm1 mutant backgrounds for two independent CENH3-OX families and F1 plants are shown in Extended Data Fig. 5.
Fig. 4
Fig. 4. Mapping of integrase regions that define the centrophilic versus centrophobic integrations.
a, De novo somatic insertions of each chimeric TE examined by TEd-seq. Structure of each chimeric TE is shown schematically in the left. IN1 and IN2 correspond to conserved domains of integrase and its C-terminal regions, respectively (Supplementary Fig. 2). Blue and grey indicate the sequence of Tal1 and EVD, respectively. Integration spectra of chromosomes 2 and 4 are shown; the results of all five chromosomes, and also further transgenic lines are shown in Extended Data Fig. 6a,b. b, R/K substitutions in Tal1 or EVD integrase IN2 region changes integration specificities. Positions of the substitutions are shown in Extended Data Fig. 5b. Results of chromosomes 2 and 4 for one transgenic line for each genotype are shown. Results in the all five chromosomes and also chromosome 4 of multiple independent transgenic lines are shown in Extended Data Fig. 7. c, Summary of proportions of integration frequency of EVD, Tal1 and their K/R substitution constructs into TR, pericentromere and arm regions. d, The phylogeny within the ALE4 clade. Groups G1–8 are shown in alternating dark and light blue shading. The bottom strips show the relationship to the TR position (in/out), and the amino acid polymorphisms R, K and others. Blank positions reflect copies difficult to align. Sequence similarity levels between G1–8 are shown in Extended Data Fig. 8c, whereas their copy numbers with the in/out locations are shown in Supplementary Table 2.
Extended Data Fig. 1
Extended Data Fig. 1. Arabidopsis lyrata centromeres contain abundant LTR retrotransposons.
a, Circos plot showing TE distribution along A. lyrata MN47 chromosomes. Orange blocks in outermost ribbon depict centromere-associated TR positions. In all inner ribbons, Ty1/Copia and Ty3 elements are shown with blue and green respectively, with darker shadings indicating insertions within the TRs. The second and seventh ribbon moving inwards show counts of intact Ty1/Copia and Ty3 elements, computed separately for inside and outside of the TR regions using a bin width of ~600 kbp. All other ribbons show individual elements of the four main ALE branches (based on Fig. 1e) and of ATHILA. b, Levels of pairwise sequence similarity between and within ALE branches with a 60% and 80% identity threshold. ALE4 show high proportion of the sequence similarity within the group. c, ALE phylogenetic tree as in Fig. 1d. Additional adjacent strips (C1-4) show the centromeric Clusters 1-4 in previous publication that correspond to ALE4. d, As the ALE tree but showing phylogeny of intact ATHILA based on their full-length sequence. The tree was rooted with the Ty3 element (M34549.1) from S. cerevisiae. For both trees, bootstrap support of key nodes and known/consensus elements are indicated.
Extended Data Fig. 2
Extended Data Fig. 2. Phylogenetic analyses of ALE-like sequences from three species related to Arabidopsis.
The phylogenetic relationships of RT core domain sequences were represented by NJ trees. Number of sequences from each species was shown after species name in parenthesis. Red circles show copies flanking TR regions of each species. Also included are Arabidopsis COPIA sequences, such as consensus sequences of four A. lyrata centrophilic ALE4 copies (green diamonds; C1-4), related A. thaliana copies (blue diamonds), and a few other A. thaliana COPIA copies (black circles). An arrow indicates the position of EVD. Scale bars are shown beside the top of each tree. Centrophilic and centrophobic clusters are seen in each species. As is the case in Arabidopsis ALE copies, terminal branches in centrophilic clusters tend to be shorter than those in centrophobic clusters.
Extended Data Fig. 3
Extended Data Fig. 3. De novo integration of Tal1 in the central regions of the TR clusters, which are CENH3 occupied.
a, Distributions of somatic neo-insertions of EVD and Tal1 in the five chromosomes of A. thaliana. The format is as shown in Fig. 2b. b, As shown in Fig. 2g. Results of an additional independent line for each genotype are shown.
Extended Data Fig. 4
Extended Data Fig. 4. CENH3 occupancy in CENH3 overexpression lines.
a, Biological replicates of Western blot analysis in Fig. 3a. While Fig. 3a uses antibody recognizing CENH3 and H3 (CENH3 Cter), the results here use additional anti-H4 antibody. The line shown in Fig. 3 is CENH3-OX-1, and other independent transgenic lines, OX-2 and −3, were also examined here with the control non-transgenic (NT) line. OX-1 and OX-2 uses overexpression promoter, while OX-3 uses native promoter. Positions of molecular weight markers (28, 17, and 10 kDa) are shown in the left. Uncropped images of this panel and Fig. 3a are in Supplementary Figs. 4 and 3, respectively, with additional biological replicates. b, As in Fig. 3c, with additional CENH3-OX lines. c, As in Fig. 3d. OX-1 and OX-2 lines show saturation of CENH3 signals in the TR regions and increase of the signal in the PC regions. In OX-3, the increase was attenuated in the PC regions and periphery of the TR regions, while the effect is robust in the internal parts of the TR regions.
Extended Data Fig. 5
Extended Data Fig. 5. Tal1 integrations in F2 and F1 progenies from crosses between lines over-expressing CENH3 and Tal1.
a, Distribution of Tal1 integrations compared between sibling plants with and without the CENH3-OX transgene. Results of sibling plants in DDM1 wild-type and the ddm1 mutant backgrounds are shown for two F2 families. b, Tal1 neo-insertion in F1 plants between different CENH3-OX lines and Tal1 are examined for reciprocal crosses. The format as in Fig. 3f, with only CEN4 region shown.
Extended Data Fig. 6
Extended Data Fig. 6. Mapping of integrase regions that define the centrophilic versus centrophobic integrations of Tal1 and EVD.
The materials and format are as shown in Fig. 4a. a, Results of all five chromosomes. b, Results of multiple independent transgenic lines. Results of chromosome 4 are shown.
Extended Data Fig. 7
Extended Data Fig. 7. R/K substitutions in Tal1 or EVD integrase IN2 region changes integration specificities.
The materials and format are as shown in Fig. 4b,c. a, As in Fig. 4b. Results of all five chromosomes are shown. b, c, As in Fig. 4b,c. Results of two biological replicates are shown.
Extended Data Fig. 8
Extended Data Fig. 8. ALE4 phylogenetic trees.
a, Same tree as in Fig. 4e based on the concatenated integrase (PF00665) and reverse transcriptase (PF07727) core domains. b, Tree generated by using the near complete length of the integrase gene. The longest open reading frame of every element the sequence between the first amino acid of the integrase core domain (PF00665) and immediately upstream of the first amino acid of the reverse transcriptase core domain (PF07727) is used. The G1-8 classification of the ALE4 elements based on the ‘a’ tree are colour-coded in the ‘b’ tree to show that the branching pattern is consistent between the two trees (e.g. G1/G2 and G3-6 clustering). Bootstrap support of key nodes and the position of Tal1 and EVD are shown. c, Levels of pairwise sequence similarity between and within G1-8 groups that exceed the 80% (top) and 70% (bottom) identity thresholds. G1-G2 and G3-6 share high levels of sequence similarity. d, Proportion of ALE4 elements inside and outside the centromeric TRs that contain the R or K amino acid polymorphism. A small number contain Q. Blank parts reflect copies difficult to align.
Extended Data Fig. 9
Extended Data Fig. 9. Tal1 and EVD show similar local integration bias.
a, Schematic representation of the structure of retrotransposon integration sites. The integration site of the copia is shown by grey triangle; and the two strands of recipient genomic DNA are also shown by grey. As is the other copia elements, double strand break formation during transposon integration generates target site duplication (TSD) of five nucleotides. The central position of the TSD is counted as zero for estimating the integration site bias with keeping the symmetry. b, Nucleotide composition of −5 ~ +5 positions. The results are based on 108,545 of EVD integrations (bottom) and 23,228 of Tal1 integrations outside the TR regions in the CENH3-OX line (top) are shown. c, The biases shown in the panel b are compared between EVD and Tal1. In the panels pA, pT, pC, or pG, each dot represents the proportion of each nucleotide at −5 ~ + 5 sites. The numbers are indicated for positions with strong bias, such as +4 and +2 of pA. It is also noted that the bias is detectable at symmetrical positions of pA-pT and pC-pG combinations.
Extended Data Fig. 10
Extended Data Fig. 10. Local integration bias in ALE1/2/3/4.
As in Extended Data Fig. 9, integration bias of the ALE copies present in the MN47 genome were estimated and compared to that of Tal1 neo-insertions. Number of each of ALE copies examined are shown in parenthesis. Pearson correlation coefficient (r) is shown for each graph. Integration bias of Tal1 is conserved among ALE4 (top). It is also conserved to ALE1, but they differ in ALE2 and ALE3. The results suggest that local integration specificity evolves independent of the transitions of centrophilic/centrophobic properties.

References

    1. Henikoff, S., Ahmad, K. & Malik, H. S. The centromere paradox: stable inheritance with rapidly evolving DNA. Science293, 1098–1102 (2001). - PubMed
    1. Malik, H. S. & Henikoff, S. Major evolutionary transitions in centromere complexity. Cell138, 1067–1082 (2009). - PubMed
    1. Naish, M. et al. The genetic and epigenetic landscape of the Arabidopsis centromeres. Science374, eabi7489 (2021). - PMC - PubMed
    1. Altemose, N. et al. Complete genomic and epigenetic maps of human centromeres. Science376, eabl4178 (2022). - PMC - PubMed
    1. Wlodzimierz, P. et al. Cycles of satellite and transposon evolution in Arabidopsis centromeres. Nature618, 557–565 (2023). - PubMed

MeSH terms