. 2025 Jan;637(8048):1186-1197.
doi: 10.1038/s41586-024-08346-4. Epub 2025 Jan 1.

Monoallelic expression can govern penetrance of inborn errors of immunity

Affiliations

Monoallelic expression can govern penetrance of inborn errors of immunity

O'Jay Stewart et al. Nature. 2025 Jan.

Abstract

Inborn errors of immunity (IEIs) are genetic disorders that underlie susceptibility to infection, autoimmunity, autoinflammation, allergy and/or malignancy1. Incomplete penetrance is common among IEIs despite their monogenic basis2. Here we investigate the contribution of autosomal random monoallelic expression (aRMAE), a somatic commitment to the expression of one allele3,4, to phenotypic variability observed in families with IEIs. Using a clonal primary T cell system to assess aRMAE status of genes in healthy individuals, we find that 4.30% of IEI genes and 5.20% of all genes undergo aRMAE. Perturbing H3K27me3 and DNA methylation alters allele expression commitment, in support of two proposed mechanisms5,6 for the regulation of aRMAE. We tested peripheral blood mononuclear cells from individuals with IEIs with shared genetic lesions but discordant clinical phenotypes for aRMAE. Among two relatives who were heterozygous for a mutation in PLCG2 (delEx19), an antibody deficiency phenotype corresponds to selective mutant allele expression in B cells. By contrast, among relatives who were heterozygous for a mutation in JAK1 (c.2099G>A; p.S700N), the unaffected carrier T cells predominantly expressed the wild-type JAK1 allele, whereas the affected carrier T cells exhibited biallelic expression. Allelic expression bias was also documented in phenotypically discordant family members with mutations in STAT1 and CARD11. This study highlights the importance of considering both the genotype and the 'transcriptotype' in analyses of the penetrance and expressivity of monogenic disorders.


Conflict of interest statement

Competing interests: D.B. is the founder of Lab11 Therapeutics. The other authors declare no competing interests.

Figures

Extended Data Fig. 1 ∣
Extended Data Fig. 1 ∣. aRMAE Workflow.
a, Analysis pipeline to assess aRMAE using paired donor WES with T cell clone RNA-seq. be, Assessable genes in T cell system with synonymous and missense variants combined - (b) genome wide (4,366) and (d) IEI (189) or missense only variants - (c) genome wide (2,155) and (e) IEI (117).
Extended Data Fig. 2 ∣
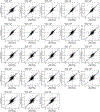
Extended Data Fig. 2 ∣. Allelic imbalance across T cell clones with ≥1 heterozygous SNPs in gene exons.
Correlation of gene allelic imbalance determined by Pearson’s coefficient (r).
Extended Data Fig. 3 ∣
Extended Data Fig. 3 ∣. T cell clonotypes.
a, Relative proportion of the expressed (single or dual) TCR beta chains in T cell clones. Data generated from MIXCR pipeline analysis, cloneFraction = 0.80 indicates the threshold for expanded T cells originating from a single clone. b, T cell clones grouped into cloneTypes based on the expression of one (cloneType I; n = 35) or two (cloneType II; n = 12) functional TCR beta chains. c, CloneFraction of TCR beta chains from cloneType = I and cloneType = II T cell clones.
Extended Data Fig. 4 ∣
Extended Data Fig. 4 ∣. Allelic imbalances in T cells.
Allelic imbalance distributions for the T cell clones with ≥500 assessable genes at 30+ read count at the location of a het-exonic SNP.
Extended Data Fig. 5 ∣
Extended Data Fig. 5 ∣. aRMAE at increased thresholds of Allelic Imbalance.
ab, Allelic Imbalance of genes across T cell clones with allele-specific analysis conducted using healthy donor vcfs containing only missense het-SNPs (a) or missense and synonymous het-SNPs (b). cd, Percentage of genes exhibiting biallelic (BAE) and monoallelic (aRMAE) expression at increasing thresholds of Allelic Imbalance (AI). In c, the thresholds were set at AI ≥ 0.9 and AI ≤ 0.1, while in d, the thresholds were AI ≥ 0.95 and AI ≤ 0.05. ef, Percentage of genes that are aRMAE or BAE at AI ≥ 0.8 and AI ≤ 0.2 for missense variants or missense and synonymous variants. (g) Gene set enrichment analysis of aRMAE genes using GOrilla. The FDR adjusted q-values comparing target-set (aRMAE genes) and background set (all genes) are plotted.
Extended Data Fig. 6 ∣
Extended Data Fig. 6 ∣. Expression of X-chromosome genes and aRMAE gene correlation.
a, Allelic imbalance (WT/(WT + MUT)) of genes on the X-chromosome, separated by status of inactive or escape expression pattern. Each dot represents a X-chromosome gene detected in a clone and the blue horizontal line illustrates the mean AI of the escape group (n = 81, mean = 0.5172294) or the inactive group (n = 21, mean = 0.6471123). One-sided F-test determined significance of variance between the escape and inactive groups, p = 4.582842e-18. b, X-chromosome genes with known XCI-inactive expression pattern and their allele expression. c, X-chromosome genes with XCI-escape expression pattern and their allele expression. d, Pearson correlation coefficient of Allelic Imbalance for each aRMAE gene in relation to the number of genes compared across clones. Error bands indicate 95% CI. e, Range of Pearson correlation (R) across T cell clones (mean = 0.69). f, Two-sided Pearson correlation of aRMAE genes from a single T cell clone separated in culture for 8 weeks with separate libraries prepared and sequenced. Error bands indicate 95% CI.
Extended Data Fig. 7 ∣
Extended Data Fig. 7 ∣. T-helper cell subsets.
a,CD4 + T cell clones grouped into different subclasses of T-helper cells based on expression level of defining genes.Data is expressed as z-scores of the batch-corrected logCPM values, as calculated by voom from the R package limma. b, Percent aRMAE genes across T cell clones defined as Th1 (n = 2), Th2 (n = 3), Treg (n = 3) and Th17 (n = 2) cell subsets. c, Percent aRMAE genes across HD1 (n = 2), HD2 (n = 3), HD3 (n = 3) and HD4 (n = 2). dg, Percent aRMAE genes across different CD4 + T cell subsets in (d) HD1 (n = 2), (e) HD2 (n = 3), (f) HD3 (n = 3) and (g) HD4 (n = 2). Statistical significance assessed using a two-tailed Student’s t-test, ns indicates not significant, error bars indicate mean ± sd.
Extended Data Fig. 8 ∣
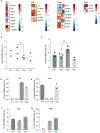
Extended Data Fig. 8 ∣. siRNA targeting JARID1B, JMJD3 and DNMT1.
ac, Allelic imbalance shifts of PLCG2 in clones transfected with scramble siRNA and with siRNA targeting JARID1B, JMJD3 or DNMT1 assessed using ddPCR. d, Expression levels of JARID1B (n = 4, p value = 0.0042), JMJD3 (n = 4, p < 0.0001) and DNMT1 (n = 6, p = 0.1084) quantified using ddPCR (JARID1B, JMJD3) or RT-qPCR (DNMT1) after siRNA knockdown. Significance assessed by Dunnett’s multiple comparisons test. eg, Quantification of H3K4me3 (p value = 0.0015) (e), H3K27me3 (f) and DNA methylation (p value = 0.0409) (g) marks in control and siRNA transfected T cell clones. Significance in eg assessed using two-sided student’s t-test. Results in ag are representative of two experiments.
Extended Data Fig. 9 ∣
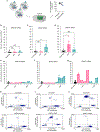
Extended Data Fig. 9 ∣. PLCG2 Ca2+ Flux and aRMAE.
a, Stability of allele commitment assessed in a T cell clone from HD6 at Weeks 8 and 12 of T cell culture. PLCG2 allele-specific expression determined by ddPCR using TaqMan probes targeting the reference (ref) and alternate (alt) alleles of a PLCG2 het-exonic SNP (rs1143688). Results are representative from two experiments. b, Symptoms observed in patients III-11 (low Ig levels) and IV-4 (normal Ig levels) with discordant antibody deficiency. c, Proportion of CD3CD19+ B cells that have normal Ca2+ Flux levels (Flux+) or low Ca2+ Flux (Flux) from III-11, IV-4 and healthy donor (HD) control. d, Cytoplasmic Ca2+ levels in sorted CD3CD19+ B cells from HD, III-11 and IV-4 derived by the ratiometric Ca2+ indicator Indo-1. Flow cytometry plots shown in e. Experiments with patient samples were conducted once.
Extended Data Fig. 10 ∣
Extended Data Fig. 10 ∣. JAK1 genotype and transcriptotype.
a, Technical validation of aRMAE findings from RNA-seq analysis using ddPCR. Expression of a JAK1 het-exonic SNP (rs3737139) in identical clones (Clone1, Clone2) from D311 was used to determine aRMAE. RNA-sequencing was conducted once, ddPCR results are representative of two experiments. b, Symptoms observed in patients III-1 (unaffected carrier) and II-2 (affected carrier) with discordant penetrance for JAK1 mediated inflammatory disease. cd, Sanger sequencing of gDNA isolated from sorted immune cells of II-2 (c) and III-1 (d) showing the heterozygous presence of the mutated allele.
Fig. 1 ∣
Fig. 1 ∣. Ex vivo clonally expanded primary T cells used for detection of aRMAE.
a, Schematic of experiment to establish a clonal (n = 47) primary T cell system to assess aRMAE in healthy donors (n = 9) via expressed transcripts at the site of heterozygous, synonymous SNPs in gene exons (het-exonic SNP). b, Schematic representing the expression pattern of autosomal genes—biallelic (BAE), aRMAE monoallelic reference (Ref) and aRMAE monoallelic alternate (Alt)—and the allelic imbalance threshold (AI ≥ 0.80 or AI ≤ 0.20) used to classify allele committed expression. cf, WES of healthy donor PBMCs (n = 9) and bulk RNA-seq from expanded clones (n = 47) identified 14,694 genes that contain at least 1 het-exonic SNP (c), 3,438 of which have at least 30× read coverage of SNP loci (e) and 318 IEI genes with at least 1 het-exonic SNP (d), 140 of which have at least 30× read coverage of SNP loci (f).
Fig. 2 ∣
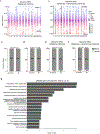
Fig. 2 ∣. aRMAE of widespread autosomal genes and IEI genes revealed with a T cell system.
a,b, Allelic imbalance of genes across T cell clones (n = 29) from healthy donors (n = 7) with at least 500 assessable genes per clone. a, Autosomal genes are predominantly expressed in a biallelic manner (98%) per clone; however, collectively, 5% (171 out of 3,438) of genes are capable of exhibiting monoallelic expression. b,c, IEI genes are predominantly expressed in a biallelic manner (98.4%), with 4% (6 out of 140) (c) being capable of monoallelic expression. d, Imprinted genes in expanded T cell clones have a stable allelic imbalance across clones within the same donor. e, Representative plot of two-sided Pearson correlation for aRMAE genes (n = 28) across two clones from a single donor (HD6). aRMAE genes have a significant (P = 0.04182) but poor correlation (r = 0.387) between clones. Error bands represent the 80% confidence interval. f, Biallelic and aRMAE genes have similar expression levels (P = 0.3444, two-tailed Student’s t-test and Welch’s correction). Biallelic: n = 24,709, minimum = 30, maximum = 10,769, median = 77, 25th percentile = 47, 75th percentile = 151; aRMAE: n = 427, minimum = 30, maximum = 4,879, median = 70, 25th percentile = 43, 75th percentile = 135. Whiskers extend to minimum and maximum values. g, IEI genes with known incomplete penetrance were assessed for aRMAE (≥10× coverage at het-exonic SNP loci). aRMAE was detected in JAK1 (6 out of 26), NOD2 (6 out of 19), PLCG2 (2 out of 7), PRF1 (6 out of 24) and STAT1 (2 out of 5) clones across healthy donors (n = 6). ac,g, FDR-adjusted P values from a two-sided binomial test of allelic imbalance by the Benjamni–Hochberg method; P = 0.50. Genes with FDR < 0.05 and AI ≥ 0.8 or AI ≤ 0.2 are shown.
Fig. 3 ∣
Fig. 3 ∣. H3K27me3 and DNA methylation regulate allele commitment in aRMAE.
a, Schematic showing siRNA-mediated knockdown of genes encoding demethylating enzymes for H3K4me3 (JARID1B) and H3K27me3 (JMJD3) and DNA methylating enzyme (DNMT1) in expanded T cell clones from healthy donors (HD1 and HD2), and assessment of changes in PLCG2 expression. bd, Shift in the allelic imbalance of PLCG2 in all T cell clones from two healthy donors targeted for knockdown of JARID1B (b; n = 9), JMJD3 (c; n = 9) and DNMT1 (d; n = 7). Dunnett’s multiple comparisons test. Data are mean ± s.e.m. ***P < 0.001; *P < 0.01. eg, Shift in allelic imbalance of PLCG2 of individual T cell clones from HD1 and HD2 targeted for knockdown of JARID1B (e), JMJD3 (f) and DNMT1 (g). hj, Representative ddPCR plots corresponding to eg, respectively. Results representative of two independent experiments. NS, not significant.
Fig. 4 ∣
Fig. 4 ∣. Expression of PLCG2 from a single allele influences penetrance of antibody deficiency.
a, aRMAE of PLCG2 detected using nine expanded T cell clones assessed across two healthy donors. Expression of reference or alternate alleles of a PLCG2 het-exonic SNP (rs1143688) determined using ddPCR. Results representative of two experiments. b, Pedigree of a family with carriers of a heterozygous exon 19 deletion in PLCG2 (PLCG2wt/ΔEx19). Allele-specific expression in III-11 (low Ig levels) and IV-4 (normal Ig levels), who have discordant antibody deficiency phenotypes. c, Schematic of Ca2+ flux assay to separate PLCG2wt/ΔEx19 CD3CD19+ B cells on the basis of cell function. d, Representative flow cytometry plot of Ca2+ flux CD3CD19+ B cell sort. eg, Allele-specific expression of PLCG2wt (wild-type (WT)) and PLCG2ΔEx19 (mutant (MUT)) alleles in Ca2+ flux-positive (Flux+) and Ca2+ Flux-negative (Flux) bulk CD3CD19+ B cells from a healthy donor (e; n = 1) and patients with PLAID (III-11 (f) and IV-4 (g); n = 2), detected by RT–qPCR. Experiments with human samples in eg were performed three times with similar results.
Fig. 5 ∣
Fig. 5 ∣. Predominant expression of the wild-type allele in T cells drives incomplete penetrance of JAK1-mediated disease.
a, aRMAE of JAK1 identified using 12 additional expanded T cell clones assessed across two healthy donors (HD3 and HD5). Expression of each allele was determined by the intensity of TaqMan probes binding to cDNA of the reference or alternate alleles of a JAK1 het-exonic SNP (rs3737139) using ddPCR. Results are representative of two experiments. b, Pedigree of a family with carriers of a heterozygous mutation in JAK1. II-2 (affected by disease) and III-1 (healthy carrier) display incomplete penetrance of JAK1-mediated inflammatory disease. c, Sanger sequencing of a heterozygous mutation in II-2 and III-1. d, Allele-specific expression analysis of bulk PBMCs from III-1 (78% JAK1wt, 22% JAK1mut) and II-2 (64% JAK1wt, 36% JAK1mut). WT, wild-type. e, Allelic imbalance of [WT/(WT + mut)] JAK1 alleles in CD19+ B cells, CD3+ T cells, CD14+ monocytes, CD56+ NK cells and CD3+ T cells from the affected (II-2) and unaffected (III-1) family members. Data are from ddPCR reactions for detection of fluorescence for VIC (wild type) and FAM (mutant (mut)) using a custom Taqman probe for the JAK1 c.2099G>A p.S700N locus. Two-sided binomial test, P = 0.50 (biallelic expression). ****P < 0.001. f, Allelic imbalance of JAK1 c.2099G>A p.(S700N) in CD3+ T cells from affected (II-2) and unaffected (III-1) family members. Data are mean ± 95% confidence interval (binomial test). Experiments with human samples in df were performed twice with similar results.
Fig. 6 ∣
Fig. 6 ∣. aRMAE in people with mutations in STAT1 and CARD11.
a, Family pedigree of an affected individual (II-1) and an unaffected carrier (I-1) with a mutation at the STAT1 locus. b, Experimental design to assess aRMAE of STAT1 in lymphoid and myeloid cell subsets. c, Allelic imbalance of [WT/(WT + mut)] STAT1 alleles in CD19+ B cells (CD19), CD3+ T cells (CD3), CD56+ NK cells (CD56), classical monocytes (CM), intermediate monocytes (IM) and non-classical monocytes (NCM) from a healthy control and the affected (II-1) and unaffected (I-1) family members. Data are from dPCR reactions for detection of fluorescence for VIC (wild type) and FAM (mutant) using a custom Taqman probe for the STAT1 c.1976T>C p.(I659T) locus. Binomial test, with P = 0.50 (biallelic expression). ****P < 0.001. d, Experimental design to assess aRMAE of STAT1 in CD3+ T cells and monocyte subsets. e, Allelic imbalance [WT/(WT + mut)] of STAT1 alleles in intermediate monocytes from P1 (carrying p.R274Q), CD3+ T cells and non-classical monocytes from P2 (carrying p.K388E), and CD3+ T cells, classical monocytes and non-classical monocytes from P3 (carrying p.T385M). Data are from dPCR reactions for detection of fluorescence for VIC (wild type) and FAM (mutant) using a custom Taqman probe for the STAT1 p.R274Q, p.K388E and p.T385M loci. Two-sided binomial test, P = 0.50 (biallelic expression). *P < 0.05, **P < 0.01, ***P < 0.001, ****P < 0.0001. f, Family pedigree of three individuals with CARD11 mutations (I-1, II-1 and II-2). Minimally affected father (I-1) denoted in grey. g, Schematic illustrating design of experiment to assess aRMAE of CARD11. h, Expression of wild-type and mutant CARD11 alleles in naive T cells stimulated with anti-CD3 and anti-CD28 for three days. Data shown are from bulk RNA-seq reads that mapped to the CARD11 c.223 C > T locus. Two-sided binomial test, P = 0.50 (biallelic expression). **P < 0.01. Experiments with human samples in c,e,g were performed once.

References

    1. Tangye SG et al. Human inborn errors of immunity: 2022 update on the classification from the International Union of Immunological Societies Expert Committee. J. Clin. Immunol 42, 1473–1507 (2022). - PMC - PubMed
    1. Gruber C. & Bogunovic D. Incomplete penetrance in primary immunodeficiency: a skeleton in the closet. Hum. Genet 139, 745–757 (2020). - PMC - PubMed
    1. Gimelbrant A, Hutchinson JN, Thompson BR & Chess A. Widespread monoallelic expression on human autosomes. Science 318, 1136–1140 (2007). - PubMed
    1. Chess A. Monoallelic gene expression in mammals. Annu. Rev. Genet 50, 317–327 (2016). - PubMed
    1. Nag A. et al. Chromatin signature of widespread monoallelic expression. eLife 2, e01256 (2013). - PMC - PubMed