. 2025 Feb;638(8049):182-196.
doi: 10.1038/s41586-024-08350-8. Epub 2025 Jan 1.

Brain-wide cell-type-specific transcriptomic signatures of healthy ageing in mice

Affiliations

Brain-wide cell-type-specific transcriptomic signatures of healthy ageing in mice

Kelly Jin et al. Nature. 2025 Feb.

Abstract

Biological ageing can be defined as a gradual loss of homeostasis across various aspects of molecular and cellular function1,2. Mammalian brains consist of thousands of cell types3, which may be differentially susceptible or resilient to ageing. Here we present a comprehensive single-cell RNA sequencing dataset containing roughly 1.2 million high-quality single-cell transcriptomes of brain cells from young adult and aged mice of both sexes, from regions spanning the forebrain, midbrain and hindbrain. High-resolution clustering of all cells results in 847 cell clusters and reveals at least 14 age-biased clusters that are mostly glial types. At the broader cell subclass and supertype levels, we find age-associated gene expression signatures and provide a list of 2,449 unique differentially expressed genes (age-DE genes) for many neuronal and non-neuronal cell types. Whereas most age-DE genes are unique to specific cell types, we observe common signatures with ageing across cell types, including a decrease in expression of genes related to neuronal structure and function in many neuron types, major astrocyte types and mature oligodendrocytes, and an increase in expression of genes related to immune function, antigen presentation, inflammation, and cell motility in immune cell types and some vascular cell types. Finally, we observe that some of the cell types that demonstrate the greatest sensitivity to ageing are concentrated around the third ventricle in the hypothalamus, including tanycytes, ependymal cells, and certain neuron types in the arcuate nucleus, dorsomedial nucleus and paraventricular nucleus that express genes canonically related to energy homeostasis. Many of these types demonstrate both a decrease in neuronal function and an increase in immune response. These findings suggest that the third ventricle in the hypothalamus may be a hub for ageing in the mouse brain. Overall, this study systematically delineates a dynamic landscape of cell-type-specific transcriptomic changes in the brain associated with normal ageing that will serve as a foundation for the investigation of functional changes in ageing and the interaction of ageing and disease.


Conflict of interest statement

Competing interests: H.Z. is on the scientific advisory board of MapLight Therapeutics, Inc. The other authors declare no competing interests.

Figures

Fig. 1
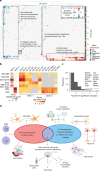
Fig. 1. Transcriptomic cell types in young adult and aged mouse brains.
a, Schematic of dissected brain regions profiled in this study, coloured by major brain structure. b, Schematic of library generation and cell annotation workflow. c, Diagram of cell annotation levels based on the ABC-WMB atlas. Bold text indicates the highlighted cell type that is expanded in the subsequent, finer annotation level. d, Schematic of general analysis strategy for identifying cell types vulnerable to ageing. e, UMAP representation of all single-cell transcriptomes included in this study, coloured by cell class, major brain structure and age. f, Summary of the number of all age-DE genes identified from each subclass (for neurons) and supertype (for non-neuronal cells). Bar graphs below age-DE gene counts represent breakdown of each group by major brain structure, age and sex. g, Relationship between the number of age-DE genes and Augur AUC score for all cell types represented in f. Linear model with 95% confidence interval of fit is shown by the light grey shading. h, Histogram of the number of cell types (subclasses for neurons; supertypes for non-neuronal cells) an age-DE gene is significant for. PL + ILA + ORB, prelimbic area + infralimbic area + orbital area; AI, agranular insular area; ACA, anterior cingulate area; RSP, retrosplenial area; HIP-CA, hippocampus; PAR + POST + PRE + ProS + SUB, parasubiculum + postsubiculum + presubiculum + prosubiculum + subiculum; ENT, lateral and medial entorhinal areas; HY, hypothalamus; STRd, dorsal striatum; STRv, ventral striatum; PAL, pallidum; sAMY, striatum-like amygdalar nuclei; PAG + RAmb, periaqueductal grey + midbrain raphe nuclei; SNr + SNc + VTA, substantia nigra, reticular part + substantia nigra, compact part + ventral tegmental area. Brain sections with anatomical parcellations in a and b are adapted from Allen Mouse Brain CCFv3 (https://atlas.brain-map.org/). Cartoon depictions of mice in a and Eppendorf tubes and laboratory instruments in b were created using BioRender (https://biorender.com). Source data
Fig. 2
Fig. 2. Age-DE genes across non-neuronal supertypes.
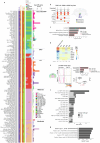
a, Summary of the number of age-DE genes for each of the non-neuronal supertypes as well as two IMN subclasses, grouped by cell classes. Ncell, number of cells. b, The log2OR of aged versus adult cell membership of each cluster as compared to the total number of aged versus adult cell membership of the corresponding class. Each point represents one cell cluster. Rows correspond to the supertypes as labelled in a. c, Spatial localization taken from the ABC-WMB atlas MERFISH data of known and/or suspected regions of adult neurogenesis: SVZ, SGZ and V3 with major cell supertypes coloured. Brain sections with anatomical parcellations are adapted from Allen Mouse Brain CCFv3. Bold text indicates the cell types that are also highlighted in d. d, Relationship between the number of age-DE genes and Augur AUC score for each of the non-neuronal supertypes and IMN subclasses. The red colour denotes top supertypes or subclass associated with regions of neurogenesis. A linear model with a 95% confidence interval of fit is shown by the light grey shading. e, Select GO terms enriched in age-DE genes from OB-STR-CTX Inh IMN cells, with either increased (light grey) or decreased (dark grey) gene expression with ageing. This analysis was performed across all non-neuronal supertypes and neuronal subclasses. Terms that are unique to one cell type only are highlighted with a red border. Enriched GO terms were identified using a hypergeometric test and corrected for multiple testing as described in the Methods. f, Heatmap of age effect sizes of all age-DE genes that are significant in at least one Astro-TE or Astro-NT supertype, whose spatial localization is shown in brain sections taken from the ABC-WMB atlas. g, Dot plot of marker genes for all clusters in the Astro-TE subclass in comparison with the DG-PIR Ex IMN subclass. h,j,l, Heatmap of age effect sizes of all age-DE genes that are significant in at least one vascular (h), immune (j) or OPC-Oligo (l) supertype. i,k,m, Visualization and quantification of expression of Fmo2, Rasgrf2 and Hdac9 in endothelial cells (i), Ildr2, Ccl3 and Ccl4 in microglia (k) or Cdh8, Abca8a and Dpyd in MOL (m) from hindbrain (HB) of RSTE1. Significance between ages for spatial gene expression was tested using a two-sided Mann–Whitney U-test. Results in i, k and m represent n = 4 replicates (two biological and two technical) per sex, age and/or region examined over one experiment. Only samples with more than 20 cells of that cluster were included in the analysis, resulting in certain cell types per sex and/or age that have fewer than four replicates shown. For all boxplots, the minimum, centre and maximum bound of the box represent the 25th, 50th and 75th percentile of the data shown, respectively. The upper and lower whiskers represent the largest and smallest value within 1.5 times above or below the interquartile range, respectively. Specific sample sizes and P values are shown in the online source data file associated with this figure (the same for all spatial gene expression quantifications shown in other figures, as described in the Methods). DC, dendritic cell; Expr., expression; max., maximum; MB, midbrain; min., minimum. Scale bars, 200 μm (c), 20 μm (i,k), 50 μm (m). Source data
Fig. 3
Fig. 3. Ageing-enriched MOL clusters are observed in hindbrain.
a, UMAP of all OPC and oligodendrocyte transcriptomes coloured by supertype, age and major brain structure. b, Constellation plot representing OPC and oligodendrocyte clusters using UMAP coordinates shown in a. c, Spatial locations of OPC-Oligo supertypes from representative samples in the isocortex from RSTE1. d, Quantification of OPC-Oligo supertype cell density in the isocortex. Density quantifications for three other regions are shown in Extended Data Fig. 8d. e, Bar graphs of each OPC-Oligo cluster by major brain structure, sex, donor and age (top) and dot plots of marker genes for each cluster (bottom). f, In situ spatial localization of ageing-enriched MOL clusters 816 and 819 in representative samples of aged and adult hindbrain from RSTE1. g, Quantification of density of MOL clusters 816 and 819 across four brain regions from RSTE1. CTX, isocortex; STR, striatum. Significance between changes in density from d and g are tested using a two-sided Mann–Whitney U-test. h, Zoom-in view of cells highlighted in f showing precise spatial locations of mRNA molecules of Apod, Opalin, Hopx and Art3. i, Quantification of expression of genes shown in h across all MOL clusters. Significance between clusters was tested using an analysis of variance and Tukey’s honestly significant difference test. j,k, Select GO terms enriched in age-DE genes of MOL clusters 816 (j) and 819 (k). Results in d, g and i represent n = 3–4 replicates from RSTE1 per sex, age and region examined over one experiment. For g and i, only samples with more than ten cells of that cluster were included in the analysis, resulting in certain cell types per sex and/or age that have fewer than four replicates shown. For all boxplots, the minimum, centre and maximum bound of the box represent the 25th, 50th and 75th percentile of the data shown, respectively. The upper and lower whiskers represent the largest and smallest value within 1.5 times above or below the interquartile range, respectively. Scale bars, 200 μm (c), 100 μm (f). Source data
Fig. 4
Fig. 4. Age-associated changes in tanycytes and ependymal cells lining the V3.
a, UMAP of all Astro-Epen cell subclasses coloured by subclass and major brain structure. b, Heatmap of age effect sizes of top age-DE genes in tanycytes and ependymal cells. The asterisk denotes statistical significance (see subclass level criteria in the Methods). c, Tanycyte and ependymal cell body locations in select samples from RSTE3. Brain section with anatomical parcellation is adapted from Allen Mouse Brain CCFv3. d, Spatial localization in representative samples from RSTE3 and corresponding gene expression quantification of Oasl2, Ifit1, Ccnd2 and Ctnna2 across ependymal cells and tanycytes in V3. Only samples with more than 20 cells of each subclass are included in the quantification. e, UMAP of tanycyte and ependymal cell transcriptomes with extra adult cells from ABC-WMB atlas included, coloured by cluster, subclass, age and brain structure. f, Constellation plot of tanycyte clusters in e, correlated with classical tanycyte subtypes. g, Spatial localization of tanycyte subtypes in V3 in example samples from RSTE3. hi, Zoomed-in images (left) of boxed areas (g) and quantification (right) of gene expression of H2-K1 (h) and Ifi27 (i) in each subtype from RSTE3. j, Spatial localization of immune cells around V3 in example samples from RSTE3. k, Mean cell number of BAMs and microglia localized within 150 µm of different V3 cell types. Significance between ages for spatial gene expression was tested using a two-sided Mann–Whitney U-test. Results in d, h, i and k represent n = 4 biological replicates from RSTE3 per sex and/or age from hypothalamus region. Only samples with more than ten cells of that cluster were included in the analysis, resulting in certain cell types per sex and/or age that have fewer than four replicates shown. For all boxplots, the minimum, centre and maximum bound of the box represent the 25th, 50th and 75th percentile of the data shown, respectively. The upper and lower whiskers represent the largest and smallest value within 1.5 times above or below the interquartile range, respectively. Scale bars, 100 μm (c,g), 50 μm (h), 150 μm (j). Source data
Fig. 5
Fig. 5. Hypothalamic neuron types showing the greatest age-associated changes are involved in energy homeostasis.
a, Relationship between the number of age-DE genes and Augur AUC score for each neuronal subclass. Linear model with 95% confidence interval of fit is shown by the light grey shading. b, UMAP of all hypothalamic (HY) neurons coloured by class and age. c, Same UMAP from b with only the six subclasses having more than 50 age-DE genes highlighted, and the spatial locations of these subclasses taken from the ABC-WMB atlas in comparison with the HY subregion delineation in Allen Mouse Brain CCFv3. d, Dot plot of expression of the canonical genes involved in feeding behaviour and energy homeostasis for clusters from hypothalamic neuron subclasses with the greatest numbers of age-DE genes. e, Select GO terms enriched in age-DE genes from cluster 331_TU-ARH Otp Six6 Gaba (left) and heatmap of age effect sizes for select genes belonging to major enriched GO terms for all TU-ARH Otp Six6 Gaba clusters (right). Asterisks denote significant changes. f, Spatial localization of all TU-ARH Otp Six6 Gaba clusters in representative samples from RSTE4. g, Zoomed-in view of boxed areas in f coloured by cluster or expression of Agrp and Ccnd2 (left), and quantification of expression of these two genes from RSTE4. h, Select GO terms enriched in age-DE genes from cluster 325_DMH-LHA Gsx1 Gaba (left) and heatmap of age effect sizes for select genes belonging to major enriched GO terms for all DMH-LHA Gsx1 Gaba clusters (right). i, Spatial localization of all DMH-LHA Gsx1 Gaba clusters in representative samples from RSTE3. j, Zoomed-in view of boxed areas in i coloured by cluster or expression of H2-K1 and B2m (left), and quantification of expression of these two genes from RSTE3. Significance between ages for spatial gene expression was tested using a two-sided Mann–Whitney U-test. Results represent n = 4 biological replicates per sex and/or age from RSTE4 (g) and RSTE3 (j), respectively. Only samples with more than ten cells of that cluster were included in the analysis, resulting in certain clusters per sex/age that have fewer than four replicates shown. For all boxplots, the minimum, centre and maximum bound of the box represent the 25th, 50th and 75th percentile of the data shown, respectively. The upper and lower whiskers represent the largest and smallest value within 1.5 times above or below the interquartile range, respectively. Scale bars, 100 μm (f,j), 50 μm (g), 200 μm (i). Source data
Fig. 6
Fig. 6. Decreased neuronal function and increased immune activity as common signatures of ageing across brain cell types.
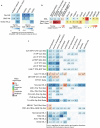
a, Heatmap of hierarchically clustered GO significance scores for cell types (rows) and common terms (columns). Significance scores were calculated by taking the −log10(P) for each GO term, with positive or negative scores assigned to increased or decreased gene expression with ageing in each term. Boxed areas show groups of related terms that are significant across one or more cell types. The matrix used for this heatmap is included in Supplementary Table 5 in the same order as shown in the figure. NN, non-neuronal. b, Heatmaps of GO significance scores of MHC-I and MHC-II activity (left) and age effect sizes of select H2 genes (right) for select cell types. Asterisks denote significant age-DE genes as defined by adjusted P < 0.01 and abs(age effect size) greater than one. c, Distribution of the number of cell types for which a gene belonging to a neuronal signalling or structure term is significant. d, Summary of major trends in ageing-associated gene expression changes, including increased immune response and decreased neuronal function in different cell types. Schematic in d was created using BioRender (https://biorender.com). Source data
Extended Data Fig. 1
Extended Data Fig. 1. Comparison of this study to other published mouse aging scRNA-seq datasets.
(a) Scatter plot of mean gene detection plotted against total cell or nucleus count from major scRNA-seq datasets published within the last 5 years. (b) Table documenting major brain structures profiled within each study. Grey cells denote regions that were profiled with bulk-seq rather than single-cell methods.
Extended Data Fig. 2
Extended Data Fig. 2. FACS gating strategies.
(a-c) Representative flow cytometry data illustrating the gating strategy for FACS purification of cells. Neurons were enriched using tdTomato signal combined with DAPI (a) or Hoechst (b) signal. Live cells were enriched using Calcein and Hoechst (c).
Extended Data Fig. 3
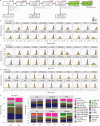
Extended Data Fig. 3. Data pre-processing workflow and quality control.
(a) Workflow for pre-processing of scRNA-seq data. Cells retained at each step are indicated in pink. (b-d) Normalized density distribution of gene detection (b), QC score (c), and mito. score (d) per cell across different cell classes and ages. These quality scores show little variation between aged and adult cells, except for a small number of cell classes such as higher gene detection in adult IMN-GC (immature neurons and granule cells) compared to aged IMN-GC in panel b. (e) Proportion of cells in each class across all regions and within each major brain structure. Dashed white lines denote the separation between neurons and non-neuronal cell classes.
Extended Data Fig. 4
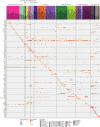
Extended Data Fig. 4. Cell subclass marker genes.
Dot plot of marker gene expression for cell subclasses analyzed in this study. Dot size and color indicate proportion of expressing cells and average expression level in each subclass, respectively. Subclass labels are colored by cell class.
Extended Data Fig. 5
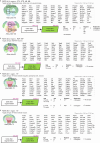
Extended Data Fig. 5. Summary of spatial transcriptomics datasets.
(a-d) Diagram of brain regions profiled, gene panels, and pre- and post-filtered cell counts, and experimental design of Resolve spatial transcriptomic datasets 1 (RSTE1; a), 2 (RSTE2; b), 3 (RSTE3; c), and 4 (RSTE4; d). CTX, isocortex; STR, striatum; HB, hindbrain; MB, midbrain; RSP, retrosplenial area; HIP, hippocampus; HY, hypothalamus. Source data
Extended Data Fig. 6
Extended Data Fig. 6. Correlation between different DE-gene analysis methods.
(a-b) Select two-dimensional density plots comparing the log2(fold change) per gene calculated from a pseudo-bulk (PB) method (y axis) versus the age effect size (comparable to log2FC; see Methods) estimated by MAST (x axis) for two subclasses: ependymal cells (a) and hypothalamic neuron subclass TU-ARH Otp Six6 Gaba (b). (c) Distribution of spearman correlation coefficients from all pseudo-bulk to MAST comparisons (such as those visualized in a and b) for all subclasses tested (n = 146). (d) Scatterplot comparing the total number of age-DE genes per subclass as identified by MAST versus the number of cells per subclass included in each test. P-value and R2 value from linear model are shown. (e) Violin plots showing gene detection (left; log scale on y axis) and QC score (right; y axis) for major cell type categories and FACS population plans (x axis). (f) UMAP from Fig. 1 colored by additional meta data metrics, including FACS population plan, QC score, sex, library, and subclass.
Extended Data Fig. 7
Extended Data Fig. 7. Common age-DE genes across cell types.
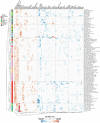
Heatmap of age effect sizes of the most common significant age-DE genes. DE genes that are significant in ≥ 10 cell types (corresponding to Fig. 1h) are shown. Genes and cell types are hierarchically clustered based on age effect sizes and their relatedness represented by the dendrogram. Source data
Extended Data Fig. 8
Extended Data Fig. 8. Changes in density of major non-neuronal cell types as estimated in situ in spatial transcriptomics datasets.
(a-d) Density changes of major Astro-Epen (a), Vascular (b), Immune (c), and OPC-Oligo (d) supertypes with age in isocortex (CTX), striatum (STR), midbrain (MB) and hindbrain (HB), calculated from RSTE1. Each point represents one replicate image. Significance between ages was tested with a two-sided Mann-Whitney U test. Results in all panels mostly represent n = 4 replicates from RSTE1 per sex/age/region (2 biological replicates and 2 technical replicates per brain) examined over one experiment. Male aged CTX and male aged MB have n = 3 replicates due to technical errors during imaging process. For all boxplots, the minimum, center, and maximum bound of the box represent the 25th, 50th, and 75th percentile of the data shown, respectively. The upper and lower whiskers represent the largest and smallest value within 1.5 times above or below the interquartile range, respectively. Source data
Extended Data Fig. 9
Extended Data Fig. 9. Non-neuronal GO terms.
(a-b) Select GO terms enriched in age-DE genes from Astro-Epen (a) and Vascular (b) supertypes, split by genes that increase (light grey) or decrease (dark grey) with age. (c) Visualization and quantification of expression of Cd209a and Cd209b in BAMs from in situ RSTE2. (d) Select GO terms enriched in age-DE genes from BAMs. (e) Visualization and quantification of expression of Upk1b in microglia from RSTE2. (f) Select GO terms enriched in age-DE genes from microglia. (g) Visualization and quantification of expression of Nr6a1 and Maf in OPCs from RSTE1. (h) Select GO terms enriched in age-DE genes from OPCs. (i) Select GO terms enriched in age-DE genes from MOLs. Enriched GO terms were identified using hypergeometric test and corrected for multiple testing as described in the Methods. All enrichment analysis was performed across all non-neuronal supertypes and neuronal subclasses. Terms that are unique to one cell type only are highlighted with a red border. Significance between ages for spatial gene expression was tested using a two-sided Mann-Whitney U test. Results in panels c and e represent n = 4 biological replicates per sex/age from RSTE2 collected over one experiment. Only samples with > 2 BAM cells (c) or > 20 microglia (e) were included in the analysis, resulting in certain clusters per sex/age that have < 4 replicates shown. Results in panel g represent n = 4 replicates from RSTE1 per sex/age/region (2 biological replicates and 2 technical replicates per brain) examined over one experiment. Only samples with > 20 cells of that cluster were included in the analysis, resulting in certain cell types per sex/age that have < 4 replicates shown. For all boxplots, the minimum, center, and maximum bound of the box represent the 25th, 50th, and 75th percentile of the data shown, respectively. The upper and lower whiskers represent the largest and smallest value within 1.5 times above or below the interquartile range, respectively.
Extended Data Fig. 10
Extended Data Fig. 10. Microglia clusters.
(a) UMAP of all microglia and BAM cells colored by cluster, major brain structure, sex, and age. (b) Constellation plot of microglia clusters colored by cluster. (c) Marker gene expression in microglia and BAM clusters organized in a dendrogram calculated from cluster DE genes. (d) Bar plot summaries for each cluster colored by brain structure, sex, age, and mapping label from Hammond et al. 2019 dataset. (e-f) Select GO terms enriched in marker genes computed from age-enriched clusters 842_Microglia and 843_Microglia. Enriched GO terms were identified using hypergeometric test and corrected for multiple testing as described in the Methods.
Extended Data Fig. 11
Extended Data Fig. 11. Tanycyte and ependymal cell clusters.
(a) Tanycyte and ependymal cell body locations in select samples from in situ spatial dataset RSTE3, colored by subclass label and relative expression of marker genes Gpr50 and Tm4sf1. (b) Select GO terms enriched in age-DE genes from tancyytes and ependymal cells split by genes with increased (light grey) or decreased (dark grey) expression with age. Terms that are unique to one cell type only are highlighted with a red border. Enriched GO terms were identified using hypergeometric test and corrected for multiple testing as described in the Methods. (c) UMAP of tanycytes and ependymal cells with additional tanycytes included from the ABC-WMB atlas that were collected in a reversed light/dark cycle. (d) Marker gene expression in tanycyte clusters organized in a dendrogram calculated from cluster DE genes. Bar plots show breakdown of each cluster by brain structure, sex, and age. (e) Bar plot summaries for each cluster colored by brain structure, sex, age, and adult cell label from the ABC-WMB atlas and corresponding location of tanycyte clusters in the ABC-WMB atlas MERFISH data. (f) Representative marker gene expression for adult tanycyte subtypes from RSTE3. (g) GO term enrichment in marker genes from age-depleted cluster 794_Tanycyte. (h) Ependymal cell clusters broken down by major brain structure, sex, and age with marker gene expression for each cluster. (i) GO term enrichment in marker genes from age-enriched cluster 799_Ependymal. Enriched GO terms were identified using hypergeometric test and corrected for multiple testing as described in the Methods. Source data
Extended Data Fig. 12
Extended Data Fig. 12. Hypothalamic neuronal clusters.
(a) UMAP of all hypothalamic neurons in the dataset colored by class, Slc17a6 expression (labelling glutamatergic neurons), and Slc23a1 expression (labelling GABAergic neurons). (b) Expression of select transcription factors, enzymes, neuropeptides, hormones, and receptors (mostly related to energy homeostasis signaling) across hypothalamic neuron clusters from select hypothalamic neuron subclasses that show the greatest numbers of age-DE genes. (c) Dot plot of age effect sizes of all genes from select hypothalamic neuron clusters (same ones as shown in b). Significant age-DE genes are colored. Clusters are ordered from the most to the least number of significant age-DE genes. (d) Zoomed-in view of areas similar to the boxed areas shown in panel f colored by cluster or gene expression of Bhlhe41 and Grm8 (left), and quantification of expression of these two genes from all samples from in situ dataset RSTE4. (e) Select GO terms enriched in age-DE genes from cluster 389_PVH-SO-PVa Otp Glut_4 (top) and heatmap of age effect sizes for select genes belonging to major enriched GO terms for all PVH-SO-PVa Otp Glut clusters. Asterisks denote significant changes. (f) Spatial localization of all PVH-SO-PVa Otp Glut clusters in representative adult and aged samples from RSTE3. (g) Zoomed-in view of boxed areas in f colored by cluster or gene expression of (top), and quantification of expression of H2-K1 from all samples from in situ dataset RSTE3. Enriched GO terms in e were identified using hypergeometric test and corrected for multiple testing as described in Methods. Significance between ages for spatial gene expression was tested using a two-sided Mann-Whitney U test. Results in panels d and g represent n = 4 biological replicates from per sex/age from RSTE3 and RSTE4, respectively. Only samples with > 10 cells of that cluster were included in the analysis, resulting in certain clusters per sex/age that have < 4 replicates shown. For all boxplots, the minimum, center, and maximum bound of the box represent the 25th, 50th, and 75th percentile of the data shown, respectively. The upper and lower whiskers represent the largest and smallest value within 1.5 times above or below the interquartile range, respectively. Source data
Extended Data Fig. 13
Extended Data Fig. 13. Age-DE genes across neuronal subclasses.
(a) Summary of the number of age-DE genes for each neuronal subclass. Far right: The total number of age-DE genes within each subclass, colored by cell class and ordered based on broad categories. Left and center: Bar graphs summarizing the breakdown of each subclass by major brain structure, age, and sex. (b) Cluster marker gene expression and supertype localization from the ABC-WMB atlas for PRP-NI-PRNc-GRN Otp Glut hindbrain neuron subclass. (c) Select GO term enrichment in age-DE genes from PRP-NI-PRNc-GRN Otp Glut subclass. All terms are enriched in genes that have decreased expression with age. Terms that are unique to only PRP-NI-PRNc-GRN Otp Glut are highlighted with red border. (d) Heatmap of age effect sizes of certain genes belonging to certain terms shown in c at the subclass and cluster levels. Asterisks represent significant age-DE genes as defined by adjusted p < 0.01 & abs(age effect size) > 1. (e) Summary of age-DE gene changes in L4 RSP-ACA Glut neurons, including in situ localization of cells and expression of Pde7b visualized from select samples from RSTE3. Also shown are select top GO enrichment terms in age-DE genes from L4 RSP-ACA Glut. (f) The subclasses with greatest numbers of primary response immediate early genes (PRGs) within original age-DE gene list (the summary in a has removed PRGs). (g) Top transcription factor motifs from the TRANSFAC database enriched within age-DE genes from L4 RSP-ACA Glut neurons. Results in panel e represent n = 2 biological replicates from RSTE3 per sex/age from the RSP region. For all boxplots, the minimum, center, and maximum bound of the box represent the 25th, 50th, and 75th percentile of the data shown, respectively. The upper and lower whiskers represent the largest and smallest value within 1.5 times above or below the interquartile range, respectively. Enriched GO terms from c and e and transcription factor motifs in g were identified using hypergeometric test and corrected for multiple testing as described in Methods.
Extended Data Fig. 14
Extended Data Fig. 14. Term enrichment scores for GO terms related to neuronal function and structure.
(a) Heatmaps of GO significance scores of terms related to collagen network (left) and age effect sizes of select collagen genes (right) for pericytes, SMCs, and VLMC supertype 2. (b) Heatmaps of GO significance scores of terms related to lipid metabolism (left) and age effect sizes of select lipid metabolism genes (right) for MOLs and DMH-LHA Gsx1 Gaba neurons. (c) GO term enrichment was performed across all non-neuronal supertypes and neuronal subclasses, using hypergeometric test and corrected for multiple testing as described in Methods. Cell subclasses or supertypes that have significant enrichment of terms (i.e., neurogenesis, neuron development, neuron differentiation, presynapse, postsynapse, axon development, axon guidance, axonogenesis, dendrite, and dendritic tree) are included in this figure, and GO enrichment scores are plotted in the heatmap here. Negative (blue) values represent terms enriched from genes with decreased expression with age; positive (red) values represent terms enriched from genes with increased expression with age. A term enriched in both negatively and positively changing genes from a cell subclass or supertype is denoted with an asterisk, and the direction with the lowest p-value is shown.

References

    1. Mattson, M. P. & Arumugam, T. V. Hallmarks of brain aging: adaptive and pathological modification by metabolic states. Cell Metab.27, 1176–1199 (2018). - PMC - PubMed
    1. López-Otín, C., Blasco, M. A., Partridge, L., Serrano, M. & Kroemer, G. The hallmarks of aging. Cell153, 1194–1217 (2013). - PMC - PubMed
    1. Yao, Z. et al. A high-resolution transcriptomic and spatial atlas of cell types in the whole mouse brain. Nature624, 317–332 (2023). - PMC - PubMed
    1. Hammond, T. R. et al. Single-cell RNA sequencing of microglia throughout the mouse lifespan and in the injured brain reveals complex cell-state changes. Immunity50, 253–271.e6 (2019). - PMC - PubMed
    1. Pan, J., Ma, N., Yu, B., Zhang, W. & Wan, J. Transcriptomic profiling of microglia and astrocytes throughout aging. J. Neuroinflammation17, 97 (2020). - PMC - PubMed

LinkOut - more resources