. 2025 Feb;638(8049):206-215.
doi: 10.1038/s41586-024-08352-6. Epub 2025 Jan 1.

Bone marrow niches orchestrate stem-cell hierarchy and immune tolerance

Affiliations

Bone marrow niches orchestrate stem-cell hierarchy and immune tolerance

Kazuhiro Furuhashi et al. Nature. 2025 Feb.

Abstract

Stem cells reside in specialized microenvironments, termed niches, at several different locations in tissues1-3. The differential functions of heterogeneous stem cells and niches are important given the increasing clinical applications of stem-cell transplantation and immunotherapy. Whether hierarchical structures among stem cells at distinct niches exist and further control aspects of immune tolerance is unknown. Here we describe previously unknown new hierarchical arrangements in haematopoietic stem cells (HSCs) and bone marrow niches that dictate both regenerative potential and immune privilege. High-level nitric oxide-generating (NOhi) HSCs are refractory to immune attack and exhibit delayed albeit robust long-term reconstitution. Such highly immune-privileged, primitive NOhi HSCs co-localize with distinctive capillaries characterized by primary ciliated endothelium and high levels of the immune-checkpoint molecule CD200. These capillaries regulate the regenerative functions of NOhi HSCs through the ciliary protein IFT20 together with CD200, endothelial nitric oxide synthase and autophagy signals, which further mediate immunoprotection. Notably, previously described niche constituents, sinusoidal cells and type-H vessels2-10 co-localize with less immune-privileged and less potent NOlow HSCs. Together, we identify highly immune-privileged, late-rising primitive HSCs and characterize their immunoprotective niches comprising specialized vascular domains. Our results indicate that the niche orchestrates hierarchy in stem cells and immune tolerance, and highlight future immunotherapeutic targets.


Conflict of interest statement

Competing interests: S.C.R. is a scientific founder of Purinomia Biotech and consults for eGenesis; his interests are reviewed and managed by HMFP at the Beth Israel Deaconess Medical Center following their conflict-of-interest policies. All other authors declare no competing interests.

Figures

Extended Data Figure 1:
Extended Data Figure 1:. Flow cytometric analysis of NOHi HSCs
a. NO staining. MFI of DAF-FM in different BM fractions. LSK: LinSca1+cKit+. Lin: Lin BM cells. Lin+: Lin+ BM cells. CD11b+: CD11b+ BM cells. CD11c+: CD11c+ BM cells. Treg: FoxP3+CD4+CD3+NK1.1 BM Tregs. non-Treg: FoxP3CD4+CD3+NK1.1 BM T cells. NK cell: NK1.1+CD3 BM NK cells. CD45: CD45Ter119 mesenchymal cells. N = 3. The results were analyzed by 1-way ANOVA with post hoc test with Bonferroni correction. b. Expression levels of CD200R in NOHi, NOLowCD200R+, or NOLowCD200R HSCs. Left: Representative flow cytometry plots illustrating the gating strategy to identify NOHi, NOLowCD200R+, or NOLowCD200R HSCs within CD150+CD48LinSca1+cKit+ HSCs. Right: Representative histograms. Red: NOHi HSCs. Blue: NOLowCD200R+ HSCs. Orange: NOLowCD200R HSCs. c. Ratios of CD200R MFIs to the average of MFIs in NOLowCD200R HSCs. The results were pooled from two independent experiments and analyzed by 1-way ANOVA with post hoc test with Bonferroni correction (total N = 8/each). d. NOS and CD150+CD48LinSca1+cKit+ HSCs. Flow cytometry data show correlations of NO levels with eNOS and nNOS.
Extended Data Figure 2:
Extended Data Figure 2:. NO expression indicates robust but late-rising HSCs
a. Serial transplantation assays. NOHi, NOLowCD200R+, or NOLowCD200R HSCs (10 cells/recipient; B6 SJL; CD45.1) were injected into tail veins of lethally irradiated B6 congenic recipient mice (CD45.2), together with competitor B6 BM cells (200,000 cells/recipient; CD45.2). Serial transplantation was performed twice at five-month intervals by transplanting BM cells (5 × 10⁶/each) of the recipient mice into irradiated B6 recipient mice (950cGly). Refer to Fig. 1g–k. b. CD45.1+ donor blood chimerism in B6 recipients transplanted with NOHi, NOLowCD200R+, or NOLowCD200R HSCs (B6 SJL). Donor chimerism was analyzed monthly. The results of the first and secondary transplantation are pooled from three independent experiments (three donors in total; 17–20 recipients per group). The third transplantation experiments includes 6–8 recipients/group. Data were analyzed by 1-way ANOVA with post hoc test with Bonferroni correction. 1st: first transplantation. 2nd: secondary transplantation. 3rd: third transplantation. c. Differential patterns of blood reconstitution derived from NOHi, NOLowCD200R+, or NOLowCD200R HSCs. Reconstitution patterns were categorized as in Extended Data Fig. 2d. d. Differential reconstitution patterns. e. Trend of CD45.1+ donor chimerism over the 1st, 2nd, and 3rd transplantation. Experiments include 6–8 recipients/group. The colors of the trend lines correspond to those of the differential reconstitution patterns shown in Extended Data Fig. 2d. f. Lineage skewing analyses. These were done using CD45.1+ donor blood cells in B6 recipient mice at 16 weeks after the transplantation of NOHi or NOLowCD200R+ HSCs (B6 SJL). N = 5‒10. The results were pooled from three independent experiments. Frequencies of myeloid cells, T cells, and B cells in CD45.1+ donor blood cells were analyzed by two-sided Student’s t-test. All data are presented as mean ± SD. Asterisks indicate significant differences (p-value <0.05, *; <0.01, **; <0.001, ***; <0.0001, ****; N.S., >0.05).
Extended Data Figure 3:
Extended Data Figure 3:. Use of the higher dose of competitor cells frequently induced late-rising reconstitution from NOHi HSCs
a-e. Competitive transplantation assays. NOHi or NOLow HSCs (10 cells/recipient; B6 SJL; CD45.1) were injected into tail veins of lethally irradiated B6 congenic recipient mice (CD45.2), together with competitor B6 BM cells (300,000 cells/recipient; CD45.2). The secondary (2nd) transplantation of the recipient BM cells (5,000,000 cells/recipient) to lethally irradiated B6 mice was performed four months after the first (1st) transplantation. Data are pooled from four independent experiments (four donors in total; 20 recipients per group). a. Blood reconstitution patterns derived from NOHi or NOLow HSCs. The colors of the trend lines correspond to those of the differential reconstitution patterns shown in Extended Data Fig. 3d‒e. b. CD45.1+ donor blood chimerism following the 1st and 2nd transplantation. Data are presented as mean ± SD and analyzed by two-sided Student’s t-test. c. Extent of chimerism at 12 weeks after the 2nd transplantation relative to that at five weeks after the 1st transplantation. Used 0.1% for the undetectable chimerism at five weeks after the 1st transplantation. Data were analyzed by two-sided Student’s t-test. d. CD45.1+ donor chimerism over the 1st and 2nd transplantation. Late-rising after the 2nd transplantation (red): Chimerism <1% from two to five months after the 1st transplantation but >2% following the 2nd transplantation. Come-back (pink): Chimerism initially >1% at five weeks after the 1st transplantation but <1% from two to three months after the 2nd transplantation; while returned to be >2% three months after the 2nd transplantation. Late-rising prior to the 2nd transplantation (orange): Chimerism <1% for two to three months after the 1st transplantation but >2% from three to four months following the 1st transplantation. Increasing pattern (dark blue): Chimerism >1% throughout the 1st and 2nd transplantation but exhibited at least a five-fold increase, both at four months after the 1st transplant and at three months after the 2nd transplant, as compared to chimerism at three weeks after the 1st transplant. Persisting pattern (light blue): Chimerism >1% throughout the 1st and 2nd transplant but demonstrated less than a two-fold increase at four months after the 2nd transplant, as compared to chimerism at three weeks after the 1st transplant. Exhausting pattern (brown): Chimerism initially >1% at three or five weeks after the 1st transplant but decreases three months after the 1st transplant and eventually <1% after the 2nd transplant. Not engrafted (gray): Chimerism that remained less than 1% throughout the 1st and 2nd transplant. e. Differential patterns of donor reconstitutions among recipients of NOHi or NOLow HSCs. All data are presented as mean ± SD. Asterisks indicate significant differences (p-value <0.05, *; <0.01, **; <0.001, ***; <0.0001, ****; N.S., >0.05).
Extended Data Figure 4:
Extended Data Figure 4:. BM NOHi HSCs are frequently contained within C1q+CD200RHiSSCHi HSCs
a. Gating strategy to enrich NOHi HSCs without using DAF-FM. NOHi HSCs are enriched within C1q+CD200R+SSCHiCD150+CD48LinSca1HicKit+ HSCs. b. NOHi HSC frequencies. These were shown in C1q+CD200R+SSCHiCD150+CD48LinSca1HicKit+ HSCs and CD150+CD48LinSca1+cKit+ HSCs. N = 6. The results were pooled from three independent experiments. The results were analyzed by two-sided Student’s t-test. c. CD45.1+ donor chimerism in the secondary recipients transplanted with C1q+CD200R+SSCHiCD150+CD48LinSca1HicKit+ HSCs. C1q+CD200R+SSCHiCD150+CD48LinSca1HicKit+ HSCs (15 cells/recipient; B6 SJL; CD45.1) were injected into tail veins of lethally irradiated B6 congenic recipient mice (CD45.2), together with competitor B6 BM cells (200,000 cells/recipient; CD45.2). The secondary (2nd) transplantation of the recipient BM cells (5,000,000 cells/recipient) to lethally irradiated B6 mice was performed six months after the first (1st) transplantation. The results were pooled from three independent experiments (three donors, ten recipients/group in total) and analyzed using the Mann–Whitney U test for non-parametric two-group comparison. d. Ratio of chimerism at four weeks after the secondary transplantation to chimerism at five weeks after the first transplantation of C1q+CD200R+SSCHiCD150+CD48LinSca1HicKit+ HSCs. The results were analyzed by two-sided Mann‒Whitney U test for non-parametric two-group comparison. e. NOHi HSCs reside predominantly in the BM. Right: Representative flow cytometric plots of peripheral blood (PB) cells (upper) and NOHi HSCs (lower), demonstrating the staining levels of intravenously injected APC-conjugated CD45 antibodies and PE-conjugated CD45 antibodies stained ex vivo. The B6 mice received tail vein injections of APC-conjugated CD45 antibodies. BM cells were harvested 5 min after the injection and stained with PE-conjugated CD45 antibodies ex vivo. Left: Frequencies of PB cells, NOHi HSCs and NOLow HSCs stained with intravenously injected APC-CD45 antibodies. N = 5. The results were pooled from three independent experiments. The results were analyzed by 1-way ANOVA with post hoc test with Bonferroni correction. f. Frequencies of G-CSF receptor- and CXCR4-expressing cells within NOHi HSCs and NOLow HSCs. N = 5. The results were analyzed by Student’s t-test. All data are presented as mean ± SD. Asterisks indicate significant differences (p-value <0.05, *; <0.01, **; <0.001, ***; <0.0001, ****; N.S., >0.05).
Extended Data Figure 5:
Extended Data Figure 5:. CD200Hi capillaries preferentially localize at the metaphyseal endosteum
a. Confocal microscope images of the long BMs. Left: Z-projection of confocal image stacks of whole-mount BMs (sum of 61 slices; 3 μm steps; z = 180 μm in total). CD200 signals (magenta) at the metaphysis endosteum are denser than those at the diaphysis endosteum. CD200 signals are scarcely found in the central marrow region. BM endothelial vessels (green) are distributed throughout the BM cavity. Magenta: Q655-CD200. Green: Alexa 568-IB4. The scale bar indicates 200 μm. Right: Confocal image demonstrating the vascular network at the metaphysis. CD200Hi capillary beds (magenta) surround transitional regions from BM arterioles (red) into EMCN+ type H vessels (cyan). Magenta: Q655-CD200. Cyan: Alexa 488-EMCN. Green: Alexa 568-IB4. Red: Cy3-Sca1. C: CD200Hi capillaries. A: Arterioles. H: Type H vessels. The scale bar indicates 20 μm. Refer to Supplementary Videos 1–3. b. Sca1 and IB4 signals in “fine” CD200Hi capillaries (< 3–4 μm in diameter) confirmed by zooming high-resolution images (1024 × 1024 or 2048 × 2048 pixels) and/or by increasing signal amplitudes. Upper: Confocal image of CD200Hi capillaries stained with Alexa 594-Sca1 antibodies (red) and Alexa 647-IB4 antibodies (green) but not with Alexa 488-EMCN antibodies (cyan). Red: Alexa 594-Sca1. Green: Alexa 647-IB4. Cyan: Alexa 488-EMCN. Magenta: Q655-CD200. The scale bar indicates 20 μm. Lower: Maximum intensity z-projection of confocal image stacks of whole-mount BMs achieved by selecting the highest signal value of each pixel along the z-axis (9 slices; 1 μm steps; z = 9 μm in total). Confocal image of CD200Hi capillaries stained with Alexa 568-Sca1 antibodies (red) and Alexa 647-IB4 antibodies (green) but not with Alexa 488-EMCN antibodies (cyan). Red: Alexa 568-Sca1. Green: Alexa 647-IB4. Cyan: Alexa 488-EMCN. Magenta: Q655-CD200. The scale bar indicates 50 μm. CD200HiIB4+Sca1+capillaries (C) surround Type H vessels (H) and arterioles (A). Refer to Supplementary Figure 2a‒h. c. Confocal image of Q655-CD200Hi capillaries co-stained with anti-CD31 antibodies. Green: CD31-APC. Magenta: Q655-CD200. The scale bar indicates 20 μm. d. Confocal image of Q655-CD200Hi capillaries in tamoxifen-treated VECadcreERT2 × Rosa26TdTomato mice. Tamoxifen treatments (intraperitoneal; 1 mg) were performed on Days 0–4, and BMs were isolated on Day 7. Amongst TdTomato+ BM endothelial cells (green), Q655-CD200 signals (magenta) identify fine capillaries (< 2–3 μm in diameter) on the metaphysis endosteum. Green: VECadcreERT2 × Rosa26TdTomato. Magenta: Q655-CD200. The scale bar indicates 20 μm.
Extended Data Figure 6:
Extended Data Figure 6:. Characterization of CD200Hi capillaries: cytometric and transcriptome profiles
a. Representative flow cytometry plots illustrating the gating strategy to identify CD200Hi capillaries, Type H vessels, other arterial fractions, and sinusoids. CD200Hi capillaries (CD200HiEMCNSca1+CD31+CD45) are exclusively found within Sca1HiCD31HiCD140bInt–HiCD45. Type H vessels (EMCN+Sca1+CD31+CD45) are frequently found within Sca1IntCD31HiCD140bInt–HiCD45. Other arterial fractions (EMCN Sca1+CD31+CD45) are frequently found within Sca1IntCD31IntCD140bInt–LowCD45. b. Frequencies of: Sca1HiCD31HiCD140bInt–HiCD45; Sca1IntCD31HiCD140bInt–HiCD45; and Sca1IntCD31IntCD140bInt–LowCD45 fractions within: CD200Hi capillaries; Type H vessels; and other arterial fractions. The experiment included four mice from four independent experiments. The results were analyzed by 1-way ANOVA with post hoc test with Bonferroni correction. c. Representative flow cytometric plots illustrating the expression levels of Arl13b-mCherry and Centrin2-GFP within different BM mesenchymal factions in Arl13b-mCherry Centrin2-GFP mice. d. Flow cytometric analysis of CD106, CD54, and LYVE1 expression in CD200Hi capillaries, Type H vessels, other arterial fractions, and sinusoids. Frequencies of CD106-, CD54-, and LYVE1-expressing cells within each vascular fraction. The results were analyzed by 1-way ANOVA with post hoc test with Bonferroni correction. N = 4. e. Multi-Dimensional Scaling Plot showing tight intra-sample variability per sample type across all profiled samples: CD200Hi capillaries (CD200); EMCN+ Type H vessels (Type H); other arterial fractions (Artery); and sinusoids (Sinusoid). f. Gene set enrichment analysis (GSEA) demonstrating CD200Hi capillaries upregulate representative gene signatures of sprouting, immature capillaries and Sonic Hedgehog Pathway. CD200Hi capillaries upregulate the following gene signatures of arterial vessels; immature blood vessels; capillaries; tip cell genes; vasculogenesis; endothelium development; artery development; and Sonic Hedgehog pathway. Normalized enrichment score and q-value are shown in each panel. CD200: CD200Hi capillaries. Type H: Type H vessels. Artery: Other arterial fractions. Sinusoid: Sca1-CD31+CD45- cells. g. GO enrichment analysis demonstrating the top 30 GO terms. Left: Dot plots in biological process (CD200 vs. Sinusoid). Middle: Dot plots in biological process (CD200 vs. Other Arterial). Right: Ridge plots in the cellular compartment (CD200 vs. Type H). Various adaptive and innate immunoregulatory genes (blue arrows) and gene signatures in relationship to vascular development and sprouting (pink arrows) are upregulated in CD200Hi capillaries (CD200) in comparison with Type H vessels (Type H), Other arterial fractions (Other Arterial), and Sinusoids (Sinusoid). The results presented are significant after Benjamini-Hochberg multiple testing correction was applied. h. Unsupervised Hierarchical clustering and heatmap demonstrating differential expression levels of genes representative of HSC regulatory molecules and angiogenic receptors in: CD200Hi capillaries (Cd200); EMCN+ Type H vessels (Type H); other arterial fractions (Artery); and sinusoids. Three biological replicates are shown per sample type. Each row of the heatmap represents the z-score transformed log(CPM) values across all samples (blue, low expression; red, high expression). i. Flow cytometric analysis of expression levels of angiogenic receptors and angiocrine HSC regulators in CD200Hi capillaries, Type H vessels, other arterial fractions, and sinusoids. Top two rows: Representative histograms. Bottom two rows: Frequencies of: Tie1-; Tie2-; VEGFR1-; VEGFR2-; VEGFR3-; SCF-; BMP2-; BMP4-; and DLL4-expressing cells. Frequencies were measured in comparison with isotype control antibody staining. MFIs of SCF expression are also shown. The results were analyzed by Student’s t-test. N = 4–9/group. The results were pooled from two to three independent experiments. All data are presented as mean ± SD. Asterisks indicate significant differences (p-value <0.05, *; <0.01, **; <0.001, ***; <0.0001, ****; N.S., >0.05).
Extended Data Figure 7:
Extended Data Figure 7:. Ciliated endothelium noted within metaphyseal capillaries
a. Tissue scanning electron microscope images of whole-mounted long bones. By zooming in whole-mounted long bones (upper right), metaphyseal BM regions within ~150 μm from the endosteum surface at the epiphyseal line were identified. The lowest bottom two pictures demonstrate fine capillaries (< 2–4 μm in diameter) branching from bigger blood vessels (over 10 μm in diameter). A total of six bones were imaged. Total six independent experiments. The size of the scale bar was indicated in each picture. b. Representative tissue scanning electron microscope images of ciliated structures on metaphyseal capillaries. Ciliated structures project into the lumen of metaphyseal capillaries. The lengths are 1 to 10 μm. The size of the scale bar was indicated in each picture. Refer to Supplementary Video 4. A total of six bones were imaged. Total six independent experiments. c. Representative electron microscope image of diaphyseal sinusoids (over 100 μm in diameter). The ciliated structures were not found on the sinusoid endothelium. The size of the scale bar was indicated in each picture. A total of six bones were imaged in six independent experiments.
Extended Data Figure 8:
Extended Data Figure 8:. NOHi HSCs localize at CD200Hi capillaries, while NOLow HSCs are at metaphyseal Type H vessels or sinusoids
a. Histological images illustrating the localization of NOHi and NOLow CD150+HSCs. NOHiCD150+CD48Lin HSCs (yellowish) localize at CD200Hi capillaries (magenta), both at the metaphysis and diaphysis. NOLowCD150+CD48Lin HSCs (red) localize at EMCN+ Type H vessels (cyan) in the metaphysis and at sinusoids (blue) in the diaphysis. Green: DAF-FM. Red: Alexa 568-CD150. Grey: BV421-Lin/CD48. Cyan: APC-R700-EMCN. Magenta: Q655-CD200. Blue: Alexa 647-IB4. The scale bar indicates 20 μm. Refer to Supplementary Videos 5–8. b. Histological images illustrating the localization of NOHi and NOLow Pdzk1ip1creER × ROSA26TdTomato HSCs in tamoxifen-treated Pdzk1ip1creER × ROSA26TdTomato mice. NOHiTdTomato+CD48Lin HSCs (yellowish) localize at CD200Hi capillaries (magenta), both at the metaphysis and diaphysis. NOLowTdTomato+CD48Lin HSCs (red) localize at type H vessels (cyan) in the metaphysis and at sinusoids (blue) at the diaphysis. Long bones were harvested three days after tamoxifen treatment (oral gavage, 1 mg) in Pdzk1ip1creER × ROSA26TdTomato mice. Green: DAF-FM. Red: Pdzk1ip1creER × ROSA26TdTomato. Grey: BV421-Lin/CD48. Cyan: IB4-Alexa 647 (metaphysis). Blue: IB4-Alexa 647 (diaphysis). Magenta: Q655-CD200. The scale bar indicates 20 μm. Refer to Supplementary Videos 9–12. c. Histological images illustrating the localization of NOHi and NOLow CD150+HSCs. NOHiCD150+CD48Lin HSCs (yellowish) localize at metaphysis CD200Hi capillaries (magenta), and NOLowCD150+CD48Lin HSCs (red) localize at sinusoids (cyan) in the diaphysis. Green: DAF-FM. Red: CD150-Alexa 568. Blue: BV421-Lin/CD48. Grey: Hoechst 33342. Cyan: Alexa 647-CD31. Magenta: Q655-CD200. The scale bar indicates 20 μm. d. Distances of NOHi and NOLow HSCs concerning CD200Hi capillaries (CD200Hi), Type H vessels (Type H), and sinusoids. Top two rows: NOHi and NOLow CD150+CD48Lin HSCs. Bottom two rows: NOHi and NOLow TdTomato+CD48Lin HSCs in tamoxifen-treated Pdzk1ip1creER × ROSA26TdTomato mice. Automated analysis was performed using Imaris software (Bitplane). Refer to Fig. 2h. The results were pooled from the experimental results using six long bones from five mice for CD150 staining, and five long bones from five mice for Pdzk1ip1creER × ROSA26TdTomato mice and analyzed by Kruskal-Wallis with Dunn’s post hoc test for nonparametric multi-group comparison. Pooled from six long bones isolated from 5–6 mice for each analysis. The total numbers of analyzed HSCs are shown in each graph. All data are presented as mean. Asterisks indicate significant differences (p-value <0.05, *; <0.01, **; <0.001, ***; <0.0001, ****; N.S., >0.05).
Extended Data Figure 9:
Extended Data Figure 9:. IFT20 maintains capillary expression of CD200, which upregulates eNOS levels in HSCs via CD200R, controlling NOHi HSC abundance and function
a. Experimental scheme to illustrate targeted deletions and knockdown studies. b. Representative histogram of NO levels in CD150+CD48LinSca1+cKit+ HSCs in tamoxifen-treated VECadcreERT2 × CD200flox/flox, VECadcreERT2 × IFT20flox/flox, and VECadcreERT2 × CD200flox/flox × IFT20flox/flox mice. Experiments were performed as shown in Fig. 3a. 200KO: Tamoxifen-treated VECadcreERT2 × CD200flox/flox mice. IFTKO: Tamoxifen-treated VECadcreERT2 × IFT20flox/flox mice. DKO: Tamoxifen-treated VECadcreERT2 × CD200flox/flox × IFT20flox/flox mice. Ct: Tamoxifen-treated VECadcreERT2 mice. c. Flow cytometric analysis of the expression levels of nNOS and eNOS in tamoxifen-treated VECadcreERT2 × CD200flox/flox and VECadcreERT2 × IFT20flox/flox mice. The experiment was performed as shown in Fig. 3a. d. Frequencies of NOLow HSCs in BM cells in tamoxifen-treated VECadcreERT2 × CD200flox/flox, VECadcreERT2 × IFT20flox/flox, and VECadcreERT2 × CD200flox/flox × IFT20flox/flox mice. The experiment was performed as shown in Fig. 3a. e. Lineage skewing analysis. This was performed in CD45.2+ donor blood cells in SJL recipient mice 16 weeks after the transplantation of HSCs (left) and BM cells (right) isolated from tamoxifen-treated VECadcreERT2 × CD200flox/flox, VECadcreERT2 × IFT20flox/flox, and VECadcreERT2 × CD200flox/flox × IFT20flox/flox mice. Transplantation was performed as shown in Fig. 3c. The ratios of lymphoid cell frequencies (T cells and B cells) to myeloid cell frequencies were analyzed by 1-way ANOVA with post hoc test with Bonferroni correction. f. Flow cytometric analysis of endothelial fractions in the BMs of tamoxifen-treated VECadcreERT2 × CD200flox/flox, VECadcreERT2 × IFT20flox/flox, and VECadcreERT2 × CD200flox/flox × IFT20flox/flox mice. Frequencies of Sca1Hi capillaries (Sca1HiCD31+CD45), Sca1+ arterial fractions (Sca1+CD31+CD45), sinusoidal cells (Sca1CD31+CD45), and endothelial cells (CD31+CD45) in BM cells were analyzed. Sca1Hi: Defined as expression levels of Sca1 in the top 20% of Sca1+ arterial fractions of tamoxifen-treated VECadcreERT2 control mice, on average. Tamoxifen treatments (1 mg; intraperitoneal) were performed on Days 1–5 and 22–26. Analysis was performed on Day 43. g-j. Knockdown of CD200R using AntiSense Oligonucleotides (ASO/FANA-ASO). Decreases in expression levels of CD200R (formally known as Cd200r1) were accomplished by designing ASO (antisense) sequences selectively targeting the coding sequence of Cd200r1 mRNA; carefully avoiding any overlap with its identified isoforms. The lack of mRNA expression of isoforms CD200R2, CD200R3, and CD200R4 in NOHi and NOLow HSCs has been confirmed (data not shown). g. qRT-PCR analysis demonstrating the downregulation of expression levels of CD200R1 and eNOS mRNAs in HSCs. Pools of ASOs targeting the coding sequence of CD200R1 mRNA and a non-targeting scramble control were delivered into HSCs at concentration of 2.5 μM. qRT-PCR analysis was performed by collecting samples at 48 hours. KD: CD200R1-antisense. Ctrl: non-targeting scramble control. h-i. Competitive transplantation of NOHi HSCs following antisense-mediated CD200R knockdown. Sorted NOHi or NOLow HSCs (B6 SJL; 45.1) were incubated for 22 hours after the antisense-mediated CD200R knockdown. Subsequently, HSCs (65 HSCs/recipient) were injected into the tail veins of lethally irradiated B6 mice with competitor B6 BM cells (220,000 competitor cells/recipient). h. Trends of CD45.1+ donor chimerism derived from NOHi HSCs transduced with CD200R1-antisense (CD200R1KD) or non-targeting scramble control (Ctrl). i. CD45.1+ donor chimerism 16 weeks after transplantation of NOLow HSCs transduced with CD200R1-antisense (CD200R1 KD) or non-targeting scramble (Ctrl). j. Homing frequencies of DiD-labeled NOHi HSCs transduced with CD200R1-antisense (CD200R1 KD) or non-targeting scramble (Ctrl). DiD-labeled NOHi HSCs (B6; 400 cells/mouse) transduced with CD200R1-antisense or non-targeting scramble were intravenously injected into B6 recipients. The numbers of donor HSCs noted in the 3D image stacks of the identical regions of the skull BMs (1500 μm [x] × 1800 μm [y] × 120 μm [z]). k. BM cell numbers and frequencies of HSCs and NOHi HSCs in Leprcre × CD200flox/flox mice, tamoxifen-treated BmxcreERT2 × CD200flox/flox mice, and tamoxifen-treated NG2creERTM × CD200flox/flox mice. Tamoxifen treatments (intraperitoneal; 1 mg/each; five consecutive days) were performed on Days 1–5. BM cells were harvested from the two tibias and two femurs from each mouse and analyzed on Day 22. l. Histological images of metaphyseal BMs isolated from tamoxifen-treated VECadcreERT2 × IFT20flox/flox × ROSA26TdTomato mice and VECadcreERT2 × ROSA26TdTomato mice. Histological image is a Z-projection of confocal image stacks of whole-mount BMs (sum of 61 slices; 5 μm steps; z = 300 μm in total). Red: BODIPY. Green: TdTomato. The scale bar indicates 200 μm. m. Numbers of ciliated structures in the metaphyseal capillary endothelium in tamoxifen-treated VECadcreERT2 × IFT20flox/flox and VECadcreERT2 mice. A total of 14‒15 images, each containing 50‒200 μm2 of the metaphyseal capillary endothelium, were acquired from three mice per group. Numbers of ciliated structures (> 1 μm in length) per 100 μm2 of the metaphyseal capillary endothelium in each image, were quantified using Image J. The tamoxifen treatment and BM harvest were performed as shown in Fig. 3a. n. Numbers of BM cells, MPPs, HSCs, NOHi HSCs and CD200Hi capillaries in tamoxifen-treated UBCcreERT2 × IFT88flox/flox mice. Tamoxifen treatments (intraperitoneal; 1.5 mg/each; five consecutive days) were performed twice on Days 1–5 and Days 22–26. BM cells were harvested from two tibias and two femurs from each mouse and analyzed on Day 43. Ct: tamoxifen-treated IFT88flox/flox mice. KO: Tamoxifen-treated UBCcreERT2 × IFT88flox/flox mice. o. CD45.2+ donor chimerism after the competitive transplantation of NOHi HSCs from Pdzk1ip1creER × eNOSflox/flox mice (CD45.2) with competitor SJL BM cells into SJL recipients. Tamoxifen treatment and transplantation were performed as in the studies shown in Fig. 3g. Left: Ratio of CD45.2+ donor blood chimerism at 16 weeks to chimerism at five weeks after the competitive transplantation of NOHi HSCs from Pdzk1ip1creER × eNOSflox/flox mice (CD45.2) and competitor SJL BM cells into SJL recipients. The results were analyzed by the Mann–Whitney U test for non-parametric two-group comparison. Right Upper: Reconstitution trends. Right Lower: Differential patterns of donor reconstitutions among recipients. Late-rising pattern (red): Chimerism <2.5% up to 12 weeks after the transplantation but became >10% at 16 weeks. Increasing pattern (dark blue): Chimerism >10% at five weeks but exhibited at least a three-fold increase at 16 weeks, as compared to chimerism at three weeks. Persisting pattern (light blue): Chimerism >5% from three weeks until 16 weeks, but the ratio at 16 weeks to that at three weeks was between 0.5 and 2. Exhausting pattern (brown): Chimerism >5% at five weeks but exhibited gradual reductions and at 16 weeks became less than half of the chimerism at five weeks. p. Lineage skewing analysis. This was performed in donor blood cells (left) in SJL recipient mice 16 weeks after transplantation of NOHi HSCs isolated from Pdzk1ip1creER × eNOSflox/flox mice (CD45.2), as well as in endogenous peripheral blood cells (right) in Pdzk1ip1creER × eNOSflox/flox mice 16 weeks after tamoxifen treatment. Transplantation was performed as shown in Fig. 3g. Refer to Fig. 3i for the analysis of endogenous peripheral blood cells (N = 4/group). The ratios of lymphoid cell frequencies (T cells and B cells) to myeloid cell frequencies were analyzed by Student’s t-test. q. BM homing frequencies of transplanted HSCs isolated from Pdzk1ip1creER × eNOSflox/flox mice. HSCs were sorted from BMs of Pdzk1ip1creER × eNOSflox/flox or Pdzk1ip1creER × eNOSwt/wt mice (B6; CD45.2), labeled by DiD ex vivo, and intravenously injected (1300 cells/recipient) into B6 recipients. Tamoxifen treatment in donor NOHi HSCs was performed ex vivo for six hours before transplant, as well as in recipients four hours before transplantation (intraperitoneal; 1 mg). The skull BMs were isolated two hours after the injection. The numbers of donor HSCs in the 3D images at the identical regions of the skull BMs (1500 μm [x] × 1800 μm [y] × 120 μm [z]) were counted. The results were pooled from two independent experiments (N = 2 donors/group; N = 6 recipients/group in total). r. Representative flow cytometric plots of BM HSCs 4 days after tamoxifen treatment in Pdzk1ip1creER × eNOSflox/flox mice. Tamoxifen (1 mg; oral gavage) was administered. s. Frequencies of MitoSOX+ cells within NOHi and NOLow HSCs. t. Frequencies of MitoSOX+ cells within NOHi and NOLow HSCs isolated from tamoxifen-treated Pdzk1ip1creER × eNOSflox/flox mice. NOHi HSCs were defined as cells that exhibited the top 40% levels of DAF-FM in whole HSCs from control tamoxifen-treated Pdzk1ip1creER mice. All data are presented as mean ± SD. Asterisks indicate significant differences (p-value <0.05, *; <0.01, **; <0.001, ***; <0.0001, ****; N.S., >0.05). See Supplementary Notes for sample sizes, experimental replicates, and statistical analyses. See the Source Data file for individual p-values.
Extended Data Figure 10:
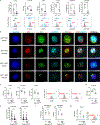
Extended Data Figure 10:. eNOS regulates regenerative functions of NOHi HSCs, at least in part, via modulation of autophagic activities
a. Flow cytometry analysis of the levels of LC3B, CYTO-ID, LAMP1, CTSA, LAMTOR1, and LAMTOR2 in NOHi and NOLow HSCs. LAMP1 and CYTO-ID: MFI ratios to the average of MFIs of NOLow HSCs. LC3B, CTSA, LAMTOR1 and LAMTOR2: Frequencies measured in comparison with isotype control antibody staining. Right: Representative histograms. b. Representative immunostaining images demonstrating the distribution of NO, LC3B, and CD200R signals within NOHi and NOLow HSCs. Sorted NOHi and NOLow HSCs were fixed and stained with Alexa 568-conjugated LC3B antibodies. Basal autophagic activities were evaluated immediately after HSC sorting, while induced autophagy was evaluated following ex vivo incubation for three hours after sorting. CD200R antibody staining was performed before the sorting. Green: DAF-FM. Red: Alexa 568-LC3B. Cyan: Alexa 647-CD200R. Both under basal and induced conditions, NOHi HSCs exhibit higher intensities of LC3B+ signals when compared to NOLow HSCs, and NO signals within NOHi HSCs frequently localize at LC3B+ autophagosomes. Following ex vivo culture, CD200R signals aggregate near NO+LC3+ autophagosomes. c. Flow cytometry analysis of the levels of LC3B, CTSA and CYTO-ID in NOHi HSCs isolated from tamoxifen-treated Pdzk1ip1creER × eNOSflox/flox mice. Right: Representative histograms. Left: Ratio of MFI to the average of MFIs of HSCs from tamoxifen-treated Pdzk1ip1creER × eNOSwt/wt mice. Long bones were harvested four days after tamoxifen treatment (oral gavage, 1 mg). NOHi HSCs are defined as HSCs that exhibit DAF-FM signals at levels in the top 40% of whole HSCs in tamoxifen-treated Pdzk1ip1creER × eNOSwt/wt mice. d. CYTO-ID staining levels in HSCs in tamoxifen-treated VECadcreERT2 × CD200flox/flox mice. N = 6–8/group, pooled from two independent experiments. The results were analyzed by Student’s t-test. e. Donor chimerism in SJL recipients 16 weeks post-transplantation of NOHi HSCs from Pdzk1ip1creER × Atg7flox/flox mice (Atg7KO). f. NOHi HSC frequencies and numbers in tamoxifen-treated Pdzk1ip1creER × Atg7flox/flox mice. N = 4–6/group. The results were pooled from five independent experiments. Tamoxifen treatment was performed four days before the analysis. Student’s t-test. g. Flow cytometry analysis of the expression levels of DLL4 in capillaries isolated from tamoxifen-treated Pdzk1ip1creER × eNOSflox/flox mice. Right: Representative histograms. Left: Ratio of MFI to the average of MFIs in capillaries from control tamoxifen-treated Pdzk1ip1creER × eNOSwt/wt mice. Long bones were harvested four days after tamoxifen treatment. Capillaries were defined as cells that exhibited the top 20% levels of CD200 in CD31+Sca1+CD45- cells in each analysis. N = 4‒6. Student’s t-test. All data are presented as mean ± SD. Asterisks indicate significant differences (p-value <0.05, *; <0.01, **; <0.001, ***; <0.0001, ****; N.S., >0.05). See Supplementary Notes for sample sizes, experimental replicates, and statistical analyses. See the Source Data file for individual p-values.
Extended Data Figure 11:
Extended Data Figure 11:. CD200 expression by capillary endothelium provides immunoprotection of NOHi HSCs
a. Homing frequencies of DiD-labeled NOHi and NOLow HSCs in allo- and syn-recipients. DiD-labeled NOHi and NOLow HSCs (B6; 400 cells/mouse) were intravenously injected into non-irradiated B10.A and B6 recipients. The numbers of donor HSCs in the 3D image stacks of the identical regions of the skull BMs (1500 μm [x] × 1800 μm [y] × 120 μm [z]) were counted on Day 1. The results were pooled from two independent experiments (N = 3–5/group) and analyzed by Student’s t-test. b. Number of DiD-labeled donor NOHi and NOLow HSCs (B6) that persisted in the BMs after intravenous injection into non-conditioned immunocompetent B10.A (allo-; upper) and B6 (syn-; lower) recipients for 14 days. c. Blood chimerism derived from NOHi and NOLow donor HSCs (B6 SJL). This was analyzed 16 weeks after transplantation into conditioned B10.A (allo) recipients. B10.A (H2Dd+) recipient mice received 3-Gy irradiation, followed by intravenous injection of NOHi and NOLow B6 SJL HSCs (500/each; CD45.1; H2Kb+) together with B6 competitor BM cells (2 × 10⁷/each; CD45.2; H2Kb+). Anti-CD8 mAb was intraperitoneally injected on Day −1 and anti-mouse CD40L mAb was injected on Day 0. The H2Kb+H2DdCD45.2CD45.1+ donor blood frequencies were analyzed. The experiment included nine recipients/group. The results were analyzed by Student’s t-test. d. Lineage skewing analysis 12 weeks after transplantation of NOHi or NOLow HSCs into allo-recipients (B10.A) as in Extended Data Fig. 11c. The ratios of myeloid cell frequencies to lymphoid cell frequencies (T cells and B cells) were analyzed by Student’s t-test. N = 5. e. Expression levels of MHC class I (H2Kb; left) and MHC class II (I-A/I-E; right) molecules on NOHi and NOLow HSCs. The ratio of MFI to the average of NOLow HSCs’ MFIs pooled from three independent experiments (total N = 11/each). Data were analyzed by Student’s t-test. f. Representative histograms illustrating expression levels of CD39 and PDL1 in CD200Hi capillaries, Type H vessels, other arterial fractions, sinusoids, CD140b+CD31CD45, mesenchymal fractions, and CD140bCD31CD45 mesenchymal fractions. Refer to Extended Data Fig. 6a for the gating strategy. g. Frequencies of CD44Hi activated niche Tregs (left) and niche Tregs (right) in metaphysis vs. diaphysis. Niche Tregs: BM Tregs that express CD150 at levels in the top 35% of all BM Tregs. h. Representative flow cytometric plots of FoxP3+ Tregs (FoxP3+CD4+CD3+NK1.1) in the metaphysis (right) and diaphysis (left) BMs. i. Representative histograms of expression levels of PDL1 (left) and CD44 (right) in CD150Hi niche Tregs (CD150HiFoxP3+CD4+CD3+NK1.1) in the metaphysis (red) and diaphysis (blue) BMs. CD150Hi: Expression levels of CD150 in the top 35% of all BM Tregs. j. Frequencies of PDL1Hi cells in CD4+ non-Tregs (left) and CD8+ T cells (right) in the metaphysis and diaphysis BMs. The results were pooled from two independent experiments (N = 9–10/group). The results were analyzed by Student’s t-test. Representative histograms of expression levels of PDL1 in CD4+ non-Tregs (FoxP3CD4+CD3+NK1.1; left) and CD8+ T cells (CD8+CD3+NK1.1; right) in the metaphysis (red) and diaphysis (blue) BMs. k. Confocal image demonstrating the preferential homing of DiD-labeled NOHi donor HSCs (green; B6) at recipient CD200Hi capillaries (Magenta; B6) in the long BMs, one day after intravenous injection into the tail veins. The scale bar indicates 20 μm. l. Ratios of PDL1 MFIs of BM CD11b+ myeloid cells in tamoxifen-treated VECadcreERT2 × CD200flox/flox mice to the MFI average in the tamoxifen-treated control VECadcreERT2 mice. m. Flow cytometric analysis of MFI of CD200R in CD150Hi niche Tregs; CD150Low non-niche Tregs in the BM; and lymph node (LN) Tregs. The results were pooled from two independent experiments (N = 4/group) and analyzed by 1-way ANOVA with post hoc test with Bonferroni correction. n. Lineage skewing analysis 12 weeks after allo-BM transplantation following transfer of CD200Hi capillary cells as in Fig. 4f. The ratios of myeloid cell frequencies to lymphoid cell frequencies (T cells and B cells) were analyzed by Student’s t-test. N = 9‒10. The results were pooled from two independent experiments. o. Confocal image demonstrating the preferential homing of DiD-labeled CD200Hi donor capillaries (green; B6) at recipient CD200Hi capillaries (Magenta; B6) in the long BMs, two days after intravenous injection into the tail veins. The scale bar indicates 20 μm. p. Numbers of BM cells, NOHi HSCs, and NOLow HSCs in FoxP3cre CXCR4flox/flox and FoxP3cre CXCR4wt/wt mice. N = 8–9/group. Data pooled from four independent experiments. Data were analyzed by student’s t-test. Wt/Wt: FoxP3cre CXCR4wt/wt mice. Fl/Fl: FoxP3cre CXCR4flox/flox mice. All data are presented as mean ± SD. Asterisks indicate significant differences (p-value <0.05, *; <0.01, **; <0.001, ***; <0.0001, ****; N.S., >0.05). See Supplementary Notes for sample sizes, experimental replicates, and statistical analyses. See the Source Data file for individual p-values.
Extended Data Figure 12:
Summation cartoon: CD200Hi capillaries maintain abundance, the reconstitution elements, and late-rising features of NOHi HSCs via IFT20/CD200/eNOS signaling, providing rigorous immune privilege
Figure 1.
Figure 1.. NO expression distinguishes distinctly potent, late-rising HSCs from less potent, exhausted HSCs
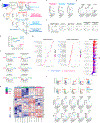
a. Histological image of allo-HSCs that persist in the skull BMs of non-conditioned immunocompetent recipients for 20 days post-transplantation. DiD-labeled allo-HSCs (orangish; Sca1+DiD+) persist at transitional regions from arterioles (narrow; greenish) into Type H vessels (wider; blue) at the endosteal surface. Blue: Alexa 488-IB4. Green: Alexa 568-Sca1. Red: DiD. Scale bar: 20 μm. b. Gating strategy to identify NOHi HSCs. c. CD39, PDL1, CD73, and CD47 levels on NOHi HSCs. Upper: Median fluorescence intensities (MFIs). NOHi HSCs (NOHi): Top 15% levels of DAF-FM signals amongst HSCs. NOLow HSCs (NOLow): Bottom 85% levels. Lower: Representative flow cytometry plots of HSCs. d. CD200R levels on NOHi HSCs. Upper: MFI ratios to the average of NOLow HSCs’ MFIs. Lower: Representative histograms. Red: NOHi HSCs. Blue: NOLow HSCs. e. Levels of eNOS and nNOS in NOHi HSCs. Y axis: Ratio of MFI to the average of NOLow HSCs’ MFIs. f. Ki67+ frequencies. g–k. Competitive transplantation of NOHi, NOLowCD200R+, or NOLowCD200R HSCs (CD45.1). See Extended Data Fig. 2a. g. CD45.1+ blood chimerism at 8 weeks after 1st transplantation (1st 8W), 1st 20W, and 16 weeks after 2nd transplantation (2nd 16W). h. Chimerism ratio at two different time points. Left: 1st 16W chimerism to 1st 3W chimerism. Right: 2nd 16W chimerism to 1st 5W chimerism. i. Kinetics of donor chimerism. The color of the trend lines corresponds to those of the reconstitution patterns in Extended Data Fig. 2d. j. CD45.1+ chimerism within HSCs and MPPs (LinSca1+cKit+) at 1st 20W. k. Representative flow cytometry plots of CD45.1+ HSCs in NOHi HSC recipients at 1st 20W. Mean ± SD is presented. P-value <0.05, *; <0.01, **; <0.001, ***; <0.0001, ****; N.S., >0.05. See Supplementary Notes for sample sizes, experimental replicates, and statistical analyses. See Source Data file for individual p-values.
Figure 2.
Figure 2.. NOHi HSCs localize at ciliated CD200Hi endosteum capillaries, particularly in the metaphysis, while NOLow HSCs are at sinusoids or Type H vessels
a. Confocal imaging of the long bones. Left: Z-projection of image stacks of whole-mount BMs (3 μm steps; z = 180 μm). Magenta: Q655-CD200. Green: Alexa 568-IB4. The red arrows indicate CD200 signals. Right: Image slice of metaphysis BM. C: CD200Hi capillaries (magenta). A: arterioles (reddish). H: Type H vessels (cyan). Magenta: Q655-CD200. Green: Alexa 568-IB4. Cyan: Alexa 488-EMCN. Red: Cy3-Sca1. b. Flow cytometric gating to identify BM vascular populations. c. CD200 staining of BM hematopoietic and mesenchymal populations. Upper: Ratio of CD200 MFI to the MFI average of whole BM cells. Lower: CD200Hi cell frequencies. CD200Hi: CD200Hi capillaries. Type H: Type H vessels. Other arterial: Other arterial fractions. Sinusoids: Sca1CD31+CD45 vessels. d. CD200Hi capillary frequencies in the metaphysis (Meta) vs. diaphysis (Dia). e. Flow cytometric analysis of Arl13b-mCherry Centrin2-GFP double-positive cell frequencies in Arl13b-mCherry Centrin2-GFP mice. f. Tissue scanning electron microscope image of ciliated structures within metaphyseal capillaries. g. Localization of NOHiCD150+CD48Lin (yellowish) and NOLowCD150+CD48Lin (reddish) HSCs. Green: DAF-FM. Red: Alexa 568-CD150. Grey: BV421-Lin/CD48. Magenta: Q655-CD200. Cyan: APC-R700-EMCN. Blue: Alexa 647-IB4. S: Sinusoids (bluish). The white arrows indicate HSCs. h. Proximity of NOHi and NOLow HSCs concerning CD200Hi capillaries, Type H vessels, and sinusoids. Upper: CD150+CD48Lin HSCs in B6 mice. Lower: TdTomato+CD48Lin HSCs in tamoxifen-treated Pdzk1ip1creER × ROSA26TdTomato mice. Metaphysis <500 μm or Metaphysis 500–1500 μm: Region within ~500 μm or 500–1500 μm from the epiphyseal line, respectively. i. NOHi HSC frequencies in metaphyseal vs. diaphyseal HSCs. j. Donor blood chimerism 16 weeks after transplantation of metaphyseal or diaphyseal HSCs. Mean ± SD is presented. P-value <0.05, *; <0.01, **; <0.001, ***; <0.0001, ****; N.S., >0.05. Scale bar: 1 μm (f); 20 μm (a-right, g); 200 μm (a-left). See Supplementary Notes for sample sizes, experimental replicates, and statistical analyses. See Source Data file for individual p-values.
Figure 3:
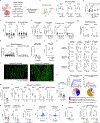
Figure 3:. IFT20 maintains capillary expression of CD200, which upregulates eNOS levels in HSCs via CD200R, controlling NOHi HSC abundance and function
a-e. Assays using tamoxifen-treated VECadcreERT2 × CD200flox/flox (200KO), VECadcreERT2 × IFT20flox/flox (IFTKO), VECadcreERT2 × CD200flox/flox × IFT20flox/flox (DKO), and/or VECadcreERT2 mice (Ct). a. BM cell numbers, and frequencies and numbers of MPPs, HSCs, and NOHi HSCs. b. Ratios of eNOS MFIs in HSCs to the MFI average in tamoxifen-treated VECadcreERT2 mice. c. Reconstitution assays. Donor blood chimerism in SJL recipients 16 weeks post-transplantation of HSCs (upper) or BM cells (lower). d. Ratios of CD200 MFI in Sca1Hi arterial fractions. e. Femurs and metaphyseal BMs from tamoxifen-treated VECadcreERT2 × IFT20flox/flox and VECadcreERT2 mice. Histological image: Z-projection of image stacks of whole-mount BMs (5 μm steps; z = 300 μm). Magenta: Q655-CD200. Green: Alexa 488-IB4. Scale bar: 200 μm. f. CD45.1+ blood chimerism 16 weeks (wks.) post-transplantation of NOHi HSCs (CD45.1) transduced with CD200R1-antisense (CD200R1KD) or non-targeting scramble control (Ct). g. Donor blood chimerism in SJL recipients 16 weeks post-transplantation of NOHi or NOLow HSCs from Pdzk1ip1creER × eNOSflox/flox (eNOSKO) vs. Pdzk1ip1creER (Ct) mice. Tamoxifen treatment in donor NOHi HSCs was performed ex vivo before transplant and in recipients following transplantation. h. NOHi HSC numbers (right) and NOHi HSC frequencies in HSCs (left) four days after tamoxifen treatment in Pdzk1ip1creER × eNOSflox/flox mice. i. TdTomato+ frequencies in peripheral blood cells in tamoxifen-treated Pdzk1ip1creER × eNOSflox/flox × ROSA26TdTomato mice. Mean ± SD is presented. P-value <0.05, *; <0.01, **; <0.001, ***; <0.0001, ****; N.S., >0.05. See Supplementary Notes for sample sizes, experimental replicates, and statistical analyses. See Source Data file for individual p-values.
Figure 4:
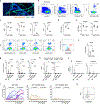
Figure 4:. Endothelial CD200 is immunoprotective for NOHi HSCs
a. Blood chimerism derived from NOHi and NOLow donor HSCs (B6 SJL) transplanted into conditioned B10.A (allo) and B6 (syn) recipients. b. Frequencies of PDL1Hi and CD39Hi cells within different BM mesenchymal fractions. c. Frequencies of PDL1Hi niche Tregs within niche Tregs (left) and whole BM (right) in metaphysis vs. diaphysis. d. Numbers of allo- and syn-donor NOHi HSCs that persisted in the comparable BM regions of tamoxifen-treated VECadcreERT2 × CD200flox/flox mice. DiD-labeled NOHi and NOLow CD150+CD48Lin HSCs from B10.A (allo; left) or B6 mice (syn; right) were intravenously injected into non-irradiated tamoxifen-treated VECadcreERT2 × CD200flox/flox mice (B6). e. Number (left) and frequencies (right) of activated niche Tregs in the BMs in tamoxifen-treated VECadcreERT2 × CD200flox/flox mice, VECadcreERT2 × IFT20flox/flox mice, and VECadcreERT2 × CD200flox/flox × IFT20flox/flox mice. f. Donor blood chimerism of BALB/c (allo) or B6 SJL (syn) BM in conditioned B6 recipients transferred with B6 CD200Hi capillary cells (Day −2). All data are presented as mean ± SD. P-value <0.05, *; <0.01, **; <0.001, ***; <0.0001, ****; N.S., >0.05. See Supplementary Notes for sample sizes, experimental replicates, and statistical analyses. See Source Data file for individual p-values.

References

    1. Jones DL & Wagers AJ No place like home: anatomy and function of the stem cell niche. Nat Rev Mol Cell Biol 9, 11–21, doi:10.1038/nrm2319 (2008). - DOI - PubMed
    1. Comazzetto S, Shen B & Morrison SJ Niches that regulate stem cells and hematopoiesis in adult bone marrow. Dev Cell 56, 1848–1860, doi:10.1016/j.devcel.2021.05.018 (2021). - DOI - PMC - PubMed
    1. Morrison SJ & Scadden DT The bone marrow niche for haematopoietic stem cells. Nature 505, 327–334, doi:10.1038/nature12984 (2014). - DOI - PMC - PubMed
    1. Kiel MJ et al. SLAM family receptors distinguish hematopoietic stem and progenitor cells and reveal endothelial niches for stem cells. Cell 121, 1109–1121, doi:10.1016/j.cell.2005.05.026 (2005). - DOI - PubMed
    1. Ding L, Saunders TL, Enikolopov G & Morrison SJ Endothelial and perivascular cells maintain haematopoietic stem cells. Nature 481, 457–462, doi:10.1038/nature10783 (2012). - DOI - PMC - PubMed

MeSH terms