. 2025 Feb;638(8049):172-181.
doi: 10.1038/s41586-024-08341-9. Epub 2025 Jan 1.

Dysregulation of mTOR signalling is a converging mechanism in lissencephaly

Affiliations

Dysregulation of mTOR signalling is a converging mechanism in lissencephaly

Ce Zhang et al. Nature. 2025 Feb.

Abstract

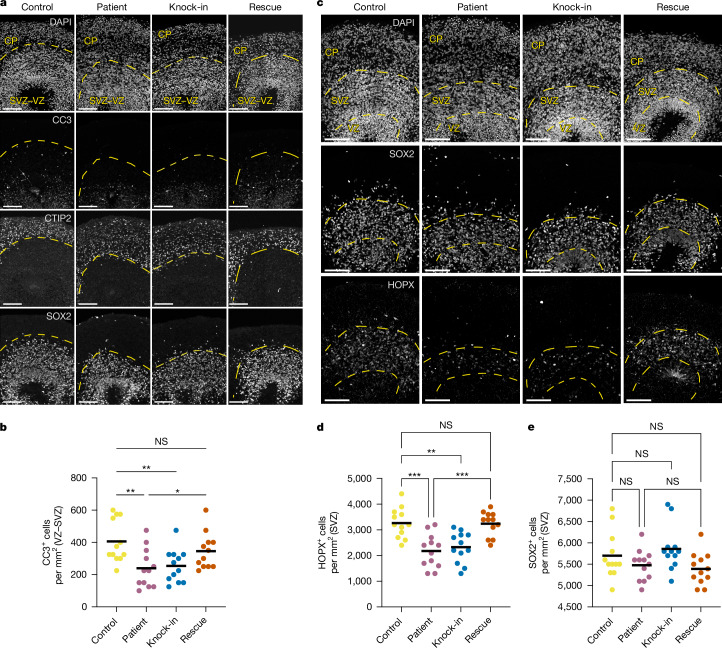
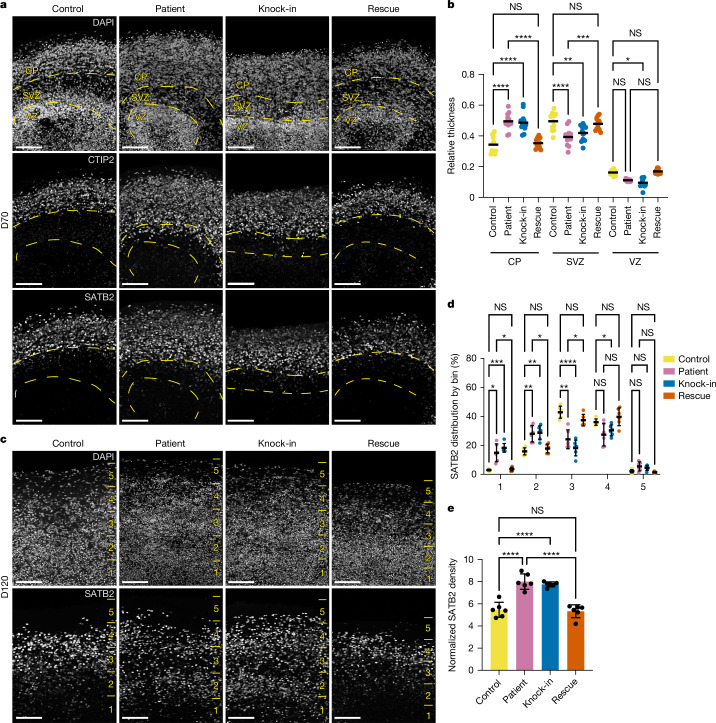
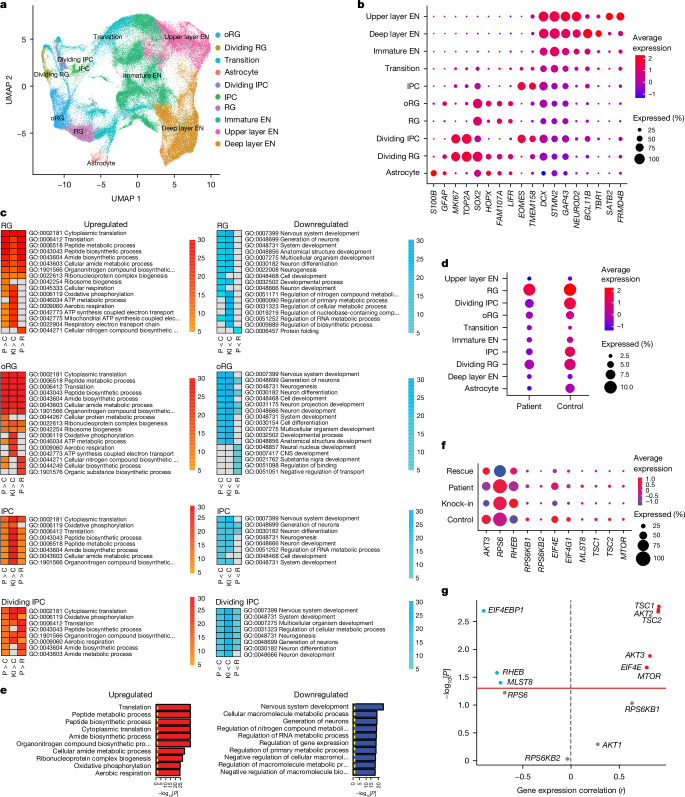
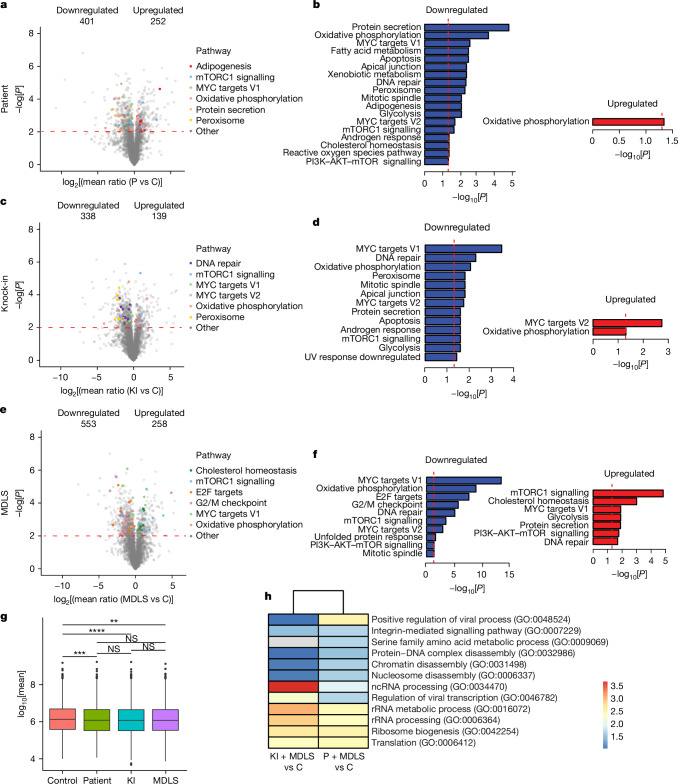
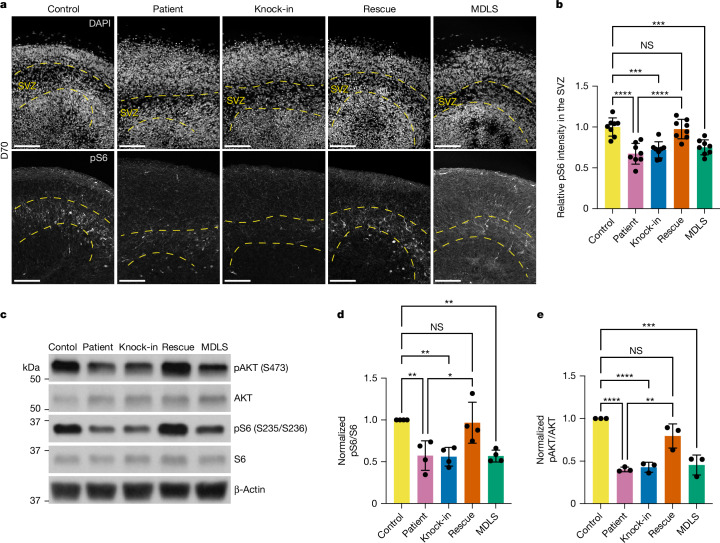
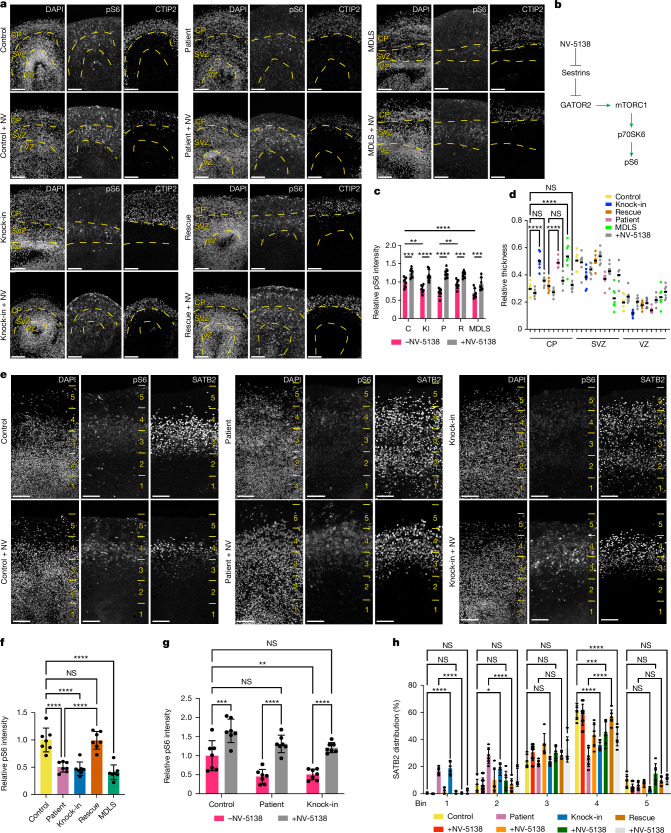
Cerebral cortex development in humans is a highly complex and orchestrated process that is under tight genetic regulation. Rare mutations that alter gene expression or function can disrupt the structure of the cerebral cortex, resulting in a range of neurological conditions1. Lissencephaly ('smooth brain') spectrum disorders comprise a group of rare, genetically heterogeneous congenital brain malformations commonly associated with epilepsy and intellectual disability2. However, the molecular mechanisms underlying disease pathogenesis remain unknown. Here we establish hypoactivity of the mTOR pathway as a clinically relevant molecular mechanism in lissencephaly spectrum disorders. We characterized two types of cerebral organoid derived from individuals with genetically distinct lissencephalies with a recessive mutation in p53-induced death domain protein 1 (PIDD1) or a heterozygous chromosome 17p13.3 microdeletion leading to Miller-Dieker lissencephaly syndrome (MDLS). PIDD1-mutant organoids and MDLS organoids recapitulated the thickened cortex typical of human lissencephaly and demonstrated dysregulation of protein translation, metabolism and the mTOR pathway. A brain-selective activator of mTOR complex 1 prevented and reversed cellular and molecular defects in the lissencephaly organoids. Our findings show that a converging molecular mechanism contributes to two genetically distinct lissencephaly spectrum disorders.


Conflict of interest statement

Competing interests: N.S. is a co-founder and shareholder of Bexorg, Inc. All the other authors declare no competing interests.

Figures

Fig. 1
Fig. 1. Neural progenitor dysregulation in PIDD1-mutant organoids.
a, Control, patient, knock-in and rescue organoids at D70 immunostained for CC3, CTIP2 and SOX2. Yellow dashed lines delineate the CP, the SVZ and the VZ. b, Quantification of CC3+ cells per mm2 of the SVZ–VZ area. c, Control, patient, knock-in and rescue organoids at D70 immunostained for SOX2 (neural progenitor cells) and HOPX (oRG cells). d,e, Quantification of HOPX+ (d) and SOX2+ (e) cells per mm2 of the SVZ area. All analyses were performed using images from n = 12 cortical regions, n = 6 organoids, 2 batches of 3 organoids per genotype. Statistical test: one-way analysis of variance (ANOVA). ***P < 0.001, **P < 0.01, *P < 0.05. NS, not significant. Scale bars, 100 µm.
Fig. 2
Fig. 2. CP defects in PIDD1-mutant organoids.
a, Control, patient, knock-in and rescue organoids at D70 immunostained for CTIP2 and SATB2 (deep and upper, respectively, cortical layer neurons). Yellow dashed lines delineate the CP, the SVZ and the VZ. b, Quantification of the relative thickness of the VZ, the SVZ and the CP from a. c, Control, patient, knock-in and rescue organoids at D120 immunostained for SATB2. d, Quantification of the distribution of SATB2-expressing cells across five equal bins shown in c. e, Quantification of the normalized density of SATB2-expressing cells from the organoid surface to the bottom of the images in c. n = 12 cortical regions, n = 6 organoids, 2 batches of 3 organoids per genotype (b); n = 6 cortical regions, n = 6 organoids, 2 batches of 3 organoids per genotype (d,e). Statistical tests: one-way ANOVA (b,e) or two-way ANOVA (d). ****P < 0.0001, ***P < 0.001, **P < 0.01, *P < 0.05. Data are mean ± s.d. (d,e). Scale bars, 100 µm.
Fig. 3
Fig. 3. scRNA-seq reveals transcriptional dysregulation in PIDD1-mutant organoids.
a, UMAP projection of all cells from scRNA-seq of control, patient, knock-in and rescue organoids at D70. EN, excitatory neuron; transition, transitional cell between the progenitor and neuronal state. b, Dot plot of the expression of selected established marker genes used for cell-type classification of the entire dataset. c, Heat maps representing –log10(adjusted P value) of enriched GO terms in RG, oRG, IPC and dividing IPC clusters across three conditions: patient versus control (P > C), knock-in versus control (KI > C), and patient versus rescue (P > R). Left and right heat maps display upregulated and downregulated GO terms, respectively. The top 17 significant GO terms for RG and oRG are plotted for each comparison. Selected GO terms from RG and oRG lists were plotted for IPC and dividing IPC clusters. Grey boxes indicate GO terms that were not significantly upregulated or downregulated for the comparison. d, Dot plot of PIDD1 expression in different cell clusters. e, Bar graphs of upregulated (left) and downregulated (right) GO pathways for PIDD1-expressing cells in patient organoids (n = 4) compared with control organoids (n = 4). f, Dot plot of the expression of mTOR pathway genes in control, patient, knock-in and rescue whole organoids (pseudobulk analysis). g, Gene expression correlation (r) of PIDD1 and mTOR pathway genes across all organoid genotypes (all clusters). Statistical tests: two-tailed Fisher’s exact test (e) or Pearson’s correlation test (g) with a P value threshold of <0.05. Number of organoids analysed by scRNA-seq: control, n = 4; patient, n = 4; knock-in, n = 2, rescue, n = 2.
Fig. 4
Fig. 4. MS analyses reveal dysregulated protein pathways in PIDD1-mutant and MDLS organoids.
a,b, Volcano plot of DEPs and selected pathways (a) and pathway enrichment (PE) analysis (b) for patient organoids versus control organoids at D70; bar graphs of downregulated (left) and upregulated (right) pathways in patient organoids. c,d, Volcano plot of DEPs and selected pathways (c) and PE analysis (d) for knock-in organoids versus control organoids at D70; bar graphs of downregulated (left) and upregulated (right) pathways in knock-in organoids. e,f, Volcano plot of DEPs and selected pathways (e) and PE analysis (f) for MDLS organoids versus control organoids at D70; bar graphs of downregulated (left) and upregulated (right) pathways in MDLS organoids. g, Mean protein translation in MS datasets. Box and whisker plots represent 25th to 75th percentiles of the data, with the centre line representing the median and whiskers representing minima and maxima. Two-tailed paired t-test. ****P < 0.0001, ***P < 0.001, **P < 0.01. h, Heat maps of selected enriched GO terms in knock-in organoids and MDLS organoids versus control organoids (left) and patient organoids and MDLS organoids versus control organoids (right). Colour bar represents –log(adjusted P value). In a,c,e, a two-tailed ANOVA was used. In b,d,f, the MSigDB 2020 Hallmark gene set from GSEA was used in pathway analysis and a two-tailed Fisher’s exact test was used. Pathways appearing as both upregulated and downregulated in the bioinformatic analysis indicate that different pathway genes are upregulated or downregulated. Number of organoid replicates for all analyses for MS: control, n = 3; patient, n = 3; knock-in, n = 3; MDLS, n = 3; each replicate was a mixture of 3 organoids. P value threshold: P = 0.01 (a,c,e) or P = 0.05 (b,d,f–h).
Fig. 5
Fig. 5. Hypoactive mTOR signalling in PIDD1-mutant organoids and MDLS organoids.
a, Control, patient, knock-in, rescue and MDLS organoids at D70 immunostained for pS6. Yellow dashed lines delineate the SVZ. b, Quantification of pS6 relative intensity in the SVZ area. c, Representative western blot of organoid lysates for mTOR pathway components. For gel source data, see Supplementary Fig. 1a. d,e, Quantification of band intensity for pS6/S6 (d) and pAKT(S473)/AKT (e) ratios normalized to control. For western blots, n = 4 independent batches for pS6/S6, n = 3 independent batches for pAKT/AKT, 3 organoids collected per batch per genotype. Analyses of immunostaining experiments were performed with images from n = 8 cortical regions, n = 4 organoids, 2 batches of 2 organoids per genotype. Statistical test: one-way ANOVA. ****P < 0.0001, ***P < 0.001, **P < 0.01, *P < 0.05. Data are the mean ± s.d. (be). Scale bars, 100 µm.
Fig. 6
Fig. 6. An mTORC1 activator rescues mTOR pathway hypoactivity and thickened CP in PIDD1-mutant organoids and MDLS organoids.
a, Control, patient, MDLS, knock-in and rescue organoids at D70 grown with or without NV-5138 (NV) starting at D30 immunostained for pS6 and CTIP2. Yellow dashed lines delineate the CP, the SVZ and the VZ. b, Diagram illustrating the action of NV-5138 on the mTORC1 pathway. c, Quantification of the relative pS6 signal intensity in the SVZ area of D70 organoids. d, Quantification of the relative thickness of the CP, the SVZ and the VZ in D70 organoids. e, Control, patient and knock-in organoids at D120 grown with or without NV-5138 starting at D50 immunostained for pS6 and SATB2. f, Quantification of the relative pS6 signal intensity in the CP area of D70 organoids. g, Quantification of the relative pS6 signal intensity in the CP area of D120 organoids. h, Quantification of the distribution of SATB2-expressing cells across 5 equal bins of the CP area in D120 organoids shown in e. n = 7 cortical regions, n = 6 organoids, 2 batches per genotype (c,d,f,g); n = 6 cortical regions, n = 6 organoids, 2 batches per genotype (h). Statistical tests: one-way ANOVA (c,d,f,) or two-way ANOVA (g,h). ****P < 0.0001, ***P < 0.001, **P < 0.01, *P < 0.05. Data are the mean ± s.d. (c,fh). Scale bars, 100 µm.
Extended Data Fig. 1
Extended Data Fig. 1. Homozygous mutations in PIDD1 are associated with lissencephaly spectrum disorders.
a, Simplified pedigrees for the NG375, the NG8, and the NG1801 families with the indicated mutations in PIDD1. b, Magnetic resonance images (MRI) of the index case and iPS cell donor NG375-1 (arrow); axial (T2-weighted), sagittal and coronal (T1-weighted) images demonstrating bilateral diffuse pachygyria; the upper and middle gyri in the temporal lobes are diffusely and symmetrically thickened and smooth; no microgyria was observed; the ventricles are large. c,d, Axial images of index cases (arrows) from the NG8 (c, T1-weighted) and NG1801 families (d, T2-weighted) demonstrating diffuse pachygyria. e, Domain structure of the PIDD1 full-length (FL) protein indicating serine autoproteolysis sites (arrowheads) and resulting fragments PIDD1-N, PIDD1-C, and PIDD1-CC. The locations of the stop-gain (R331X, W589X) and canonical splice-site (c.2042-2A>G) mutations (vertical lines) are indicated on PIDD1-FL. f, PIDD1-FL derived C-terminal fragments PIDD1-C and PIDD1-CC containing the death domain participate in complexes with either RIP1-NEMO (“NEMO-PIDDosome”) or CRADD-Caspase-2 (CASP2) (“CASP2-PIDDosome”) to regulate cell survival or apoptosis, respectively. g, Protein structure of PIDD1 (UniProt ID: Q9HB75) generated by AlphaFold with indicated N- and C-termini (yellow), death domain (light blue), and stop-gain mutation sites (black). h, Quantification of relative expression levels of PIDD1 mRNA from RT-qPCR of organoids at D70 treated with 50 μM cycloheximide (CHX) for 2 h and untreated counterparts. n = 3 organoids, 3 independent experiments per genotype. Statistical test: Two-tailed unpaired t test: **, P < 0.01*, P < 0.05, ns, not significant. LRR: leucine-rich repeats; ZU5: domain present in ZO-1 and Unc5-like netrin receptors; DD: death domain.
Extended Data Fig. 2
Extended Data Fig. 2. Magnetic Resonance Imaging (MRI) of affected individuals with mutations in PIDD1.
a, NG375 family. Axial T2-weighted and coronal T1- and T2-weighted MR images of two siblings with the stop-gain R331X mutation, showing cortical thickening, simplification of gyri, and fronto-temporal atrophy. b, NG8 family. Axial T1- and T2-weighted and coronal T2-weighted MR images of three siblings with the stop-gain W589X mutation. Axial T1-weighted and T2-weighted MR images with bilateral and diffuse thickening of the cortex and simplification of gyri with an anterior > posterior gradient. Coronal T2-weighted MR images with diffuse pachygyria. Enlargement of the subarachnoid spaces consistent with arachnoid cysts are also noted. c, NG1801 family. Axial T1- and T2-weighted and coronal T2-weighted MR images of one individual with the c.2042-2A>G splice-site mutation, showing frontal pachygyria and simplification of gyri.
Extended Data Fig. 3
Extended Data Fig. 3. Study design and generation and characterization of iPS cells and cerebral organoids.
a, Schematic of the workflow. b, Sample images of cell types of three germ layers in teratomas from control iPS cells following transplantation to SCID mice, n = 1 experiment. c, Immunostaining of patient iPS cells for pluripotency markers OCT4 and NANOG, n = 1 iPS cell colony. d, Karyotypes for control, patient, knock-in, and rescue iPS cells. e, Sanger sequencing chromatograms for control, patient, knock-in, and rescue iPS cells. Red boxes indicate wild-type or mutated sites. f, Immunostaining for dorsal neural progenitor markers PAX6 and OTX2 in an organoid at D21, n = 1 organoid. g,h, Immunostaining for dorsal forebrain markers FOXG1 (g) and CTIP2 and PAX6 (h) in an organoid at D50, n = 1 organoid. i, Western blot of organoid lysates at D70, with antibodies against a C-terminal PIDD1 epitope and beta-actin (loading control); PIDD1-CC (~37 kDa), n = 2 experiments (mixture of 3 organoids) per genotype. Asterisks indicate non-specific bands. For gel source data, refer to Supplemental Fig. 1b. j, Karyotype for MDLS iPS cells. k, Chromosome 17 array comparative genomic (aCG) hybridization output profile for the MDLS iPS cells. CP: cortical plate, SVZ: subventricular zone, VZ: ventricular zone. Scale bars, 100 µm. The schematic in a was created using BioRender (credit: C.Z., https://biorender.com/w12b840; 2023). Scale bars, 100 µm.
Extended Data Fig. 4
Extended Data Fig. 4. Neural progenitor cell abnormalities in PIDD1-mutant organoids.
a, Control, patient, knock-in, and rescue organoids at D50 immunostained for apoptotic cell marker cleaved-caspase 3 (CC3). Dashed yellow lines delineate the SVZ/VZ. b, Quantification of CC3+ cells per mm2 SVZ/VZ area. c, Control, patient, knock-in, and rescue organoids at D50 immunostained for oRG cell marker HOPX. Dashed yellow lines delineate the SVZ/VZ. d, Quantification of HOPX+ cells per mm2 SVZ/VZ area. e, Control, patient, knock-in, and rescue organoids at D70 immunostained for IPC marker TBR2. Dashed yellow lines delineate the SVZ. f, Quantification of TBR2+ cells per mm2 SVZ area. g, Control, patient, knock-in, and rescue organoids at D70 immunostained for oRG marker HOPX, TBR2, and CC3. h, i, Quantification of the faction of CC3+ cells co-expressing either TBR2 (h) or HOPX (i). n = 12 cortical regions, n = 6 organoids, 2 batches of 3 organoids per genotype (b, d, f); n = 6 cortical regions, n = 6 organoids, 2 batches per genotype (h, I). Statistical test: one-way ANOVA; ****, P < 0.0001; **, P < 0.01; *, P < 0.05; ns, not significant. Scale bars, 100 µm (a, c, e) and 50 µm (g).
Extended Data Fig. 5
Extended Data Fig. 5. Increased neurogenesis in PIDD1-mutant organoids.
a, Control, patient, knock-in, rescue organoids at D50 immunostained for EdU and MKI67 (also known as Ki67). Dashed yellow lines delineate the CP and SVZ/VZ. b, Quantification of EdU+ cells in SVZ/VZ. c, Immunostaining for phospho-histone H3 (PH3) in the VZ. d, Quantification of PH3+ cells at the ventricular surface. e, Diagram illustrating cleavage angle measurement (top); representative examples of vertical, oblique, and horizontal divisions in PH3+ cells (bottom). Nuclei are stained with DAPI. f, Quantification of the cleavage angle (relative to apical surface) in PH3+ cells. g, Immunostaining for differentiating neuron marker MAP2 and SOX2 in cortical region of patient and rescue organoids at D70. h, Quantification of MAP2+ and SOX2+ cells in a cortical region of control, patient, knock-in, and rescue organoids at D70. n = 12 cortical regions, n = 6 organoids, 2 batches of 3 organoids per genotype (b, d); dividing apical progenitor cells from n = 12 organoids were counted per genotype (f); n = 6 cortical regions, n = 6 organoids, 2 batches per genotype (h). For (g), n = 6 cortical regions, n = 3 organoids per genotype. Statistical test: one-way ANOVA per genotype; ****, P < 0.0001; ***, P < 0.001; ns, not significant. Scale bars, 100 µm.
Extended Data Fig. 6
Extended Data Fig. 6. Cortical plate defects in PIDD1-mutant organoids.
a, Control, patient, knock-in, and rescue organoids at D50 immunostained for deep-layer neuron marker CTIP2. Dashed yellow lines delineate the CP, SVZ, and VZ. b, Quantification of relative thickness of VZ, SVZ, and CP. c, Control, patient, knock-in, and rescue organoids at D50 immunostained for upper-layer neuron marker SATB2. d-e, Patient and rescue organoids at D50 (d) and at D70 (e) immunostained for CTIP2 and SATB2. f, Quantification of SATB2+/CTIP+, SATB2+/CTIP2 and SATB2/CTIP2+ cells in CP. g, Golgi-Cox staining of neurons in the upper CP of control, patient, and knock-in organoids at D120. Pial surface is to the top. All experiments were performed with images from n = 12 cortical regions, n = 6 organoids, 2 batches of 3 organoids per genotype. Statistical test: one-way ANOVA; ****, P < 0.0001; ***, P < 0.001; **, P < 0.01; ns, not significant. Scale bars, 100 µm (a, c, d) and 50 µm (e, g).
Extended Data Fig. 7
Extended Data Fig. 7. Analyses of PIDD1 mRNA expression.
a, PIDD1 exon array signal intensity in human fetal, postnatal, and adult brain (hbatlas.org). b,c, Representative images of sections of control, patient, knock-in, and rescue organoids at D70,  (n= 4 organoids per genotype) (b) and sections of human fetal cortex at gestational week (GW) 17 (c) following in situ hybridization with a probe detecting the 3′ end of the PIDD1 transcript. Inset (c) shows a high-magnification view of the area delineated by a black rectangle. d, GO enrichment analysis for biological processes of PIDD1-expressing vs non-expressing cells in control organoids at D70. Bar graphs of downregulated (left) and upregulated (right) GO pathways for PIDD1-expressing compared with non-expressing cells in control organoids (pseudobulk analysis). e, Disease enrichment analysis of PIDD1-expressing cells in control vs patient organoids using the OMIM expanded dataset. Bar graphs of downregulated (left) and upregulated (right) GO pathways. GO analysis was performed using all PIDD1-expressing and non-expressing cells in patient (n = 4) vs control (n = 4) organoids. Two-tailed Fisher’s exact test and P < 0.05 was used as the threshold for analyses in (d, e). Scale bars, 2 mm (b, c), 50 μm (c, inset). NCX: neocortex; HIP: hippocampus; AMY: amygdala; STR: striatum; MD: mediodorsal nucleus of the thalamus; CBC: cerebellar cortex.
Extended Data Fig. 8
Extended Data Fig. 8. Comparison of transcriptomic and proteomic datasets of PIDD1-mutant organoids.
a-b, Volcano plot of DEPs and selected pathways (a) and PE analysis (b) for patient vs control organoids at D70 analyzed by MS; bar graphs of downregulated (left) and upregulated (right) pathways in patient organoids. c, Heatmap of downregulated GO terms shared between patient and control scRNA-seq (RG cluster) and MS datasets. Colour bar represents -log(adjusted P value). Grey boxes indicate GO terms that were not significantly downregulated for the comparison. d-f, Venn diagrams and pathway analysis of shared downregulated DEGs/DEPs in scRNA-seq (oRG cell-type) and MS datasets from patient vs control (d), knock-in vs control (e), and patient vs control (repeat analyses) (f). The MSigDB2020 Hallmark gene set from GSEA was used in all pathway analyses. In (a) a P value of 0.1 was used as threshold for determining DEPs. PE analysis was conducted with a P value threshold of 0.05 using two-tailed Fisher’s exact test. Control, n = 3; patient, n = 3 batches, 3 organoids per batch, were analyzed per MS experiment. The patient vs control dataset in this figure and the knock-in vs control dataset in Fig. 4 are from two independent MS experiments.
Extended Data Fig. 9
Extended Data Fig. 9. Hypoactive mTOR signalling in SVZ progenitors of PIDD1-mutant organoids.
a-b Control organoids at D70 immunostained for pS6 and oRG marker HOPX or IPC marker TBR2. Nuclei are stained with DAPI. Dashed white box indicates the magnified area shown to the right; dashed white lines delineate the SVZ/VZ. c, Quantification of HOPX+/pS6+ or TBR2+/pS6+ cells in the SVZ. d, Control, patient, knock-in, and rescue organoids at D70 immunostained for SOX2, CTIP2, and pS6. e, Quantification of pS6+/SOX2+ cells per mm2 SVZ area. f, Quantification of pS6 relative intensity in the SVZ area. n = 13 cortical regions, n = 6 organoids, 2 batches of 3 organoids per genotype (c); n = 8 cortical regions, n = 4 organoids, 2 batches of 2 organoids per genotype (e, f). Statistical tests: two-tailed unpaired t-test; ****, P < 0.0001 (c); one-way ANOVA; ****, P < 0.0001; **, P < 0.01; ns, not significant (e, f). Data are mean±s.d. (c, e, f). Scale bars, 100 µm.
Extended Data Fig. 10
Extended Data Fig. 10. An mTORC1 activator rescues cellular defects and upregulates mTOR signalling, translation, and metabolism in PIDD1-mutant organoids.
a, Control, patient, and knock-in organoids at D70 grown with or without NV-5138 (NV) immunostained for CP markers CTIP2, TBR1, and SATB2. Dashed yellow lines delineate the CP, SVZ, and VZ. b, Control, patient, and MDLS organoids at D70 grown with or without NV-5138 (NV) immunostained for oRG cell marker HOPX and pS6. c, Quantification of HOPX-expressing cells in the SVZ. d, Quantification of pS6 relative intensity in HOPX-expressing cells in the SVZ. e, UMAP projection of all cells from scRNA-seq of control, patient, and MDLS organoids at D70. EN, excitatory neuron. f, Dot plot expression of selected established marker genes used for cell-type classification of entire dataset. g, Normalized average pseudo-bulk gene expression in RG cells (upper) and oRG cells (bottom) for gene sets related to selected GO terms in different conditions. Colour bar represents -log10 (adjusted P value). h, Paired comparison for normalized average pseudo-bulk gene expression in RG cells (upper) and oRG cells (bottom) for gene sets related to selected neuron-related GO terms in different conditions. Colour bar represents scaled gene expression. i, Paired comparison for normalized average pseudo-bulk gene expression in RG cells (upper) and oRG cells (bottom) for gene sets related to selected translation and metabolism-related GO terms in different conditions. Colour bars represent scaled gene expression. n = 6 cortical regions, n = 6 organoids, two batches per genotype (c); n = 50 cells, n = 4 organoids, two batches of two organoids per genotype (d). Statistical tests: two-tailed unpaired t-test (c); ***, P < 0.001; **, P < 0.01; ns, not significant; one-way ANOVA (d); ****, P < 0.0001; ***, P < 0.001; **, P < 0.01; *, P < 0.05. Organoids analyzed by sc-RNAseq: control, n = 2; control + NV, n = 2; patient, n = 2, patient + NV, n = 2, MDLS, n = 2, MDLS + NV, n = 2. Data are mean±s.d. (c). Scale bars, 100 µm (a) and 50 µm (b).

References

    1. Oegema, R. et al. International consensus recommendations on the diagnostic work-up for malformations of cortical development. Nat. Rev. Neurol.16, 618–635 (2020). - PMC - PubMed
    1. Di Donato, N. et al. Lissencephaly: expanded imaging and clinical classification. Am. J. Med. Genet. A173, 1473–1488 (2017). - PMC - PubMed
    1. Juric-Sekhar, G. & Hevner, R. F. Malformations of cerebral cortex development: molecules and mechanisms. Annu. Rev. Pathol.14, 293–318 (2019). - PMC - PubMed
    1. Severino, M. et al. Definitions and classification of malformations of cortical development: practical guidelines. Brain143, 2874–2894 (2020). - PMC - PubMed
    1. Barkovich, A. J., Dobyns, W. B. & Guerrini, R. Malformations of cortical development and epilepsy. Cold Spring Harb. Perspect. Med.5, a022392 (2015). - PMC - PubMed

MeSH terms

Substances