. 2025 Jan;35(1):45-58.
doi: 10.1038/s41422-024-01057-5. Epub 2025 Jan 2.

Reducing functionally defective old HSCs alleviates aging-related phenotypes in old recipient mice

Affiliations

Reducing functionally defective old HSCs alleviates aging-related phenotypes in old recipient mice

Yuting Wang et al. Cell Res. 2025 Jan.

Abstract

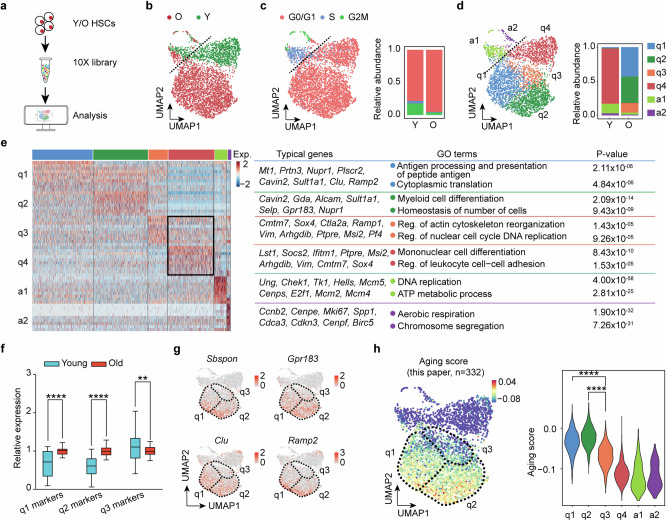
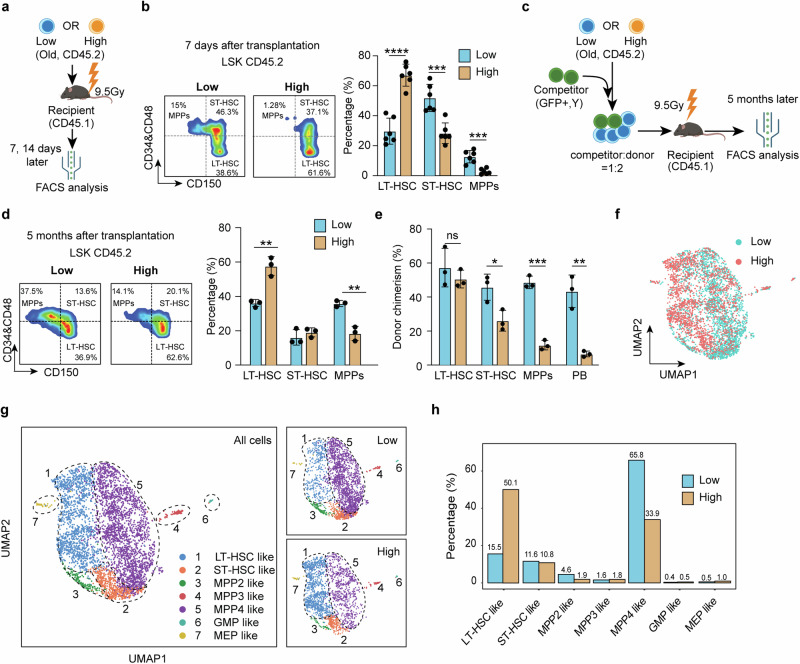
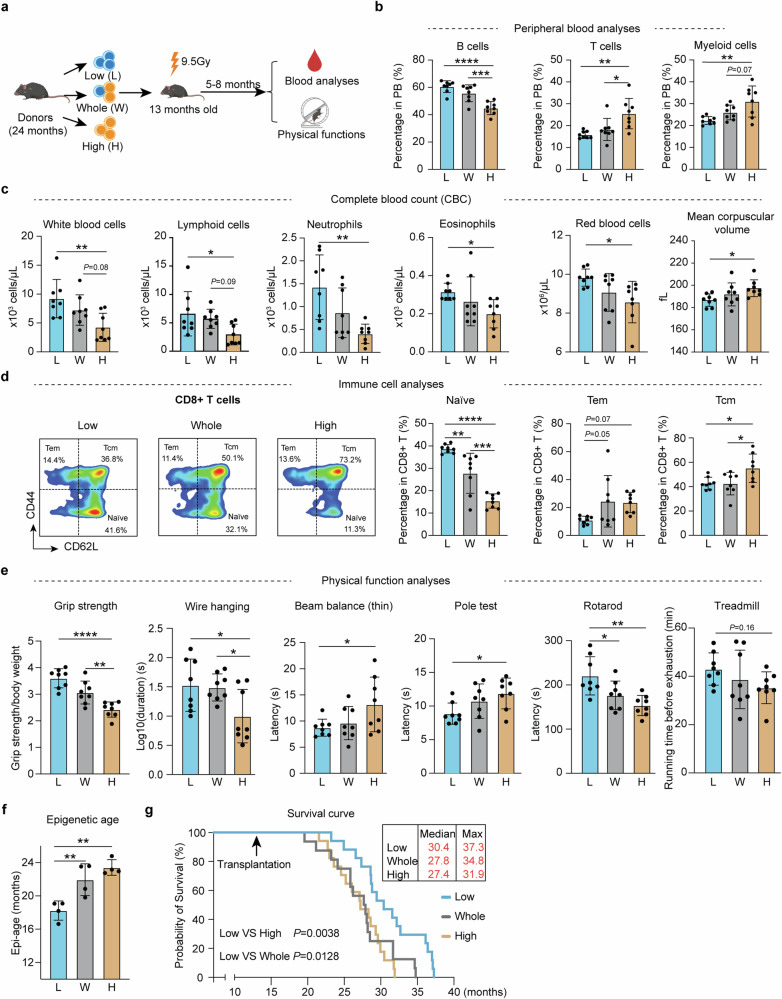
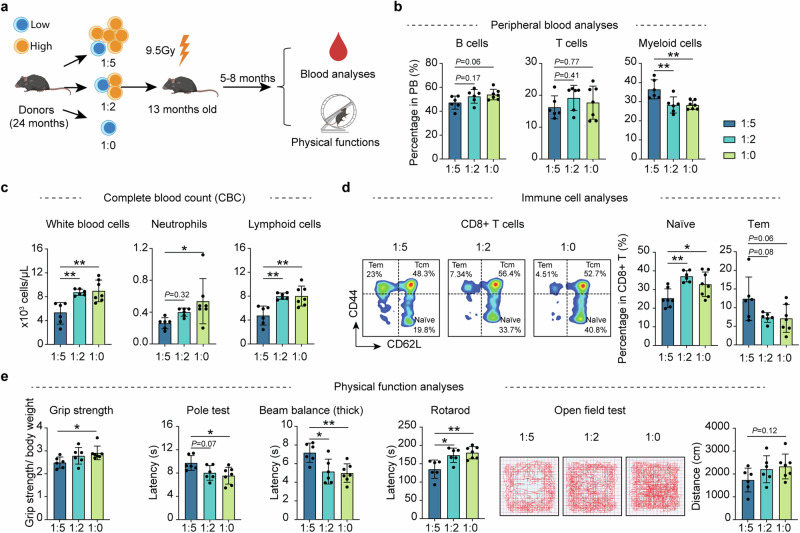
Aging is a process accompanied by functional decline in tissues and organs with great social and medical consequences. Developing effective anti-aging strategies is of great significance. In this study, we demonstrated that transplantation of young hematopoietic stem cells (HSCs) into old mice can mitigate aging phenotypes, underscoring the crucial role of HSCs in the aging process. Through comprehensive molecular and functional analyses, we identified a subset of HSCs in aged mice that exhibit "younger" molecular profiles and functions, marked by low levels of CD150 expression. Mechanistically, CD150low HSCs from old mice but not their CD150high counterparts can effectively differentiate into downstream lineage cells. Notably, transplantation of old CD150low HSCs attenuates aging phenotypes and prolongs lifespan of elderly mice compared to those transplanted with unselected or CD150high HSCs. Importantly, reducing the dysfunctional CD150high HSCs can alleviate aging phenotypes in old recipient mice. Thus, our study demonstrates the presence of "younger" HSCs in old mice, and that aging-associated functional decline can be mitigated by reducing dysfunctional HSCs.


Conflict of interest statement

Competing interests: The authors declare the following competing financial interests: Y.Z. and Y.W. are the inventors of a patent related to the work presented in this manuscript. The patent number is 63472759 and the title is: “Compositions and Methods for Assessing, Treating, or Reducing Aging-Related Functional Decline”, which was filed on June 13, 2023.

Figures

Fig. 1
Fig. 1. Transplantation of young HSCs alleviates aging phenotypes in old recipient mice.
a Diagram illustration of the competitive young (2–3 months) and old (22–24 months) HSC transplantation experiment. For the first transplantation, the ratio of young to old HSCs was 1:2 (500 young and 1000 old) while the ratio was 1:1 (1000 young and 1000 old) for the second transplantation. b Peripheral blood (PB) chimerism of donor HSCs at different time points after the 1st and 2nd transplantation, n = 6 for the first and n = 3 for the second transplantation. c Diagram showing the experimental design of individual transplantation of 1000 young (3 months) or 1000 old (22–24 months) HSCs into middle-aged recipients (13-month-old). Five months after the transplantation, a series of hematopoietic and physical tests were performed. d Bar graph showing the percentage of B, T and myeloid cells in the PB of recipient mice, n = 8. e Bar graph showing the absolute number of blood cells in the PB of recipient mice, n = 8. f FACS plot and bar plot showing the percentage of naïve T cells in CD8+ T cells from recipient mice, Naïve T cells (CD44low, CD62Lhigh), Tcm (CD44high, CD62Lhigh) and Tem (CD44high, CD62Llow), n = 8. g Bar plot showing the epigenetic age of blood from recipient mice, n = 4. h Physical tests of recipient mice that received young or old HSCs. Muscle strength, motor coordination, endurance and brain function were assessed, n = 8. Mean ± SD, Student’s t-test, *P < 0.05, **P < 0.01, ****P < 0.0001. The graphics of the mouse and equipment in a, c and h were created with BioRender.
Fig. 2
Fig. 2. scRNA-seq reveals increased heterogeneity of old HSCs.
a Workflow of 10X scRNA-seq of young and old HSCs. The HSCs were sorted from young (2–3 months) and old (23 months) mice. b UMAP plot showing the distribution of young and old HSCs based on scRNA-seq. Clear separation of young and old HSCs indicates transcriptional changes of HSCs during aging. c Cell cycle phase analysis of young and old HSCs based on scRNA-seq. The S-phase and G2/M-phase marker genes are from Seurat package (V4.0.2). The cell cycle phase is determined by the relative expression levels of these marker genes. If neither S-phase nor G2/M phase genes are expressed, they are classified as G0/G1 phase. d UMAP plot showing unsupervised clustering of young and old HSCs. In total, 6 clusters were identified with two clusters (a1 and a2) representing active, and four clusters (q1–q4) representing quiescent cells. e Heatmap showing the cluster-specific marker genes expression across the 6 clusters and their enriched GO terms. Differentially expressed genes with min.pct = 0.25, logfc.threshold = 0.25 among the 6 clusters were used to generate the heatmap. Well-known HSC aging-related genes in clusters q1 and q2 are highlighted. Commonly identified marker genes in clusters q3 and q4 were also highlighted. Exp., expression; Reg., regulation. f Box plot showing relative expression of marker genes of q1, q2 and q3 in young and old HSCs via analysis of bulk RNA-seq. The expression level was normalized to the average expression level of the old. Plot shows the mean and 5–95 percentile. Two-sided unpaired Wilcoxon test. g UMAP presentation of the well-known HSC aging marker genes, Sbspon, Gpr183, Clu and Ramp2 in each of the single cells. h UMAP plot and violin plot showing the calculated aging score of single cells of different clusters based on the HSC aging genes identified in bulk RNA-seq. In total, 332 upregulated genes in old HSCs were used for aging score calculation. Two-sided unpaired Wilcoxon test. **P < 0.01, ****P < 0.0001.
Fig. 3
Fig. 3. Identification of CD150 as an HSC aging heterogeneity marker.
a Workflow for identifying heterogeneity marker genes in old HSCs. b FACS plot showing expression level of CD150 in young (3 months) and old (22–24 months) HSCs. c HSCs from old mice were separated into four subgroups (25% for each) based on their CD150 protein levels and subjected to bulk RNA-seq, n = 3. d Dot plot showing Pearson correlation between CD150 signature score and aging score based on scRNA-seq data, R = 0.78. e Heatmap showing changes in expression of aging-related genes with ascending level of CD150 based on bulk RNA-seq in c. f Bar plot showing the epigenetic age of CD150low and CD150high HSCs from 22- to 24-month-old mice, n = 4, paired t-test. The HSC subsets from the same mice were paired with dashed line. g Line plot and heatmap showing ATAC-seq signal difference between CD150low and CD150high HSCs in aging-related open and closed regions, respectively. h Diagram of competitive transplantation to evaluate the repopulation capacity of CD150low and CD150high HSCs from old mice. i Whole blood chimerism of CD150low and CD150high HSCs from 22- to 24-month-old donor mice at different time points after the 1st and 2nd transplantation, n = 6 for the first and n = 3 for the second transplantation. Mean ± SD, Student’s t-test, *P < 0.05, **P < 0.01, ****P < 0.0001. The graphic of the mouse in h was created with BioRender.
Fig. 4
Fig. 4. Differentiation, but not self-renewal, is a major defect of old CD150high HSCs.
a Diagram illustration of the transplantation experiment comparing old CD150low and CD150high HSCs. Donor HSCs-derived HSPCs from the bone marrow were analyzed on days 7 and 14 after transplantation. b Representative FACS analysis of donor HSCs-derived HSPCs (left) and quantification of different cell populations 7 days after transplantation (right). LT-HSC (CD45.2 LSK, CD34CD48CD150+), ST-HSC (CD45.2 LSK, CD34+/CD48+CD150+) and MPPs (CD45.2 LSK, CD34+/CD48+CD150) were analyzed, n = 3. c Diagram illustration of the competitive transplantation for evaluating the long-term differentiation of CD150high HSCs. Both PB and bone marrow were analyzed five months after transplantation. d Representative FACS analysis of donor HSC-derived HSPCs (left) and quantification of different cell populations (right) 5 months after transplantation, n = 3. e Bar graph showing the chimerism of donor HSCs in LT-HSCs, ST-HSCs, MPPs and PB 5 months after transplantation, n = 3. f UMAP plot showing cell distribution of HSPCs derived from CD150low and CD150high HSCs in scRNA-seq 14 days after transplantation. g UMAP presentation of cell types predicted based on HSPC marker gene expression (left). In total, 7 different cell types were identified in HSPCs. h Bar graph showing relative abundance of predicted cell types in HSPCs from mice that received old CD150low or CD150high HSCs. Mean ± SD, Student’s t-test, *P < 0.05, **P < 0.01, ***P < 0.001. The graphics of the mouse in a and c were created with BioRender.
Fig. 5
Fig. 5. Transplantation of “younger” subset of old HSCs alleviates aging phenotypes of aged mice.
a Diagram showing the experiment design of individual transplantation of 2000 old CD150low (25% lowest), whole-HSCs (un-selected) and CD150high (25% highest) HSCs into middle-aged recipients (13-month-old), n = 8. Five months after transplantation, a series of hematopoietic and physical tests were performed. b Bar graph showing the percentage of B, T and myeloid cells in the PB of recipient mice of the three groups, n = 8. c Bar graph showing absolute number of blood cells in PB of recipient mice from different transplanted groups, n = 8. d Representative FACS analysis of naïve T cells, Tcm and Tem ratio in CD8+ T cells and their quantification in recipient mice of the three groups, n = 8. e Physical tests of recipient mice that received CD150low, whole-HSCs and CD150high HSCs. Muscle strength, motor coordination and endurance were assessed, n = 8. f Bar graph showing the epigenetic age of recipient mice from different groups using blood samples, n = 4. g Survival curve showing the lifespan difference among mice that received old CD150low, whole-HSCs and CD150high HSCs. Each mouse received 2000 HSCs. Log-rank (Mantel-Cox) test, n = 17. For bf, mean ± SD, one-way ANOVA, *P < 0.05, **P < 0.01, ***P < 0.001, ****P < 0.0001. The graphic of the mouse in a was created with BioRender.
Fig. 6
Fig. 6. Reducing dysfunctional HSCs ameliorates aging phenotypes in old mice after transplantation.
a Diagram showing the experiment design. Individual transplantation of 500 old CD150low HSCs with: 2500 CD150high HSCs (1:5 group); 1000 CD150high HSCs (1:2 group) and 0 CD150high HSCs (1:0 group) into middle-aged recipients (13-month-old). Five months after transplantation, a series of hematopoietic and physical tests were performed. b Bar graph showing the percentage of B, T and myeloid cells in the PB of recipient mice of the different groups. c Bar graph showing the blood cell numbers in PB of recipient mice from different transplanted groups. d Representative FACS analysis of naïve T cells and Tem ratio in CD8+ T cells and their quantification in recipient mice of different groups. e Bar plot showing the results of physical functional tests of recipient mice of different groups. Muscle strength, motor coordination, endurance and locomotor activity were assessed. n = 6 for 1:5 and 1:2 group, n = 7 for 1:0 group, mean ± SD, one-way ANOVA, *P < 0.05, **P < 0.01. The graphics of the mouse and equipment in a were created with BioRender.

References

    1. Brunet, A., Goodell, M. A. & Rando, T. A. Ageing and rejuvenation of tissue stem cells and their niches. Nat. Rev. Mol. Cell Biol.24, 45–62 (2023). - PMC - PubMed
    1. Rando, T. A. & Jones, D. L. Regeneration, rejuvenation, and replacement: Turning back the clock on tissue aging. Cold Spring Harb. Perspect. Biol.13, a040907 (2021). - PMC - PubMed
    1. López-Otín, C., Blasco, M. A., Partridge, L., Serrano, M. & Kroemer, G. Hallmarks of aging: An expanding universe. Cell186, 243–278 (2023). - PubMed
    1. Kennedy, B. K. et al. Geroscience: linking aging to chronic disease. Cell159, 709–713 (2014). - PMC - PubMed
    1. Castellano, J. M., Kirby, E. D. & Wyss-Coray, T. Blood-borne revitalization of the aged brain. JAMA Neurol.72, 1191–1194 (2015). - PMC - PubMed

Substances

LinkOut - more resources