

Silencing PCCA Suppresses CRC Growth and Spread by Modulating EMT and M1 Macrophage Polarization
- PMID: 39744168
- PMCID: PMC11659836
- DOI: 10.7150/ijms.102046
Silencing PCCA Suppresses CRC Growth and Spread by Modulating EMT and M1 Macrophage Polarization
Abstract
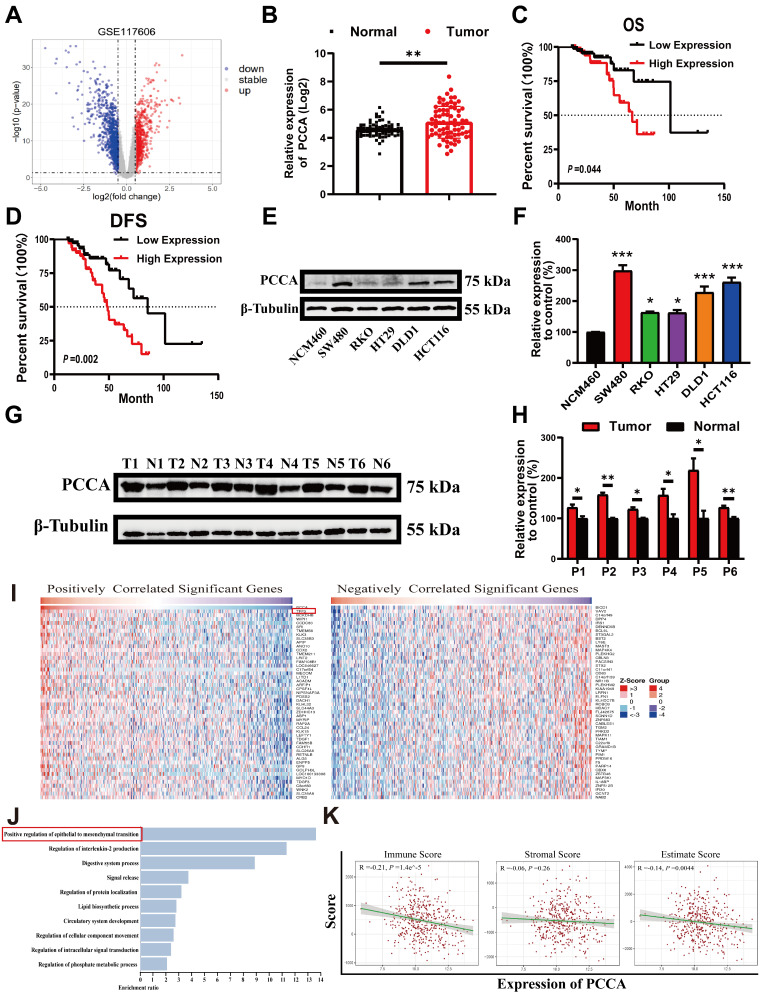
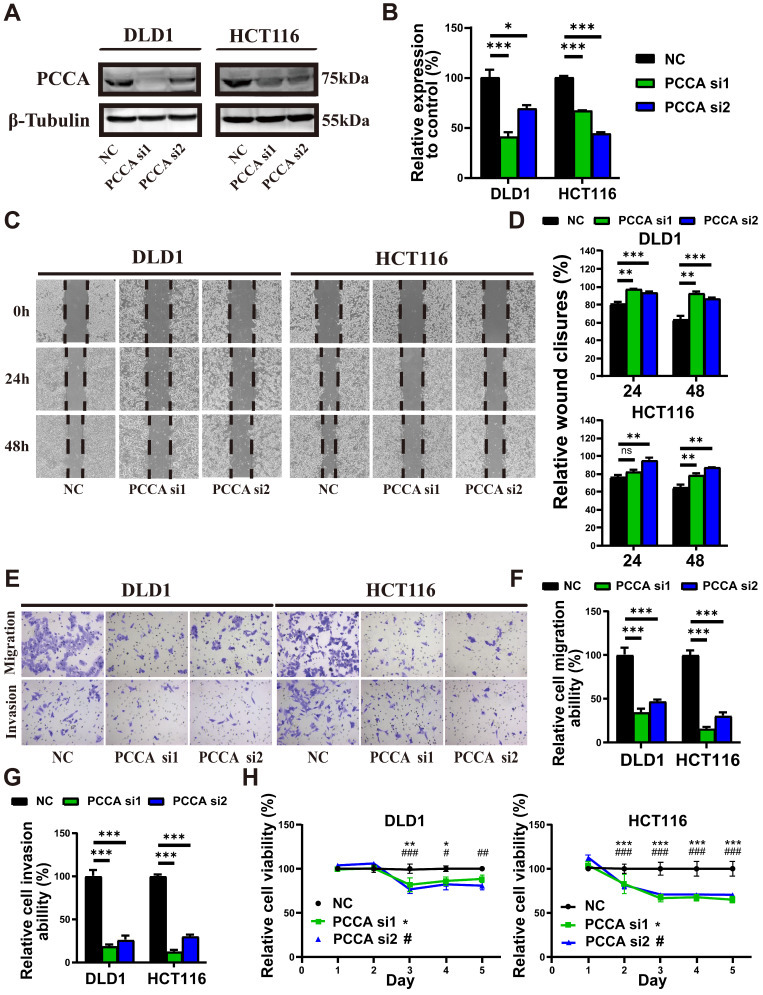
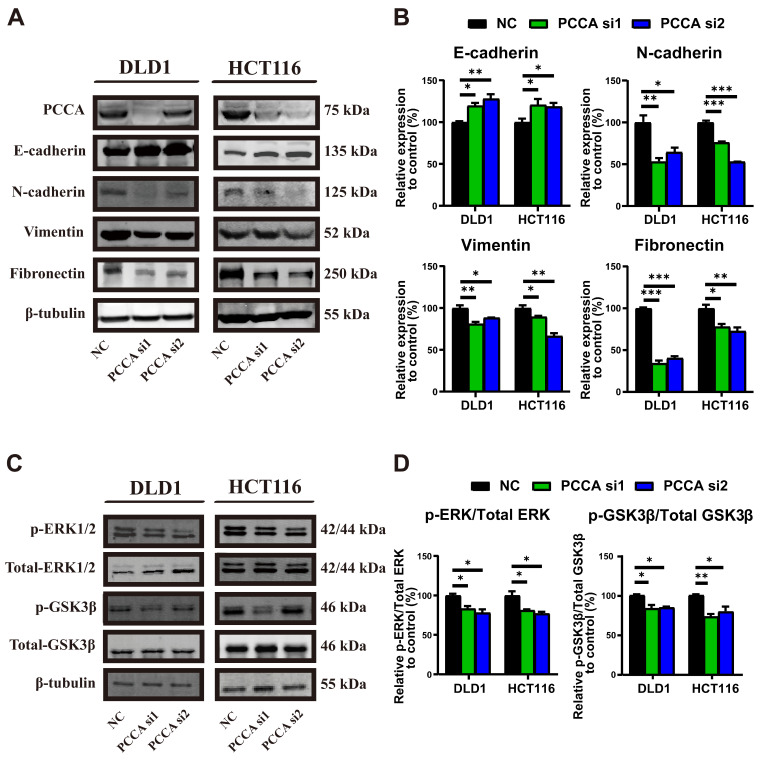
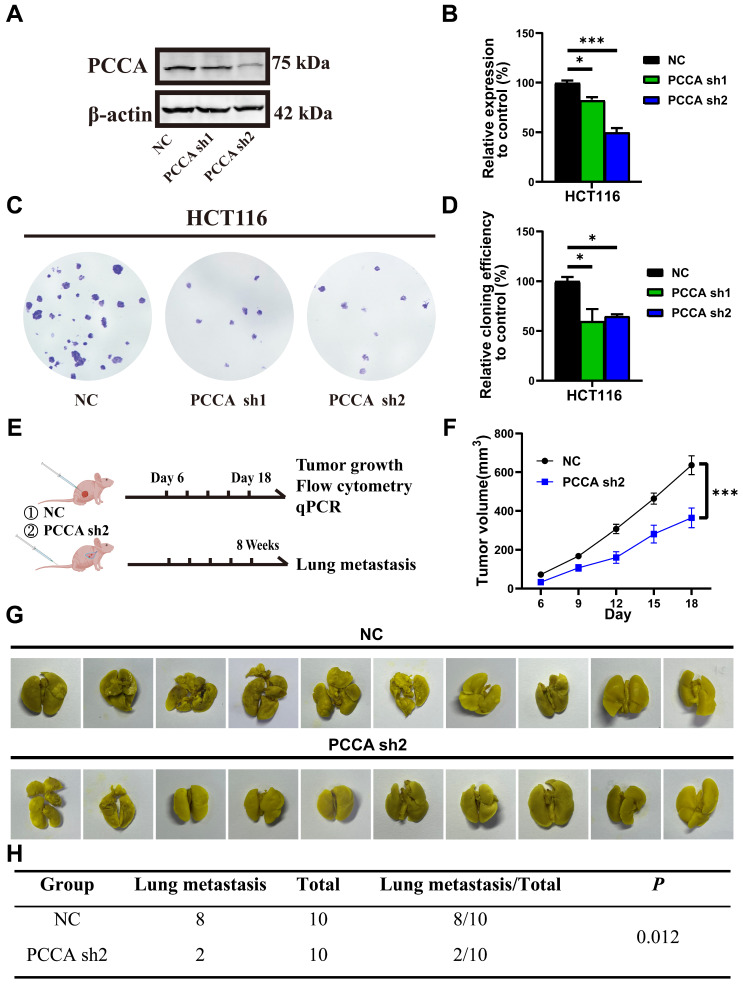
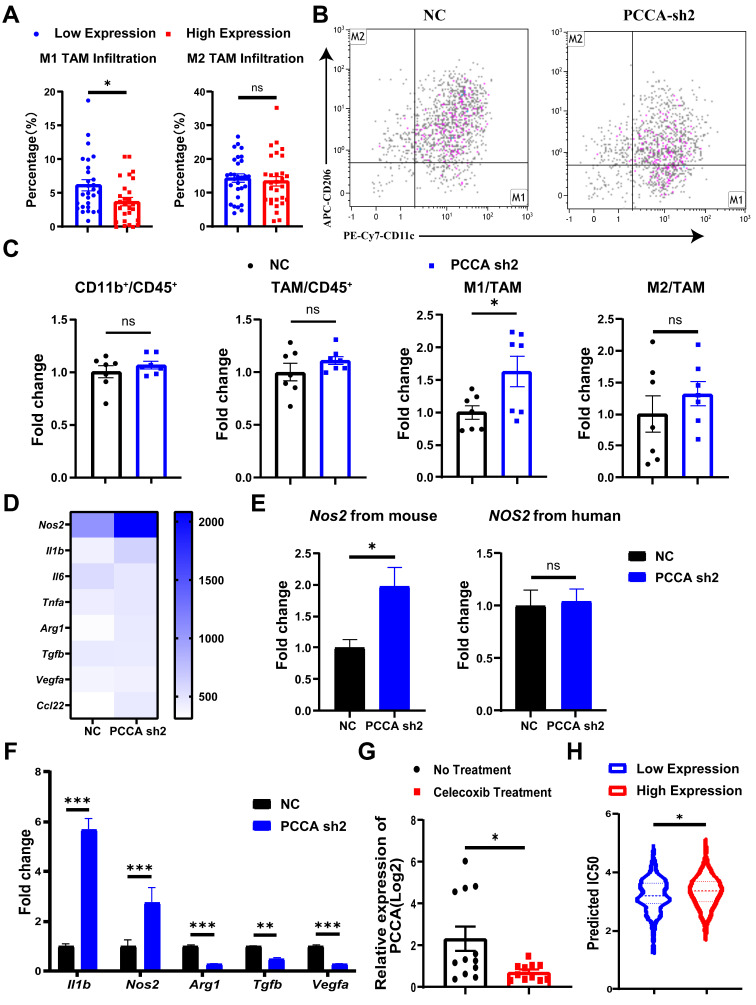
Background: The progression and metastasis of colorectal cancer (CRC) remain major clinical challenges due to a lack of effective therapeutic targets. Our preliminary study identified the upregulation of the propionyl-CoA carboxylase alpha chain (PCCA) gene in CRC, prompting further investigation into its functional roles. Methods: Bioinformatics analysis, colorectal tumor tissues, and CRC cell lines were used to determine PCCA expression. Wound healing, Transwell, and cell counting kit-8 (CCK-8) assays were conducted to evaluate the impacts of PCCA expression on CRC cell migration, invasion, and proliferation. Western blotting was used to assess epithelial-mesenchymal transition (EMT) markers and associated signaling pathways. Mouse models, flow cytometry, and quantitative polymerase chain reaction (PCR) were performed to investigate the influences of PCCA on CRC tumor growth, lung metastasis, and macrophage polarization. Results: PCCA is highly expressed in CRC tumor tissues compared to normal tissues and is associated with a poor prognosis. Knocking down PCCA reduced CRC cell migration, invasion, and proliferation, which were associated with the upregulation of E-cadherin, the downregulation of N-cadherin, Vimentin, and Fibronectin, as well as the inactivation of the extracellular signal-regulated kinase (ERK)/glycogen synthase kinase 3 beta (GSK3β) signaling pathway. Moreover, PCCA knockdown suppressed CRC tumor growth and lung metastasis, accompanied by an increase in M1-macrophage polarization. Conclusion: Knockdown PCCA inhibits the progression and metastasis of CRC, which is associated with EMT reversion, ERK/GSK3β signaling inactivation, and M1-macrophage polarization. These findings suggest that PCCA is a potential target for controlling CRC.
Keywords: Colorectal cancer; Epithelial-mesenchymal transition; Macrophage polarisation; Propionyl-CoA carboxylase; Signal transduction.
© The author(s).
Conflict of interest statement
Competing Interests: The authors have declared that no competing interest exists.
Figures
Similar articles
-
GRHL2 inhibits colorectal cancer progression and metastasis via oppressing epithelial-mesenchymal transition.Cancer Biol Ther. 2019;20(9):1195-1205. doi: 10.1080/15384047.2019.1599664. Epub 2019 May 7. Cancer Biol Ther. 2019. PMID: 31063022 Free PMC article.
-
CHIP functions as an oncogene by promoting colorectal cancer metastasis via activation of MAPK and AKT signaling and suppression of E-cadherin.J Transl Med. 2018 Jun 19;16(1):169. doi: 10.1186/s12967-018-1540-5. J Transl Med. 2018. PMID: 29921293 Free PMC article.
-
NUBPL, a novel metastasis-related gene, promotes colorectal carcinoma cell motility by inducing epithelial-mesenchymal transition.Cancer Sci. 2017 Jun;108(6):1169-1176. doi: 10.1111/cas.13243. Epub 2017 Jun 14. Cancer Sci. 2017. PMID: 28346728 Free PMC article.
-
Reduced Proline-Rich Tyrosine Kinase 2 Promotes Tumor Metastasis by Activating Epithelial-Mesenchymal Transition in Colorectal Cancer.Dig Dis Sci. 2024 Nov;69(11):4098-4107. doi: 10.1007/s10620-024-08643-y. Epub 2024 Oct 16. Dig Dis Sci. 2024. PMID: 39414740
-
Crosstalk between cancer cells and tumor associated macrophages is required for mesenchymal circulating tumor cell-mediated colorectal cancer metastasis.Mol Cancer. 2019 Mar 30;18(1):64. doi: 10.1186/s12943-019-0976-4. Mol Cancer. 2019. PMID: 30927925 Free PMC article.
References
-
- Sung H, Ferlay J, Siegel RL. et al. Global Cancer Statistics 2020: GLOBOCAN Estimates of Incidence and Mortality Worldwide for 36 Cancers in 185 Countries. CA Cancer J Clin. 2021;71:209–249. - PubMed
-
- Miller KD, Nogueira L, Devasia T. et al. Cancer treatment and survivorship statistics, 2022. CA Cancer J Clin. 2022;72:409–436. - PubMed
-
- Biller LH, Schrag D. Diagnosis and Treatment of Metastatic Colorectal Cancer: a Review. Jama. 2021;325:669–685. - PubMed
-
- Kahi CJ, Boland CR, Dominitz JA. et al. Colonoscopy Surveillance after Colorectal Cancer Resection: Recommendations of the US Multi-Society Task Force on Colorectal Cancer. Am J Gastroenterol. 2016;111:337–346. 347. - PubMed
-
- Piawah S, Venook AP. Targeted therapy for colorectal cancer metastases: a review of current methods of molecularly targeted therapy and the use of tumor biomarkers in the treatment of metastatic colorectal cancer. Cancer. 2019;125:4139–4147. - PubMed
MeSH terms
LinkOut - more resources
Full Text Sources
Medical
Research Materials
Miscellaneous
