. 2024 Dec 18:15:1465393.
doi: 10.3389/fendo.2024.1465393. eCollection 2024.

Hypoxic conditions affect transcriptome of endometrial stromal cells in endometriosis and promote TGFBI axis

Affiliations

Hypoxic conditions affect transcriptome of endometrial stromal cells in endometriosis and promote TGFBI axis

Meruert Sarsenova et al. Front Endocrinol (Lausanne). .

Abstract

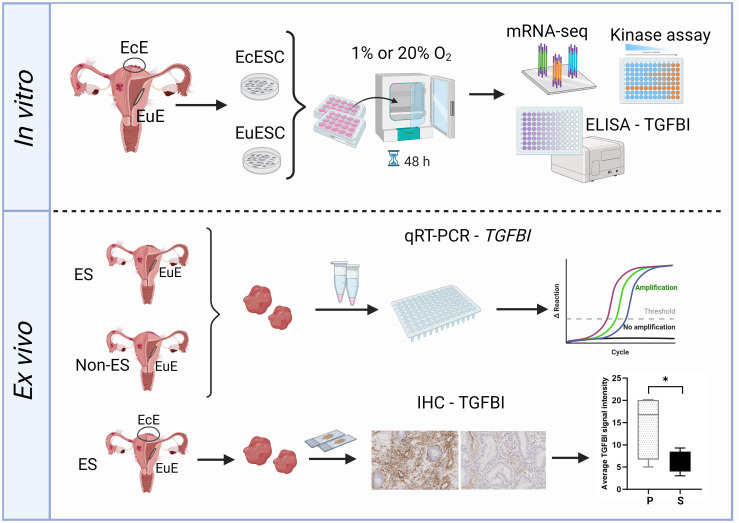
Background: Endometriosis is characterized by the ectopic growth of endometrial-like cells, causing chronic pelvic pain, adhesions and impaired fertility in women of reproductive age. Usually, these lesions grow in the peritoneal cavity in a hypoxic environment. Hypoxia is known to affect gene expression and protein kinase (PK) activity. We aimed to explore the changes in the transcriptome and PK activity characteristic of eutopic and ectopic endometrium in endometriosis under hypoxia.

Methods: Eutopic (EuESCs) and ectopic (EcESCs) endometrial stromal cells were exposed to hypoxia (1% O2) or normoxia (20% O2) for 48 hours. We assessed PK activity and examined transcriptome using mRNA-seq in cells cultured under hypoxic or normoxic conditions. Enzyme-linked immunosorbent assay, quantitative reverse transcription-PCR and immunohistochemistry were performed for the downstream analysis of Transforming Growth Factor Beta Induced (TGFBI) expression.

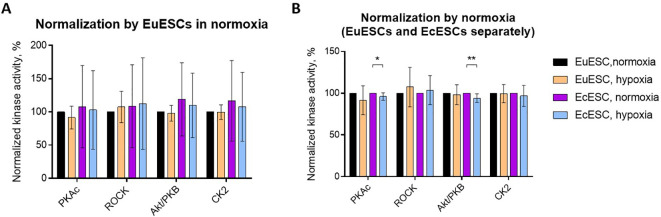
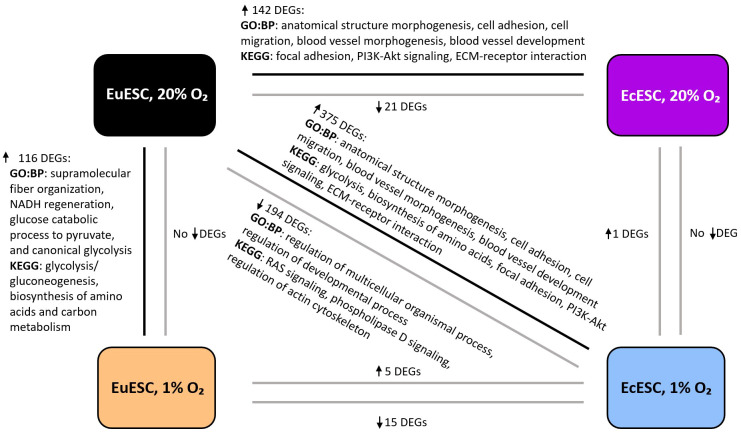
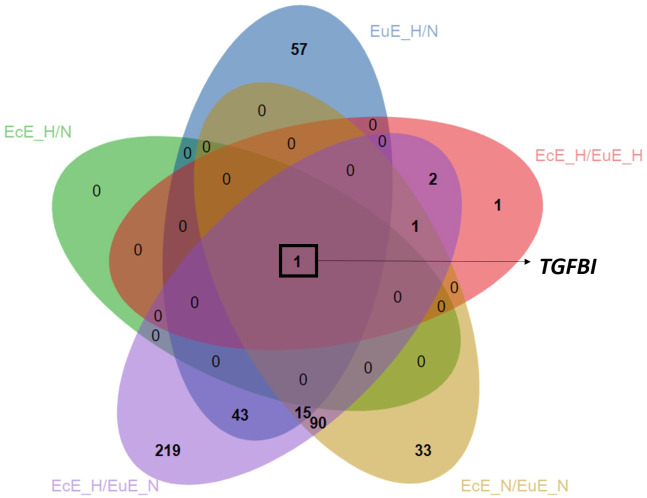
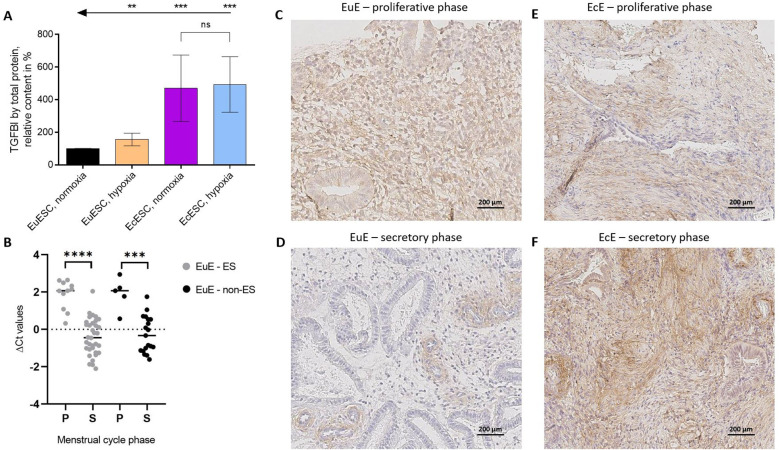
Results: The kinase assay revealed a minor decrease in cAMP-dependent PK (PKAc) and Akt activity and a trend towards an increase in Rho-dependent PK (ROCK) activity in response to exposure to hypoxic conditions in EcESCs. A wider examination of the hypoxia-mediated changes in transcriptomes of cultured cells revealed that the genes related to aerobic glycolysis and cellular metabolism were upregulated in EuESCs exposed to hypoxia. In contrast, EcESCs had a single differentially expressed gene (TGFBI) upregulated under hypoxic conditions. This gene was also found to be overexpressed in EuESCs exposed to hypoxia vs normoxia, and in EcESCs vs EuESCs in normoxia. The level of secreted TGFBI in the spent culture media was accordingly high in the EcESC cultures and in the EuESC culture exposed to hypoxia. In the eutopic endometrial tissue biopsies, TGFBI mRNA and protein expression depended on the menstrual cycle phase, with higher levels observed in the proliferative phase. TGFBI staining showed the protein localized to the stroma and around the blood vessels. In the secretory phase, TGFBI protein expression was stronger in ectopic endometrium compared to paired eutopic endometrium.

Conclusions: Within this study, we showed hypoxia-mediated transcriptome changes characteristic of EuESCs and EcESCs and identified TGFBI as a potential therapeutic target for endometriosis due to its role in fibrosis and angiogenesis.

Keywords: TGFBI; endometriosis; hypoxia; peritoneal lesions; stromal cell cultures; transcriptomics.


Conflict of interest statement

Authors MS, KK, VM, KS, AS, MP, and DL were employed by the company Celvia CC AS. The remaining authors declare that the research was conducted in the absence of any commercial or financial relationships that could be construed as a potential conflict of interest.

Figures

Figure 1
Figure 1
Protein kinase activity profiles in lysates of EuESCs or EcESCs incubated in different oxygenation conditions. The normalization was done by EuESCs in normoxia (A) or by normoxia in EuESCs and EcESCs separately set to 100% (B). The PKs of interest are listed below the graph and the types of cells and incubation conditions are on the right. EuESCs, eutopic endometrial stromal cells; EcESCs, ectopic endometrial stromal cells; PKAc, cAMP-dependent PK; ROCK, Rho-dependent PK; Akt/PKB, protein kinase B; CK2, casein kinase 2. Each column shows the mean ± standard deviation for samples obtained from 5 different patients. Asterisks indicate pairwise comparisons (t-test with Welch’s correction): **P ≤ 0.01, *P ≤ 0.05; only statistically significant comparisons are shown.
Figure 2
Figure 2
The representative biological processes (GO: BP) and enriched pathways (KEGG) in the comparison groups. The analysis is based on statistically significant DEGs, Padj < 0.05). DEGs, differentially expressed genes; EuESCs, eutopic endometrial stromal cells; EcESCs, ectopic endometrial stromal cells. The arrows next to the DEGs indicate up- or down-regulation.
Figure 3
Figure 3
Venn diagram depicting overlapped upregulated DEGs between comparison groups. The analysis is based on statistically significant DEGs, Padj < 0.05). EcE_H/N, EcESCs exposed to hypoxia vs normoxia; EuE_H/N, EuESCs exposed to hypoxia vs normoxia; EcE_H/EuE_H, EcESCs vs EuESCs both exposed to hypoxia; EcE_N/EuE_N, EcESCs vs EuESCs both exposed to normoxia; EcE_H/EuE_N, EcESCs exposed to hypoxia vs EuESCs exposed to normoxia; EuESCs, eutopic endometrial stromal cells; EcESCs, ectopic endometrial stromal cells; DEGs, differentially expressed genes. The novel transcripts corresponding to genes with no nomenclature names were excluded from the list used for creating the Venn diagram, resulting in a smaller number of DEGs in the following groups: EcESCs vs EuESCs exposed to normoxia, and EcESCs exposed to hypoxia vs EuESCs exposed to normoxia.
Figure 4
Figure 4
The confirmation of TGFBI’s importance in the context of endometriosis on the levels of protein and mRNA. (A). Secreted TGFBI protein levels in spent cell culture media relative to the total protein content in the corresponding cell lysates. For each patient, the data was normalized to the relative TGFBI content measured for the EuESCs incubated in normoxia (= 100%). Each column shows the mean ± standard deviation for samples obtained from 5 different patients. Arrows and asterisks indicate pairwise comparisons (t-test with Welch’s correction): ***P ≤ 0.001, **P ≤ 0.01. (B). TGFBI mRNA expression in eutopic endometrial tissues from women with (light grey) or without (black) endometriosis (N = 45 and N = 24, respectively) in proliferative (P) and secretory (S) phases of menstrual cycle. ΔCt values correspond to the relative expression level of TGFBI, the thick line is the median. An unpaired two-tailed t-test with Welch’s correction was applied, ****P value < 0.0001, ***P value < 0.001. (C–F). TGFBI protein localization in EuE and EcE from women with endometriosis at the proliferative (C, E) and secretory (D, F) phases of the menstrual cycle. Scale bar 200 μm. EcESCs, ectopic endometrial stromal cells; EuESCs, eutopic endometrial stromal cells; EuE, eutopic endometrium; EcE, ectopic endometrium; ES, endometriosis; non-ES, non-endometriosis; ns, not significant.
Figure 5
Figure 5
The study workflow overview. Upper panel: ectopic endometrial stromal cells (EcESCs) and eutopic endometrial stromal cells (EuESC) were isolated from ectopic endometrium (EcE) and eutopic endometrium (EuE), respectively. The primary cell cultures were exposed to hypoxic (1% O2) or normoxic (20% O2) conditions for 48 hours followed by examination of gene expression (mRNA-seq), assessment of kinase activity (kinase assay) and detection of TGFBI level in culture media (ELISA assay). Lower panel: the samples of EuE from women with and without endometriosis were subjected for qRT-PCR to assess the level of expression of TGFBI. EuE and EcE from women with and without endometriosis were used for immunohistochemistry (IHC) for TGFBI protein localization and quantification of TGFBI signal intensity. The Figure was created with BioRender.com (representative IHC images were obtained in this study). EcE, ectopic endometrium; EuE, eutopic endometrium; EcESCs, ectopic endometrial stromal cells; EuESCs, eutopic endometrial stromal cells; ES, endometriosis; Non-ES, non-endometriosis; IHC, immunohistochemistry.

Similar articles

Cited by

References

    1. Hsiao KY, Lin SC, Wu MH, Tsai SJ. Pathological functions of hypoxia in endometriosis. Front Biosci (Elite Ed). (2015) 7:309–21. doi: 10.2741/e736 - DOI - PubMed
    1. Wu MH, Hsiao KY, Tsai SJ. Hypoxia: The force of endometriosis. J Obstet Gynaecol Res. (2019) 45:532–41. doi: 10.1111/jog.2019.45.issue-3 - DOI - PubMed
    1. Kasvandik S, Samuel K, Peters M, Eimre M, Peet N, Roost AM, et al. . Deep quantitative proteomics reveals extensive metabolic reprogramming and cancer-like changes of ectopic endometriotic stromal cells. J Proteome Res. (2016) 15:572–84. doi: 10.1021/acs.jproteome.5b00965 - DOI - PubMed
    1. Young VJ, Brown JK, Maybin J, Saunders PTK, Duncan WC, Horne AW. Transforming growth factor-β Induced warburg-like metabolic reprogramming may underpin the development of peritoneal endometriosis. J Clin Endocrinol Metab. (2014) 99:3450–9. doi: 10.1210/jc.2014-1026 - DOI - PMC - PubMed
    1. Chandel NS. Evolution of mitochondria as signaling organelles. Cell Metab. (2015) 22:204–6. doi: 10.1016/j.cmet.2015.05.013 - DOI - PubMed

Substances