

Lipophagy and epigenetic alterations are related to metabolic dysfunction-associated steatotic liver disease progression in an experimental model
- PMID: 39744199
- PMCID: PMC11686535
- DOI: 10.4254/wjh.v16.i12.1468
Lipophagy and epigenetic alterations are related to metabolic dysfunction-associated steatotic liver disease progression in an experimental model
Abstract
Background: Genetic and epigenetic alterations are related to metabolic dysfunction-associated steatotic liver disease (MASLD) pathogenesis.
Aim: To evaluate micro (mi)RNAs and lipophagy markers in an experimental model of metabolic dysfunction-associated steatohepatitis (MASH).
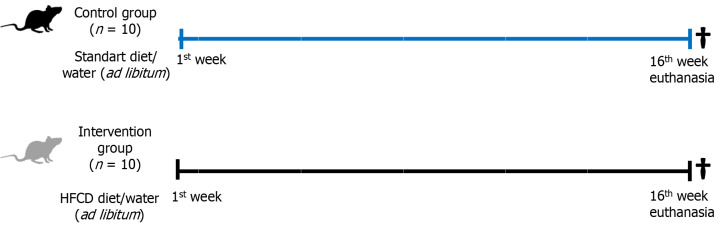
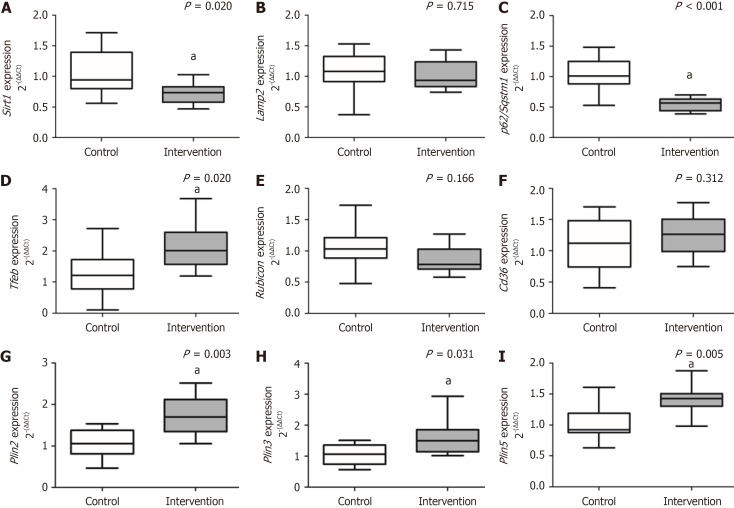
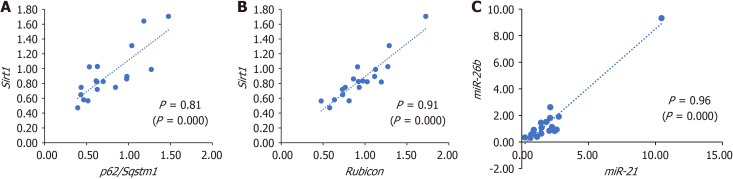
Methods: Adult male Sprague Dawley rats were randomized into two groups: Control group (n = 10) fed a standard diet; and intervention group (n = 10) fed a high-fat-choline-deficient diet for 16 weeks. Molecular evaluation of lipophagy markers in liver tissue [sirtuin-1, p62/sequestosome-1, transcription factor-EB, perilipin-2 (Plin2), Plin3, Plin5, lysosome-associated membrane proteins-2, rubicon, and Cd36], and serum miRNAs were performed.
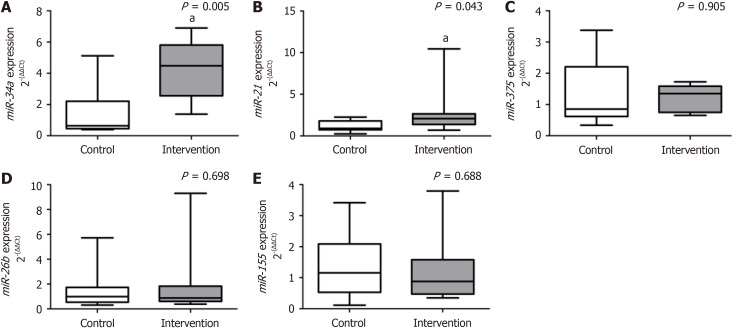
Results: Animals in the intervention group developed MASH and showed a significant decrease in sirtuin-1 (P = 0.020) and p62/sequestosome-1 (P < 0.001); the opposite was reported for transcription factor-EB (P = 0.020), Plin2 (P = 0.003), Plin3 (P = 0.031), and Plin5 (P = 0.005) compared to the control group. There was no significant difference between groups for lysosome-associated membrane proteins-2 (P = 0.715), rubicon (P = 0.166), and Cd36 (P = 0.312). The intervention group showed a significant increase in miR-34a (P = 0.005) and miR-21 (P = 0.043) compared to the control. There was no significant difference between groups for miR-375 (P = 0.905), miR-26b (P = 0.698), and miR-155 (P = 0.688).
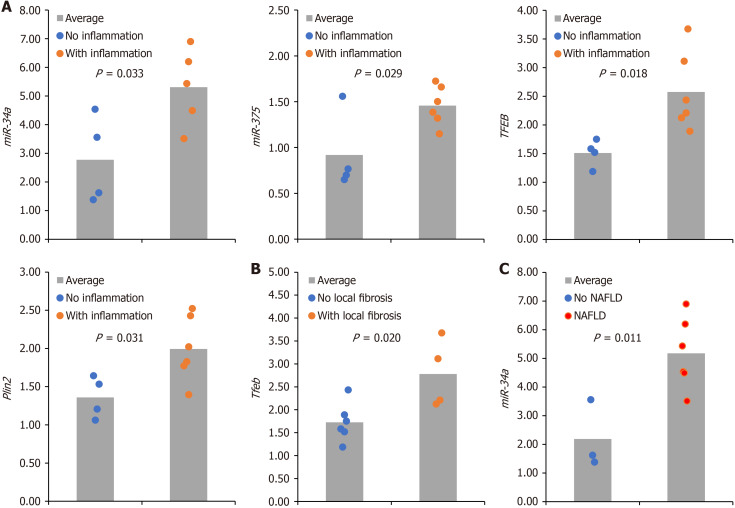
Conclusion: Animals with MASH presented expression changes in markers related to lysosomal stress and autophagy as well as in miRNAs related to inflammation and fibrogenesis, processes that promote MASLD progression.
Keywords: Animal model; Epigenetic; Lipophagy; Metabolic dysfunction-associated steatohepatitis; Metabolic dysfunction-associated steatotic liver disease; MicroRNAs.
©The Author(s) 2024. Published by Baishideng Publishing Group Inc. All rights reserved.
Conflict of interest statement
Conflict-of-interest statement: All authors report no relevant conflicts of interest for this article.
Figures
References
-
- Younossi ZM, Koenig AB, Abdelatif D, Fazel Y, Henry L, Wymer M. Global epidemiology of nonalcoholic fatty liver disease-Meta-analytic assessment of prevalence, incidence, and outcomes. Hepatology. 2016;64:73–84. - PubMed
LinkOut - more resources
Full Text Sources
Research Materials
Miscellaneous
