. 2025 Jan 1;15(1):30-51.
doi: 10.7150/thno.99981. eCollection 2025.

Revolutionizing drug delivery: low-intensity pulsed ultrasound (LIPUS)-driven deep penetration into hypoxic tumor microenvironments of cholangiocarcinoma

Affiliations

Revolutionizing drug delivery: low-intensity pulsed ultrasound (LIPUS)-driven deep penetration into hypoxic tumor microenvironments of cholangiocarcinoma

Sera Hong et al. Theranostics. .

Abstract

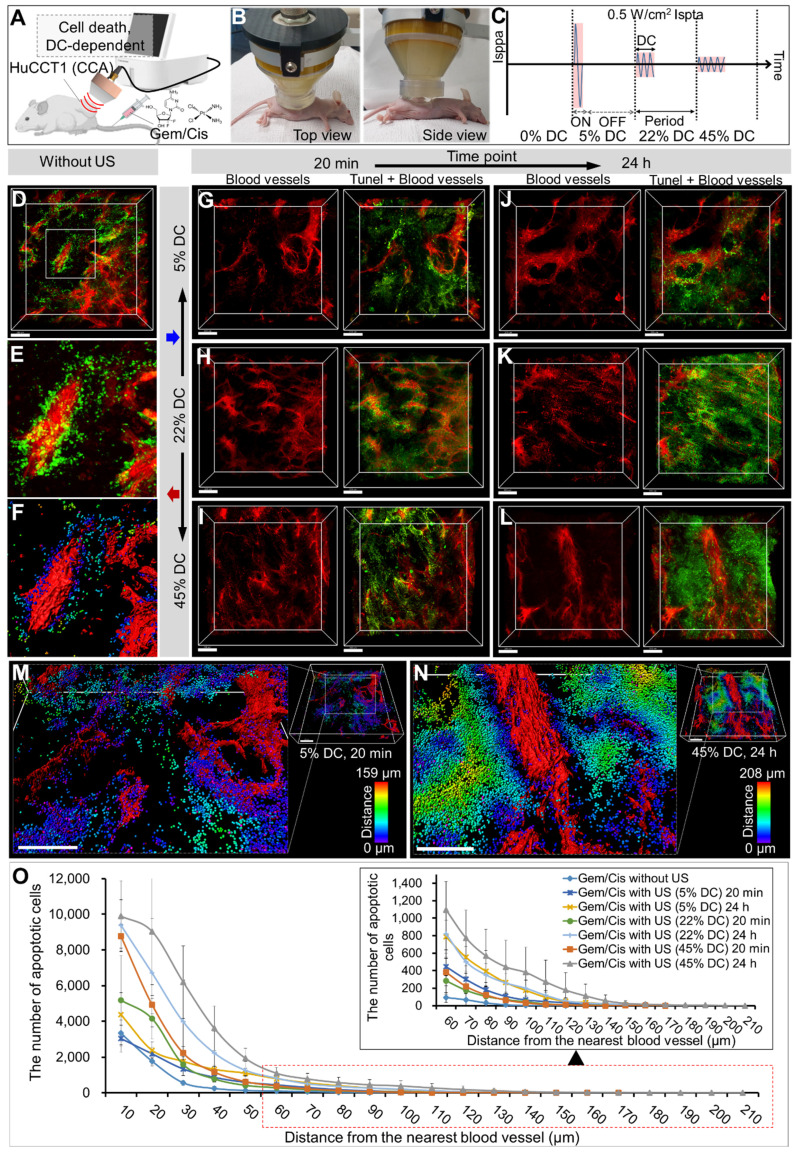
Background: Hypoxia is a major obstacle in the treatment of solid tumors because it causes immune escape and therapeutic resistance. Drug penetration into the hypoxic regions of tumor microenvironment (TME) is extremely limited. This study proposes using the unidirectional fluid flow property of low-intensity pulsed ultrasound (LIPUS) to overcome drug penetration limitations in the TME. LIPUS is gaining attention as a therapeutic modality for cancer owing to its safety and efficacy. Methods: LIPUS parameters, such as the intensity, duty cycle (DC), and duration, were optimized to enhance drug delivery into the hypoxic regions of the TME in cholangiocarcinoma (CCA). Transparent tumor imaging using the tissue optical clearing method (CLARITY) enabled 3D visualization and quantitative assessment of drug delivery and therapeutic efficacy in relation to blood vessels in an intact tumor at the micrometer level. The antitumor efficacy of LIPUS-assisted chemotherapy was evaluated in a CCA xenograft mouse model. Results: LIPUS significantly enhanced drug delivery efficacy into the hypoxic region of the TME in CCA. Under optimal conditions, i.e., a DC of 45% and a spatial-peak temporal-average intensity (Ispta) of 0.5 W/cm², drug penetration, including liposomal nanoparticles and chemotherapeutic agents gemcitabine and cisplatin, was improved by approximately 1.8-fold, resulting in a fivefold increase in apoptotic cancer cell death and a significant reduction in CCA growth. Notably, drug penetration and efficacy were more significantly affected by DC compared to the spatial-peak pulse-average intensity (Isppa). The efficacy saturated at Ispta values above 0.5 W/cm² under a 45% DC. Furthermore, we confirm that LIPUS induces non-thermal effects without causing cell damage, ensuring biosafety. These findings highlight the potential of LIPUS as a non-invasive strategy for treating hypoxic tumors. Conclusion: LIPUS adjuvant therapy promises improved cancer treatment outcomes and offers a safe and innovative therapeutic strategy for CCA and other hypoxic tumors.

Keywords: Cancer imaging; Chemotherapy; LIPUS; Liposome; Unidirectional fluid flow.


Conflict of interest statement

Competing Interests: The authors have declared that no competing interest exists.

Figures

Figure 1
Figure 1
A schematic diagram of the process of administering drugs to mice with cholangiocarcinoma (CCA) and then treating them with low-intensity pulsed ultrasound (LIPUS) under different duty cycle (DC) and spatial-peak temporal-average intensity (Ispta).
Figure 2
Figure 2
Mechanisms of LIPUS in enhancing drug penetration. (A-C) Cell membrane permeability (sonoporation) test. (A) Detection of the permeability of HuCCT1 cell membranes immediately after LIPUS irradiation with ruthenium (Ru) using confocal microscopy. (B) Quantification of the Ru signal area from the acquired cell images, presented as mean value ± SD (n = 3). Scale bar, 100 μm. *** P < 0.001. (C) Flow cytometric analysis of Ru in HuCCT1 cells: control, Ru treatment, and Ru treatment with LIPUS irradiation. (D-G) Unidirectional fluid flow property - examples of dye infiltration. (D) Experimental setup (front view) with a hydrogel-filled cone-coupled ultrasound transducer. (E) Experimental setup (front view) without an ultrasound transducer. (F, G) Dye infiltration depth in the middle sections of melamine foam (dashed line from the front view) after (F) LIPUS irradiation and (G) no LIPUS exposure. (H-J) Thermal effect tests. (H) Temperature variation in the cell culture medium during LIPUS irradiation (at 45% DC and 0.7 W/cm2 Ispta), as assessed by a thermometer. (I) Real image and (J) thermal image of a CCA tumor-bearing mouse 1 h after LIPUS irradiation. Temperature points marked with red dots and blank dots represent the temperatures on the heating pad (the highest temperature point) and in the mouse xenograft tumor, respectively.
Figure 3
Figure 3
3D transparent tumor imaging showing the abnormal vascular network and spatial distribution of LIPUS-mediated anticancer drugs-induced apoptotic cancer cell death in CCA. A schematic diagram illustrating (A) LIPUS treatment in Gem/Cis-treated HuCCT1 tumor-bearing mice, including (B) a photo of a mouse receiving LIPUS and (C) variations in DC and spatial-peak pulse-average intensity (Isppa) under the identical Ispta. (D) 3D blood vessel image (red) with terminal deoxynucleotidyl transferase dUTP nick-end labelling (TUNEL) staining (green), including (E) a magnified view and (F) reconstructed image, acquired from Gem/Cis-treated HuCCT1 tumor-bearing mice (control) without LIPUS irradiation. (G-L) 3D blood vessel images (red) with TUNEL staining (green) acquired from mice receiving LIPUS at 5%, 22%, and 45% DCs either 20 min or 24 h post-drug injection. (G) 5% DC of LIPUS 20 min after drug injection. (H) 22% DC of LIPUS 20 min after drug injection. (I) 45% DC of LIPUS 20 min after drug injection. (J) 5% DC of LIPUS 24 h after drug injection. (K) 22% DC of LIPUS 24 h after drug injection. (L) 45% DC of LIPUS 24 h after drug injection. (M, N) 3D images of 3G and 3L were reconstructed, and apoptotic cell death within the TME was quantitatively analyzed using IMARIS software. (M) and (N) display the 3D-reconstructed images of 3G and 3L (raw images), respectively. Spots (apoptotic cancer cells) are depicted in spectral colors based on their proximity to the nearest blood vessel. All scale bars, 200 μm. (O) Graphical data showing the number of apoptotic cells in relation to the distance from the blood vessel between different DC conditions.
Figure 4
Figure 4
3D transparent tumor images from CCA-bearing mice receiving LIPUS at 0.1, 0.3, 0.5, and 0.7 W/cm2 of Ispta 24 h post-anticancer drug injection. A schematic diagram illustrating (A) LIPUS treatment in Gem/Cis-treated HuCCT1 tumor-bearing mice under (B) variations in Ispta. (C-F) 3D blood vessel images (red) with TUNEL staining (green) acquired from mice receiving LIPUS at (C, G) 0.1, (D, H) 0.3, (E, I) 0.5 and (F, J) 0.7 W/cm2 of Ispta. All scale bars, 200 μm. (K) Graphical data showing the number of apoptotic cells in relation to the distance from the blood vessel between different Ispta conditions.
Figure 5
Figure 5
3D transparent tumor images from CCA-bearing mice receiving LIPUS at 5%, 22%, and 45% of DCs 24 h post-liposomal nanoparticle (Ru-Lip) injection. A schematic diagram illustrating (A, B) LIPUS treatment in Ru-Lip-treated HuCCT1 tumor-bearing mice under (C) variations in DC and Ispta. (D-H) 3D blood vessel images (red) with Ru-Lip (green) acquired from mice receiving LIPUS at (D) 0%, (E) 5%, (F) 22%, (G) 45%, and (H) 45% of DCs (D-G: 0.5 W/cm2 Ispta, H: 0.7 W/cm2 Ispta). (Top) 3D distribution of blood vessel (red) and Ru-Lip (green), (bottom left) blood vessels alone (red), and (bottom right) blood vessels (red) with Ru-Lip (green) and nucleus (blue). All scale bars, 200 μm. (I) Graphical data showing the number of cancer cells taken up by Ru-Lip in relation to the distance from the blood vessel among different DC conditions.
Figure 6
Figure 6
3D transparent tumor images from CCA-bearing mice receiving LIPUS at 0.1, 0.3, 0.5, and 0.7 W/cm2 of Ispta 24 h post-liposomal nanoparticle (Ru-Lip) injection. A schematic diagram illustrating (A, B) LIPUS treatment in Ru-Lip-treated HuCCT1 tumor-bearing mice under (C) variations in Ispta. (D-K) 3D blood vessel images (red) with Ru-Lip (green) acquired from mice receiving LIPUS at (D, H) 0.1, (E, I) 0.3, (F, J) 0.5, (G, K) 0.7 W/cm2 of Ispta. All scale bars, 200 μm. (L). Graphical data showing the number of cancer cells taken up Ru-Lip in relation to the distance from the blood vessel among different Ispta conditions.
Figure 7
Figure 7
Spatial distribution of hypoxic cancer cells and apoptotic cancer cells in hypoxic regions of CCA following tissue clearing. (A) Schematic diagram showing the movement of drugs into hypoxic areas by unidirectional fluid flow and sonoporation of LIPUS (at 0.5 W/cm2 Ispta and 45% DC). (B) Graphical data signifies the percentage of Hif-1α-expressing cells and apoptotic Hif-1α-positive cells in relation to their distance from the blood vessel. (C) Tumor tissues were cleared and immunostained for Hif-1α cells (magenta), blood vessels (red), apoptosis (TUNEL, green), and nucleus (blue). (D) Blood vessels (red). (E) Hif-1α cells (magenta). (F) Apoptotic cancer cell death (green). (G) Both Hif-1α cells and blood vessels. (H) Blood vessels along with Hif-1α cells and apoptotic cells. (I) Magnified image of H (white arrow indicates apoptotic cells expressing Hif-1α). (J) 3D reconstructed image of Hif-1α-expressing cells (magenta spots) and apoptotic cancer cells (green spots) with 3D-vessel structure (red). (K) Apoptotic cancer cells (green) co-localized with Hif-1α expressing cells (magenta) designated by spectral spots relative to blood vessels. As distance increases, color shifts from blue to red. (L) Magnified image of K. All scale bars, 200 μm.
Figure 8
Figure 8
Statistical analysis of LIPUS-mediated Gem/Cis-induced cell death and Ru-Lip uptake by cancer cells at different DCs and Ispta levels. (A) Following Gem/Cis administration, with LIPUS applied 24 h later, the number of apoptotic cancer cells at various DCs under 0.5 W/cm² Ispta was analyzed. (B) Following Gem/Cis administration, with LIPUS applied 24 h later, the number of apoptotic cancer cells at different Ispta levels under 22% DC was analyzed. (C) The uptake of Ru-Lip by total cancer cells at various DCs under 0.5 W/cm² Ispta. (D) The uptake of Ru-Lip by total cancer cells at different Ispta levels under 22% DC. Higher apoptotic cell death efficacy with LIPUS application 24 h post-drug administration compared to 20 min in each (E) 5%, (F) 22%, and (G) 45% DC conditions. (H) Comparison of Ru-Lip uptake by cancer cells under 0.5 W/cm² and 0.7 W/cm² Ispta at 45% DC. (I) The number of Gem/Cis-induced apoptotic cancer cells at distances of over 50 μm, 90 μm, and 140 μm from blood vessels based on 0.5 W/cm² Ispta with various DCs. (J) The number of Gem/Cis-induced apoptotic cancer cells at distances of over 50 μm, 90 μm, and 140 μm from blood vessels based on 22% DC with various Ispta levels. (K) The number of cancer cells taken up by Ru-Lip at distances of over 50 μm, 90 μm, and 140 μm from blood vessels based on 0.5 W/cm² Ispta with various DCs. (L) The number of cancer cells taken up by Ru-Lip at distances of over 50 μm, 90 μm, and 140 μm from blood vessels based on 22% DC with various Ispta levels. (M) A 3D plot of Ispta, DC, and the number of Gem/Cis-induced apoptotic cell death (> 50 μm). (N) A 3D plot of Ispta, DC, and the number of cancer cells taken up by Ru-Lip (> 50 μm). Data are shown as mean ± SD, n = 3. * p < 0.05, ** p < 0.01, *** p < 0.001, **** p < 0.0001.
Figure 9
Figure 9
Tumor growth profile assisted by chemotherapeutic agents and LIPUS combination therapy in CCA (HuCCT1). (A) Group 1 is the control group, receiving saline injection into HuCCT1 tumor-bearing mice, while Group 2 received Gem/Cis treatment alone. Groups 3, 4, and 5 were divided into HuCCT1 tumor-bearing mice receiving Gem/Cis treatment concurrently with LIPUS treatment (at 0.5 W/cm² Ispta with 22% DC, 0.7 W/cm² Ispta with 45% DC, and 0.5 W/cm² Ispta with 45% DC, respectively). The mice were administered Gem/Cis on days 1 and 8, and LIPUS was applied 24 h after each drug administration. (B) Tumor growth size was monitored for 21 d every other day.
Figure 10
Figure 10
The biosafety of LIPUS in vitro and in vivo. (A) Cytotoxicity test. HuCCT1 cell viability was assessed by an MTT assay 24 h after LIPUS irradiation. LIPUS conditions: DCs of 5%, 22%, and 45%, Ispta levels of 0.5 W/cm2 and 0.7 W/cm2. (B) Comparison of cell morphology before and 24 h after LIPUS treatment (0.5 W/cm2 Ispta and 45% DC) under brightfield microscopy. (C) The effect of LIPUS treatment (0.5 W/cm2 Ispta and 45% DC) on the liver (ALT, AST), kidney (BUN, CRE), cardiac/muscle (CPK), and diverse tissue injuries (LDH). The blood levels of ALT, AST, BUN, CRE, CPK, and LDH in nude mice were measured by biochemical methods. Values are expressed as mean ± SD (n = 4). (D) Representative images of hematoxylin and eosin (H&E) and TUNEL staining of heart, kidney, liver, lung, and spleen tissues from the control group and LIPUS group (0.5 W/cm2 Ispta and 45% DC). (E-F) Analysis of HuCCT1 cell migration by wound healing assay. (E) Representative images of wound closure of untreated (top panels) and LIPUS-treated (bottom panels) HuCCT1 cells at 0 h, 6 h, 12 h after cell scratch (LIPUS condition: 0.5 W/cm2 Ispta and 45% DC). The dotted lines define the area lacking cells. (F) Quantification of the wounded area invaded by untreated (blue) and LIPUS-treated (orange) HuCCT1 cells over a 12 h period is presented in relative units (r.u.). Values are expressed as mean ± SD (n = 3). All scale bars, 100 μm.

Similar articles

Cited by

References

    1. Guo S, Deng CX. Effect of Stromal Cells in Tumor Microenvironment on Metastasis Initiation. Int J Biol Sci. 2018;14:2083–93. - PMC - PubMed
    1. Baghba R, Roshangar L, Jahanban-Esfahlan R, Seidi K, Ebrahimi-Kalan A, Jaymand M. et al. Tumor microenvironment complexity and therapeutic implications at a glance. Cell Commun Signal. 2020;18:59. - PMC - PubMed
    1. Jahanban-Esfahlan R, Seidi K, Manjili MH, Jahanban-Esfahlan A, Javaheri T, Zare P. Tumor cell dormancy: Threat or opportunity in the fight against cancer. Cancers. 2019;11:1207. - PMC - PubMed
    1. Seidi K, Neubauer HA, Moriggl R, Jahanban-Esfahlan R, Javaheri T. Tumor target amplification: Implications for nano drug delivery systems. J Control Release. 2018;275:142–61. - PubMed
    1. Zhang B, Hu Y, Pang ZQ. Modulating the tumor microenvironment to enhance tumor nanomedicine delivery. Front Pharmacol. 2017;8:952. - PMC - PubMed

Publication types

MeSH terms