Review
. 2025 Jan 1;15(1):122-140.
doi: 10.7150/thno.97192. eCollection 2025.

Optical coherence tomography (OCT) and OCT angiography: Technological development and applications in brain science

Affiliations
Review

Optical coherence tomography (OCT) and OCT angiography: Technological development and applications in brain science

Luyao Yang et al. Theranostics. .

Abstract

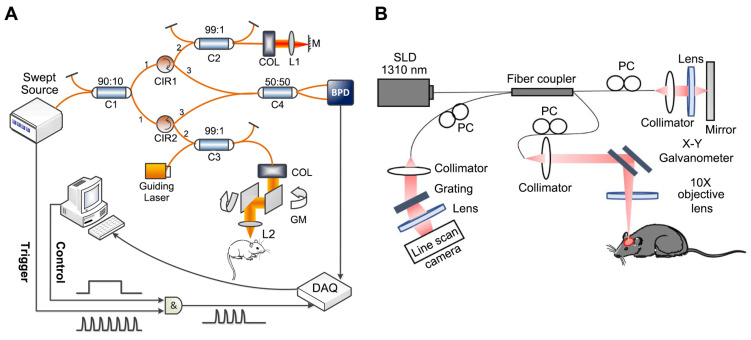
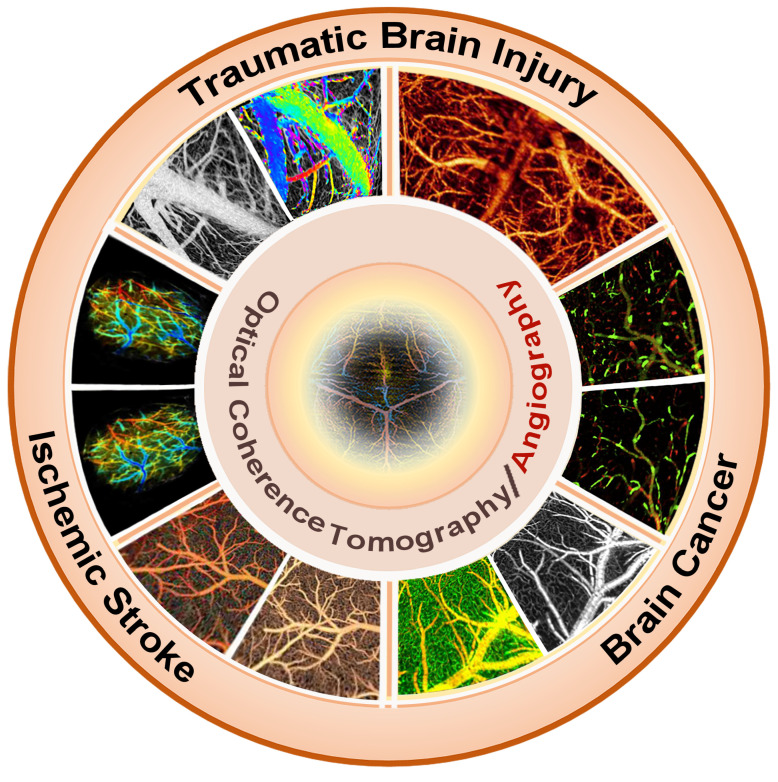
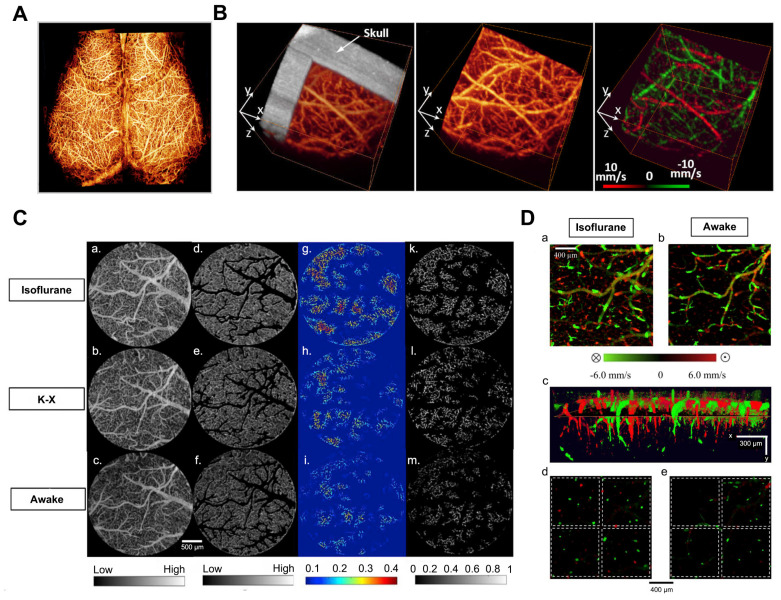
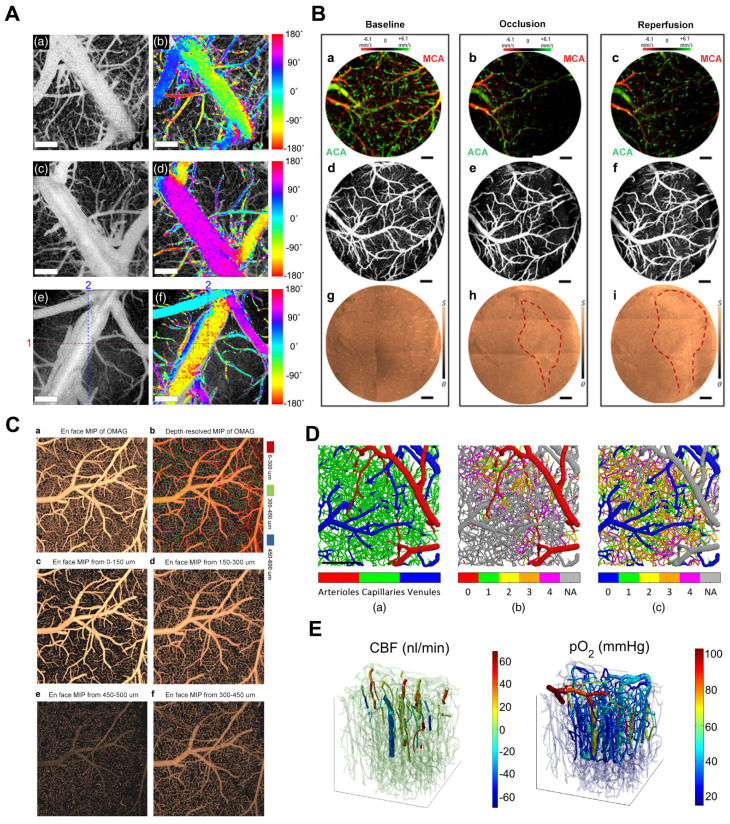
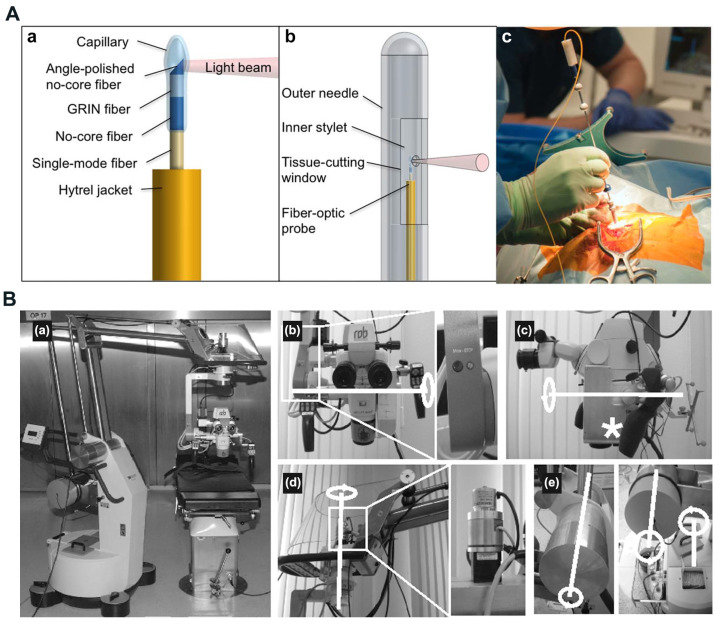
Brain diseases are a leading cause of disability and death worldwide. Early detection can lead to earlier intervention and better outcomes for patients. In recent years, optical coherence tomography (OCT) and OCT angiography (OCTA) imaging have been widely used in stroke, traumatic brain injury (TBI), and brain cancer due to their advantages of in vivo, unlabeled, and high-resolution 3D microvessel imaging at the capillary resolution level. This review summarizes recent advances and challenges in living brain imaging using OCT/OCTA, including technique modality, types of diseases, and theoretical approach. Although there may still be many limitations, with the development of lasers and the advances in artificial intelligence are expected to enable accurate detection of deep cerebral hemodynamics and guide intraoperative tumor resection in vivo in the future.

Keywords: brain cancer; ischemic stroke; optical coherence tomography; traumatic brain injury.


Conflict of interest statement

Competing Interests: The authors have declared that no competing interest exists.

Figures

Figure 1
Figure 1
(A) The implementation of an SS-OCT system. Reproduced with permission from , copyright 2019, SPIE. (B) The implementation of an SD-OCT system. Reproduced with permission from , copyright 2021, Elsevier.
Figure 2
Figure 2
OCT cerebral vascular imaging and its application. Reproduced with permission from , copyright 2021, Elsevier. Reproduced with permission from , copyright 2016, Elsevier. Reproduced with permission from , copyright 2021, SPIE. Reproduced with permission from , copyright 2016 Elsevier. Reproduced with permission from , copyright 2013 PLoS One. Reproduced with permission from , copyright 2009 SPIE.
Figure 3
Figure 3
(A) UHS-OMAG imaged functional blood flow networks throughout the cerebral cortex of mice in vivo. Reproduced with permission from , copyright 2009, Elsevier. (B) In vivo 3D OMAG imaging of the cortical brain of a mouse with the skull left intact. Reproduced with permission from , copyright 2010, Optica Publishing Group. (C) Comparison of VAD and flux in capillaries: (a-c) OMAG angiograms corresponding to isoflurane, ketamine-xylazine, and awake states. (d-f) OMAG angiograms with arteries and veins excluded. (g-i) Capillary VAD maps at three states. (k-m) CFI maps at three states. (D) Comparison of CBF parameters in one animal. (a-b) Bidirectional axial CBF velocity maps of mouse cortex at isoflurane and awake regime. (c) 3D visualization with descending and ascending vessels. (d-e) Orthogonal slices below the cortical surface at isoflurane and awake regime. Reproduced with permission from , copyright 2021, Elsevier.
Figure 4
Figure 4
(A) In vivo 2D transverse flow direction images of mouse brains. (a), (c), and (e) En face mean projections of the inter B-scan OCTA volume images. (b), (d), and (f) Color-encoded blood flow direction information overlaid on the corresponding en-face OCTA images. Reproduced with permission from , copyright 2021, SPIE. (B) The TIM of a 60D dataset on mouse cerebral cortex under baseline, 3-min MCA occlusion, and reperfusion conditions through a cranial window. (a-c) 0 - 500 μm depth axial velocity distribution of the face MIP. (d-f) 0 - 100 μm depth of the microcirculation network of the face MIP. (g-i) En face sAIP of OAC image. Red dashed line points out the region of variation in tissue scattering properties. Reproduced with permission from , copyright 2015 Optica Publishing Group. (C) The frontal classified maximum intensity projection (sMIP) images of the segmented OMAG data. (a) Frontal sMIP images of OMAG at 0-600 μm depth. (b) Frontal depth-resolved (color-coded) sMIP images of OMAG at 0-600 μm depth. (c-f) Frontal sMIP images of OMAG at different depths. Reproduced with permission from , copyright 2016 Elsevier. (D) Angiographic segmentation and superposition of vessel types. Reproduced with permission from , copyright 2023, SPIE. (E) Co-registration of the Two-Photon Microscopy and OCT data from the upper 650 um in a mouse somatosensory cortex. Reproduced with permission from , copyright 2015, Biomed Opt Express.
Figure 5
Figure 5
Schematic of our deep learning (DL) framework for accelerated optical coherence tomography angiography (OCTA). (LR, LQ) low-resolution and low-quality, (HR, LQ) high-resolution and low-quality, (HR, HQ) high-resolution and high quality, SSIM structural similarity index measure, MS-SSIM multiscale structural similarity index measure, PSNR peak signal-to-noise ratio. Reproduced with permission from , copyright 2022 nature portfolio.
Figure 6
Figure 6
(A) OCT angiography shows distal boundary remodeling. Reproduced with permission from , copyright 2013 PLoS One. (B) Longitudinal monitoring of vascular response after chronic PT in male rats. Reproduced with permission from , copyright 2019 Sage Journals. (C) Comparison of 3D OMAG imaging of ischemic stroke cortex before and after MCAO and reperfusion. Reproduced with permission from , copyright 2011 Wiley. (D) Top-view and Side-view vis-OCTA en-face images pseudo-colored according to measured sO2, from immediately before stroke to 7 days after stroke. Reproduced with permission from , copyright 2019 Biomed Opt Express. (E) OMAG and DOMAG images showed dynamic changes in cerebral blood perfusion and blood flow velocity in small areas (1 mm×1 mm) proximal to ACA and MCA after dMCAO. Reproduced with permission from , copyright 2019 IEEE.
Figure 7
Figure 7
(A) Continuous 3D OMAG imaging of the cortex during TBI in mice. Compared to baseline, vascular remodeling and neovascularization occurred gradually in the trauma area during TBI recovery. Reproduced with permission from , copyright 2009 SPIE. (B) 3D OMAG images of the mouse brain at week 4 after trauma show vascular reconstruction (green) at the wound site and surrounded by undamaged functional blood vessels (yellow). Reproduced with permission from , copyright 2011 Elsevier. (C) OCT scan and histological findings in the acute phase of TBI. Examples of OCT areas analysis are highlighted with red dashed line for both young and old animals, while the histological optical picture is presented for astrocytes (GFAP) and microglia/macrophages (IBA1) at the same time points. Reproduced with permission from , copyright 2021 Wiley.
Figure 8
Figure 8
(A) OCT microangiography of (a) glioblastoma microvessels and (a) normal cortical vessels near tumor nodules in rats. Reproduced with permission from , copyright 2017 SPIE. (B) SM-OCT reveals high-resolution features of mice tumor margin in vivo. (a) SM-OCT ortho-slice of the tumor volume, showing the different sections in three dimensions. (b) SM-OCT axial view of mouse cortex with a GBM tumor. (c,d) SM-OCT coronal and sagittal views, respectively, showing the tumor margin. (e) A close-up view of the tumor margin in (d), showing the finger-like invasion of the into the surrounding brain tissue. Reproduced with permission from , copyright 2019 nature portfolio. (C) In vivo imaging of mice after resection of brain cancer. Representative results were shown for healthy areas of the mouse brain before (a), after (b), and on the opposite left side of the brain (c), respectively. The red circle represents the cancer, the gray circle represents the excision cavity, and the square represents the OCT FOV. Reproduced with permission from , copyright 2015 Science Translation Medicine.
Figure 9
Figure 9
(A) Imaging needle design. (a) Schematic of the distal end of the fiber-optic probe. (b) Schematic of the distal end of the imaging needle, showing the outer needle, inner stylet, and fiber-optic probe. (c) Photo showing the imaging needle inserted into a human brain during surgery. Reproduced with permission from , copyright 2018 Science Advances. (B) The completely robotized Möller-Wedel Hi-R 1000 microscope, which retains full manual control of the conventional auto balanced microscope (a). (b)through (e), the internal and external motors, gearboxes, and encoders (details in the magnified boxes) and the motorized axes (highlighted in white). Optical coherence tomography-scanning unit integrated into the light path of the microscope (asterisk in c). Reproduced with permission from , copyright 2013 Neurosurgery.

Similar articles

Cited by

  • Hallmarks of Brain Plasticity.
    Statsenko Y, Kuznetsov NV, Ljubisaljevich M. Statsenko Y, et al. Biomedicines. 2025 Feb 13;13(2):460. doi: 10.3390/biomedicines13020460. Biomedicines. 2025. PMID: 40002873 Free PMC article. Review.

References

    1. Zwanenburg JJ, Hendrikse J, Takahara T, Visser F, Luijten PR. MR angiography of the cerebral perforating arteries with magnetization prepared anatomical reference at 7 T: comparison with time-of-flight. J Magn Reson Imaging. 2008;28(6):1519–1526. - PubMed
    1. Villablanca JP, Nael K, Habibi R, Nael A, Laub G, Finn JP. 3 T contrast-enhanced magnetic resonance angiography for evaluation of the intracranial arteries: comparison with time-of-flight magnetic resonance angiography and multislice computed tomography angiography. Invest Radiol. 2006;41(11):799–805. - PubMed
    1. Hori M, Shiraga N, Watanabe Y, Aoki S, Isono S, Yui M. et al. Time-resolved three-dimensional magnetic resonance digital subtraction angiography without contrast material in the brain: Initial investigation. J Magn Reson Imaging. 2009;30(1):214–218. - PubMed
    1. de Havenon A, Mossa-Basha M, Shah L, Kim SE, Park M, Parker D. et al. High-resolution vessel wall MRI for the evaluation of intracranial atherosclerotic disease. Neuroradiology. 2017;59(12):1193–1202. - PubMed
    1. Wang Y, Liu X, Wu X, Degnan AJ, Malhotra A, Zhu C. Culprit intracranial plaque without substantial stenosis in acute ischemic stroke on vessel wall MRI: A systematic review. Atherosclerosis. 2019;287:112–121. - PMC - PubMed

Publication types

LinkOut - more resources