. 2025 Jan 1;15(1):141-154.
doi: 10.7150/thno.100467. eCollection 2025.

18F-5-fluoro-aminosuberic acid PET/CT imaging of oxidative-stress features during the formation of DEN-induced rat hepatocellular carcinoma

Affiliations

18F-5-fluoro-aminosuberic acid PET/CT imaging of oxidative-stress features during the formation of DEN-induced rat hepatocellular carcinoma

Feng Xiong et al. Theranostics. .

Abstract

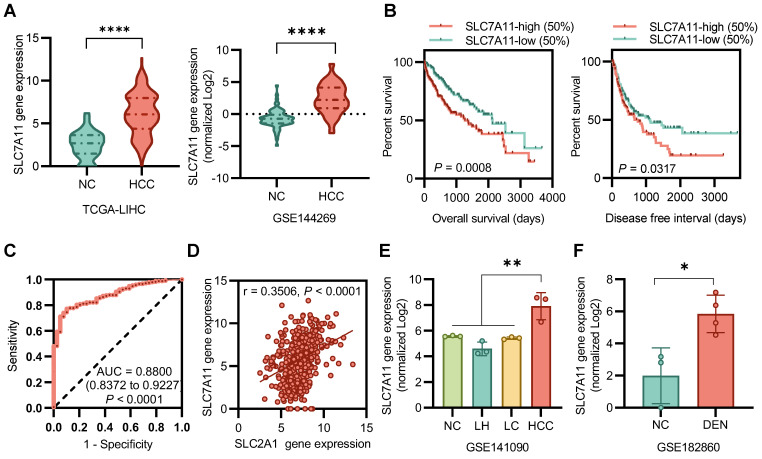
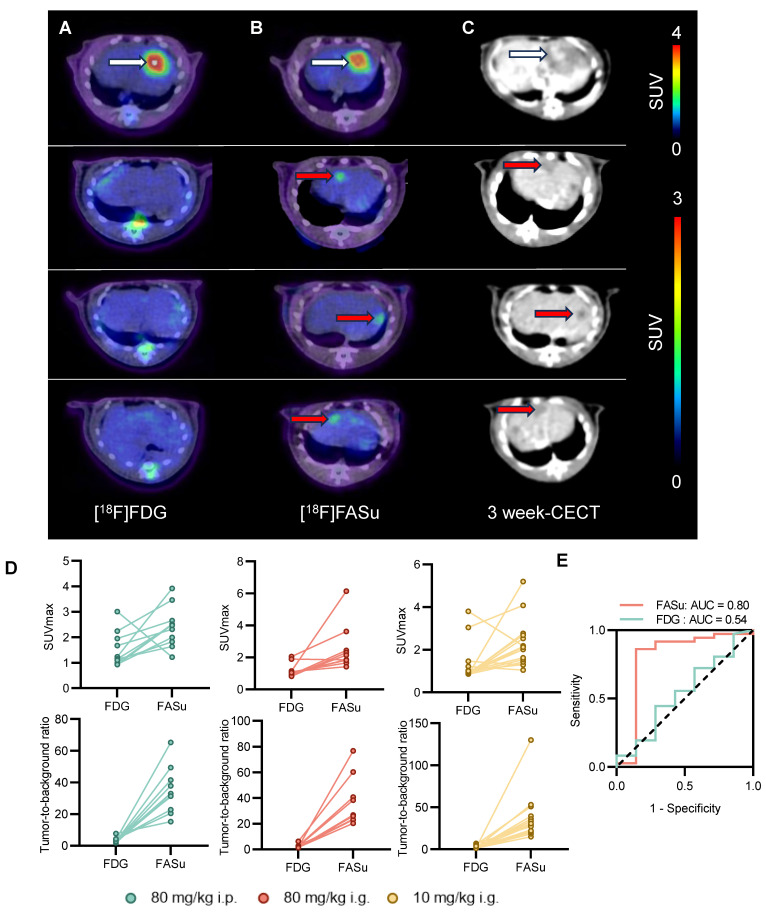
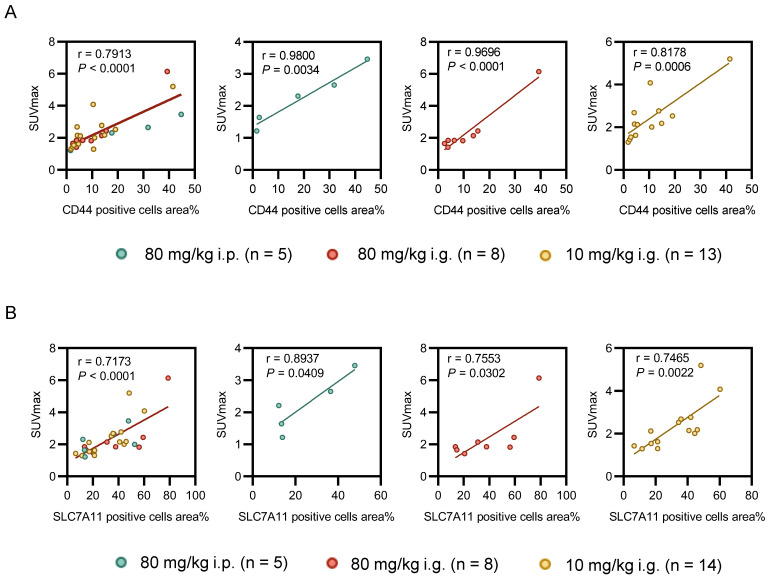
Rationale: The role of oxidative stress metabolism during hepatocellular carcinoma (HCC) formation potentially allows for positron emission tomography (PET) imaging of oxidative stress activity for early and precise HCC detection. However, there is currently limited data available on oxidative-stress-related PET imaging for longitudinal monitoring of the pathophysiological changes during HCC formation. This work aimed to explore PET-based longitudinal monitoring of oxidative stress metabolism and determine the sensitivity of [18F]-5-fluoroaminosuberic acid ([18F]FASu) for assessing pathophysiological processes in diethylnitrosamine (DEN) induced rat HCC. Methods: Genomic and clinical data were obtained from the HCC dataset (n = 383) in The Cancer Genome Atlas (TCGA-LIHC) and Gene Expression Omnibus (GEO) datasets. Wistar rats were administered DEN weekly, either by gavage (i.g.) at doses of 10 mg/kg or 80 mg/kg or by intraperitoneal injection (i.p.) at 80 mg/kg, with continuous modeling over a 12-week period followed by 24 weeks of consecutive feeding. PET/CT imaging was conducted at weeks 8, 15, and 21 by tail vein injections of [18F]FASu and [18F]FDG (~3.7 MBq). Finally, contrast-enhanced CT imaging of the nodules was performed at the designed time point. The rats in each group were sacrificed at multiple time points to perform a correlation analysis between PET imaging findings and histological examinations. Results: Bioinformatics analysis revealed that upregulation expression of SLC7A11 in HCC indicates oxidative stress-altered cellular metabolism and allows early detection of HCC formation. By simulating different levels of oxidative stress in DEN-induced rat HCC, the SUVmax of [18F]FASu PET imaging positively correlated with the expression of CD44 and SLC7A11 (r = 0.7913, P < 0.0001; r = 0.7173, P < 0.0001, respectively), which maintain redox homeostasis in the cells. Compared with 18F-fluorodeoxyglucose ([18F]FDG), [18F]FASu PET imaging demonstrated higher sensitivity for HCC diagnosis and enabled the characterization of pathological changes in DEN-induced rat HCC at an early stage. Conclusions: Our findings regarding the oxidative stress characterization of HCC formation in DEN-induced rat models using [18F]FASu PET imaging demonstrated the exciting potential of oxidative-stress-related PET imaging for monitoring the pathophysiological changes during HCC formation.

Keywords: HCC; Oxidative stress; PET imaging; SLC7A11; [18F]FASu.


Conflict of interest statement

Competing Interests: The authors have declared that no competing interest exists.

Figures

Figure 1
Figure 1
SLC7A11 is upregulated in HCC. (A) Gene expression levels of SLC7A11 were upregulated in tumor tissues derived from HCC patients. (B) Poor prognosis with high SLC7A11 of overall survival (OS) and disease-free interval (DFI). (C) An ROC curve showed that SLC7A11 could effectively distinguish HCC from para-cancer tissues. (D) There was no significant correlation between the expression of SLC7A11 and SLC2A1 in all patients. (E)(F) The mRNA expression of SLC7A11 in HCC is higher than that of other types of liver diseases in DEN-induced rat models. LH = liver hepatitis; LC = liver cirrhosis; NC = normal control; HCC = hepatocellular. *P < 0.05. *P < 0.01. ***P < 0.0001.
Figure 2
Figure 2
Effect of different modes of drug administration on HCC formation. (A) Timeline protocol to characterize DEN-induced rat model of HCC (three groups: group 80 mg/kg i.p., n = 11; group 80 mg/kg i.g., n = 11; and group 10 mg/kg i.g., n = 6). [18F]FASu, [18F]FDG PET/CT and contrast-enhanced CT (CECT) were performed at Week 8, Week 15, Week 21 and Week 24, respectively. (B) Comparison of tumor induction success rates at Week 15 after DEN injection. (C) Average maximal diameters of tumors compared in different groups (80 mg/kg i.p.: 2.75 ± 1.26, n = 4; group 80 mg/kg i.g.: 14.33 ± 7.02, n = 3; and group 10 mg/kg i.g.: 4.00 ± 0.82, n = 4). (D) Representative microscopic features of HCC in H&E stained and AFP and Ki67 immunohistochemical stained liver sections from rats. Photographs showing the characteristics of each group of tumors. P < 0.05. Scale bar = 100 μm.
Figure 3
Figure 3
At Week 8, in vivo [18F]FASu can reveal the differential progression of HCC in three different delivery modes groups with DEN-induced rats. (A) Typical transverse images of [18F]FASu and [18F]FDG PET/CT in different groups at 1h after injection. Standardized uptake value max (SUVmax) (B) and TBR (C) of liver. We analyzed the SLC7A11 (D), and iNOS (E) pathology results in each group around week 8. The liver of rats in the 80 mg/kg i.g. group showed significant inflammatory infiltration compared to the other two groups, while the corresponding SLC7A11 was highly expressed. ns, not statistically significant. ***P < 0.001. Scale bar = 1000 μm.
Figure 4
Figure 4
[18F]FASu enables early diagnosis of tumorigenesis. (A) PET/CT imaging of [18F]FASu and [18F]FDG in DEN-induced primary HCC rats at different time points. Rats were intravenously injected with 7.4 MBq of [18F]FASu and scanned at 1 h postinjection. Tumor lesions were pointed out by red arrows. Comparison of SUVmax (B) and TBR (C) of time-dependent [18F]FASu and FDG for all tumor lesions. (D) Pathologic results showed a time-dependent expression of CD44 and SLC7A11, both of which were significantly higher at Week 21 than at Week 15. **P < 0.001. ***P < 0.0001. Scale bar = 1000 μm.
Figure 5
Figure 5
[18F]FASu has a higher sensitivity than [18F]FDG. At Week 21, [18F]FASu PET/CT (A), [18F]FDG PET/CT (B), and CECT (C). [18F]FASu PET/CT consistently showed more lesions than [18F]FDG PET/CT. white arrowheads indicate lesions detected by [18F]FASu and [18F]FDG, and red arrowheads indicate lesions detected only by [18F]FASu (confirmed by their appearance at corresponding locations in the liver on CECT performed 3 weeks later). (D) For quantitative analysis of SUVmax and TBR for all tumors. (E) An ROC curve showed the better diagnostic performance of FASu over FDG.
Figure 6
Figure 6
Correlation between pathology and oxidative stress levels reflected by [18F]FASu SUVmax at different doses. (A) There was a significant correlation between the percentage area of CD44-positive cells and [18F]FASu SUVmax across all groups (80 mg/kg i.p.: r = 0.9800, P = 0.0034, n = 5; 80 mg/kg i.g.: r = 0.9696, P < 0.0001, n = 8; and 10 mg/kg i.g.: r = 0.8178, P = 0.0006, n = 13). (B) Correlation between the percentage of SLC7A11-positive cells and the uptake of [18F]FASu (80 mg/kg i.p.: r = 0.8937, P = 0.0409, n = 5; 80 mg/kg i.g.: r = 0.7553, P = 0.0302, n = 8; and 10 mg/kg i.g.: r = 0.7465, P = 0.0022, n = 14).

Similar articles

Cited by

References

    1. Sung H, Ferlay J, Siegel RL, Laversanne M, Soerjomataram I, Jemal A. et al. Global Cancer Statistics 2020: GLOBOCAN Estimates of Incidence and Mortality Worldwide for 36 Cancers in 185 Countries. CA Cancer J Clin. 2021;71:209–49. - PubMed
    1. Chidambaranathan-Reghupaty S, Fisher PB, Sarkar D. Hepatocellular carcinoma (HCC): Epidemiology, etiology and molecular classification. Adv Cancer Res. 2021;149:1–61. - PMC - PubMed
    1. Sharma B, Martin A, Zerizer I. Positron emission tomography-computed tomography in liver imaging. Semin Ultrasound CT MR. 2013;34:66–80. - PubMed
    1. Castilla-Lievre MA, Franco D, Gervais P, Kuhnast B, Agostini H, Marthey L. et al. Diagnostic value of combining (11)C-choline and (18)F-FDG PET/CT in hepatocellular carcinoma. Eur J Nucl Med Mol Imaging. 2016;43:852–9. - PubMed
    1. Haug AR. Imaging of primary liver tumors with positron-emission tomography. Q J Nucl Med Mol Imaging. 2017;61:292–300. - PubMed

Publication types