. 2025 Jan 1;15(1):277-299.
doi: 10.7150/thno.101001. eCollection 2025.

A STING agonist prodrug reprograms tumor-associated macrophage to boost colorectal cancer immunotherapy

Affiliations

A STING agonist prodrug reprograms tumor-associated macrophage to boost colorectal cancer immunotherapy

Aohua Deng et al. Theranostics. .

Abstract

Rationale: Tumor-associated macrophages (TAMs) are abundant in colorectal cancer (CRC), correlating with immunosuppression and disease progression. Activation of the stimulator of interferon gene (STING) signaling pathway in TAMs offers a promising approach for CRC therapy. However, current STING agonists face challenges related to tumor specificity and administration routes. Method: The Cancer Genome Atlas (TCGA) database analysis and multicolor immunofluorescence experiments of human CRC samples analysed triggering receptor expressed on myeloid cells 2 (TREM2) expression in the tumor microenvironment of CRC patients. We designed and synthesized a STING agonist prodrug GB2 to reprogram TAMs by targeting TREM2 in tumors. Preliminary evaluation of the anti-tumor capacity of prodrug GB2 in the mouse CRC model intravenously. RNA-seq analysis of bone marrow-derived macrophages (BMDM) after GB2 treatment reveals novel pharmacological mechanisms for the prodrug GB2. Results: Over-expressed TREM2 in TAMs correlates with CRC progression. Via targeting TREM2 expressed in TAMs, GB2 induces comprehensive tumor regression by administrating intravenously in mouse colon cancer models, as well as in a STINGlow mouse melanoma model, with no systemic toxicity. Upon treatment with GB2, TAMs exhibit an M1 phenotype with pro-inflammatory function and demonstrate enhanced phagocytosis capacity. The molecular mechanisms involve (1) GB2 upregulating the Glycolysis-ROS-HIF-1α axis, thereby promoting glucose metabolism and inflammatory cytokine expression; (2) GB2 inducing endoplasmic reticulum-mitochondria contact (MERC), leading to mitochondrial fission, ultimately facilitating Ca2+-mediated phagocytosis. Besides, GB2-treated macrophages reverse immunosuppression, facilitating CD8+ T cell tumor infiltration and effector function. Combining GB2 with αPD-1 therapy reveals a synergistic effect on tumor inhibition, leading to prolonged mouse survival. Conclusion: By targeting TREM2 and activating the STING signaling pathway in TAMs, prodrug GB2 exhibits excellent anti-tumor efficacy and immune-activating capacity in the mouse colon cancer model.

Keywords: STING agonist; TREM2 inhibitor; colorectal cancer; prodrug; tumor associated macrophage.


Conflict of interest statement

Competing Interests: The authors have declared that no competing interest exists.

Figures
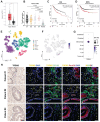
Figure 1
Figure 1
TREM2 is highly expressed in macrophages and correlates with poor prognosis in CRC patients. (A) Box plots illustrating TREM2 expression in colon adenocarcinoma tumors (n = 275) compared to normal specimens (n = 349). (B) TCGA database analysis depicting TREM2 expression in human CRC with different grades: G1 (n = 136), G2 (n = 74), G3 (n = 59), G4 (n = 41), and normal tissue (n = 779). (C and D) Kaplan-Meier curves presenting an OS (n = 1061) and RFS (n = 1336) of colon cancer patients based on TREM2 expression. (E) Plots revealing cell clusters identified in human CRC tumors by t-SNE analysis. (F) Dot plots displaying TREM2 expression level in each cluster. (G) TREM2 expression level in each cluster by t-SNE analysis. (H) Multiple immunofluorescence (IF) staining for TREM2 expression in three human CRC samples. CD163 represents human macrophages. PanCK denotes tumor cells. DAPI indicates nuclei. White dash lines indicate the boundary of CRC tumors and TAMs. Scale bars: 50 μm.
Figure 2
Figure 2
Pharmacological analysis for GB2 in mouse tumor models. (A) Structure of GB2, where the blue part represents the STING agonist MSA-2, and the red part represents TREM2 inhibitor ART. (B) Experimental design: C57BL/6 mice were inoculated with MC38 cells and treated with PBS, MSA-2 (4 mg/kg, e.q.), ART (6 mg/kg, e.q.), GB2 (10 mg/kg) and combination of MSA-2 (4 mg/kg) and ART (6 mg/kg) (A+M). BALB/C mice were inoculated with CT26 cells and treated with PBS, MSA-2 (4 mg/kg, e.q.), and GB2 (10 mg/kg). C57BL/6 mice were inoculated with B16F10 cells and treated with PBS, MSA-2 (4 mg/kg, e.q.), ART (6 mg/kg, e.q.), and GB2 (10 mg/kg). Administration for mice bearing tumors began when tumor size reached about 50 mm3. (C) Growth curve for MC38 tumors with indicated treatment (n = 6). (D) Growth of individual MC38 tumors (n = 6). (E) Weight of MC38 tumors treated with PBS, MSA-2, ART, A+M, and GB2 at day 17 (n = 6). (F) Concentration of IFN-β in tumor from mice with PBS, MSA-2, and GB2 (n = 4). (G) Concentration of IFN-β in serum from mice (n = 3). (H) IF staining for MC38 tumors, staining with p-STING and DAPI. Scale bar, 50 μm. (I) IF staining for tumors, staining with p-STING and DAPI. Scale bar, 100 μm. (J) Growth curve for CT26 tumor with indicated treatment (n = 6). (K) Growth of individual CT26 tumors (n = 6). (L-M) Concentration of IFN-α and IFN-β in tumor (L) and serum (M) from mice (n = 3). (N) H&E staining for skin from mice treated with PBS, MSA-2 (10 mg/kg), and GB2 (10 mg/kg). Scale bars: 500 μm (4×), 200 μm (10×). (O) Growth curve for B16F10 tumors (n = 6). (P) Growth of individual B16F10 tumors (n = 6). (Q) IHC staining for proliferation index Ki67 in B16F10 tumors. Scale bar: 50 μm (R) IF staining for apoptosis marker TUNEL in B16F10 tumors. Scale bars: 100 μm. n indicates biological replicates. Error bars represent means ± SD. Differences between groups were tested using one-way ANOVA followed by Tukey's multiple comparisons test.
Figure 3
Figure 3
RNA-seq revealed that GB2 regulated macrophage to exert anti-tumor effect. (A) Network plot illustrating differentially expressed pathways and their correlated genes. Network plot was performed using the OmicStudio tools at https://www.omicstudio.cn/tool/56. Pink nodes indicate differentially expressed genes. Purple nodes indicate significant pathways. Lines connected nodes represent the subset correlation. (B) Dot plots for macrophage related pathways from GO enrichment, where dot size indicates enrich factor, color represents P value. (C) GO enrichment scatter plot for interferon-related pathways in RAW264.7 cells between GB2-treated and untreated groups. (D) KEGG enrichment scatter plot for pathways associated with macrophage function in RAW264.7 cells between GB2-treated and untreated groups. (E) GSEA plots for pathways significantly changed in RAW264.7 cells between GB2-treated and untreated groups. (F) In vivo macrophage depletion experiments: C57BL/6 mice were subcutaneously inoculated with MC38 tumors and treated with GB2 (10 mg/kg) intravenously and Lipo (200 μL/mouse) intraperitoneally. (G) Growth curve of MC38-inoculated mice with PBS treatment, GB2 treatment, and combinational treatment of GB2 and Lipo (n = 6). (H) IF images for macrophage determination via staining F4/80 expression in tumors. Scale bars: 100 μm. n indicates biological replicates. Error bars represent means ± SD. Differences between groups were tested using one-way ANOVA followed by Tukey's multiple comparisons test.
Figure 4
Figure 4
GB2 inhibits TREM2, activates p-STING, and enhances phagocytosis capacity in RAW264.7 and BMDM. (A) Experimental design: RAW264.7 cells (lower chamber) are cocultured with tumor cells (upper chamber), including MC38, CT26, and B16F10 in a transwell system, and treated with 10 μM MSA-2 and 10 μM GB2 for 12 hours. RNA-Seq was conducted to identify gene change in GB2-treated macrophages. (B) Microscopy observation for Giemsa staining of tumors and morphological analysis of RAW264.7 cells. Scale bars: 100 μm. (C) Western blot results for STING signaling cascades. Vinculin is set as a loading control. (D) Heatmap depicting differential expression of ISGs between untreated or GB2 treated RAW264.7 cells, normalized by z-score. (E) IF staining images for p-STING expression in BMDMs, treating with 10 μM MSA-2 and 10 μM GB2 for 12 hours. Scale bar: 5 μm. (F) IF staining image for TREM2 expression in BMDMs, treating with 10 μM ART and 10 μM GB2 for 12 hours. Scale bar: 5 μm (G) FCM for detecting TREM2 expression in BMDMs, treating with 10 μM ART and 10 μM GB2 for 12 hours. Quantitative analysis was conducted by calculating the positive rates of in indicated groups (n = 3). (H) Heatmap showing differential expression of genes related with phagocytosis between untreated or GB2 treated RAW264.7 cells, with values normalized by z-score (n = 3). (I) Experimental design: primary BMDMs were isolated from mouse bone marrow and stimulated with M-CSF (10 ng/mL) for 7 days. Matured BMDMs were cocultured with CFSE-labeled MC38 for 6 hours, treating with 10 μM MSA-2 and 10 μM GB2. Phagocytosis analysis was conducted by FCM and CLSM. (J) IF staining images for phagocytosis in untreated, MSA-2 treated, and GB2-treated mCherry-RAW264.7 cells (red) or BMDMs (blue), coculturing with CFSE-labeled MC38 (green). Scale bar: 10 μm. (K) FCM graphs for phagocytosis. MC38 was labeled with CFSE, and macrophages were stained with PercpCy5.5. Quantitative analysis was conducted by calculating the positive rates of CFSE+CD11b+ cells in indicated groups (n = 3). n indicates biological replicates. Error bars represent means ± SD. Differences between groups were tested using one-way ANOVA followed by Tukey's multiple comparisons test.
Figure 5
Figure 5
GB2 promotes M1-like macropahge phenotype by upregulating antigen presentation and initiating inflammatory response, and reverses IL4-induced M2-like macrophage phenotype. (A) In vitro experiments for macrophage phenotype analysis after treatment: BMDMs or RAW264.7 are cocultured with MC38 tumor cells in a transwell system, treating with 10 μM MSA-2 and 10 μM GB2 for 12 hours. CM was collected for ELISA to measure the content of IL-6, TNF-α, and CXCL10. BMDMs or RAW264.7 were collected for detecting M1 markers, including CD80, CD86, and MHC II, by FCM. (B) Gene expression of Nos2. (C)Western blot for macrophage activation marker iNOS in untreated, MSA-2 treated, and GB2 treated BMDMs. (D and E) Determination on content of IL-6, TNF-α, and CXCL10 in CM of untreated, MSA-2 treated, and GB2 treated RAW264.7 and BMDMs (n = 3). (F and G) Histograms of FCM detection on CD80, CD86, and MHC II in untreated, MSA-2 treated, and GB2 treated RAW264.7 and BMDMs. Quantitative analysis was conducted by calculating mean fluorescence in indicated groups (n = 3). (H) In vitro experiments for establishing M2 macrophages by IL4 stimulation: RAW264.7 or BMDMs were stimulated by IL4 (20 ng/mL) for 12 hours and treated with 10 μM MSA-2 and 10 μM GB2 for another 12 hours for phenotype analysis, employing Western blot, FCM and CLSM. (I) Western blot detection for CD206 expression in RAW264.7 cells treated with MSA-2 or GB2, VINCULIN is set as the loading control. (J) FCM was utilized to determine the reverse effect of GB2 on IL4 stimulation, by determining the expression of CD206 in RAW264.7 cells. (K) Representative IF images of IL4 treated, IL4 + MSA-2 treated, and IL4 + GB2 treated macrophages, staining with CD206 (M2 marker), F-ACTIN (cytoskeleton), and DAPI (nuclei). Scale bar: 30 μm. n indicates biological replicates. Error bars represent means ± SD. Differences between groups were tested using one-way ANOVA followed by Tukey's multiple comparisons test.
Figure 6
Figure 6
Mechanism analysis for GB2-treated macrophages. (A and B) GSEA analysis from GO (A) and KEGG (B) enrichment from RNA-Seq for untreated and GB2 treated RAW264.7 cells are listed by bubble chart, where the bubble size corresponds to the FDR value, and the bubble color reflects the NES value (n = 3). (C and D) GSEA analysis plot for HIF_1_SIGNALLING_PATHWAY (C) and GLYCOLYSIS_/_GLUCONEOGENESIS (D), displaying with NES value and P value (n = 3). (E and F) Heat map for genes related to glycolysis pathway (E) and HIF-1 pathway (F) between untreated and GB2 treated RAW264.7 cells, normalized by z-score. (G) Glucose-related pathways from GO enrichment are displayed by bubble chart, where P value and FDR are distinguished by color, and the value reflects bubble size (n = 3). (H) Western blot for the expression of GLUT1 in untreated, MSA-2-treated, and GB2-treated RAW264.7 cells. (I) Representative images of fluorescence staining for untreated, MSA-2-treated, and GB2-treated RAW264.7 cells, staining with ROS detector DCFH-DA, mitochondrial detector Mito-Tracker, and Ca2+ probe Rohd-2. Scale bars, 5 μm. (J) Ca2+ related pathway from KEGG enrichment displayed with a column chart, where x-axis represents rich factor, y-axis represents pathway names. (K) Heat map for genes related with calcium homeostasis between untreated and GB2 treated RAW264.7 cells, normalized by z-score (n = 3). (L) Representative images for determination on MERC, staining with Mito-Tracker (red) and ER-Tracker (green), in untreated, MSA-2-treated, and GB2-treated RAW264.7 cells. Intensity charts are displayed with x-axis for distance, y-axis for fluorescence intensity. Scale bars, 5 μm. (M) Schematic illustration for the reprogramming mechanism of GB2-educated macrophage. Treatment: 10 μM MSA-2 and 10 μM GB2 for RAW264.7 cells. n indicates biological replicates.
Figure 7
Figure 7
GB2 reprograms TAMs in murine colon tumor MC38 models. (A) Experimental establishment for TAMs phenotype characterization in BM-MC38 model: Matured BMDMs and MC38 tumor cells were mixed at a ratio of 1:1. The mixture was inoculated in C57BL/J mice. Seven days later, the mice were treated with GB2 (10 mg/kg) intravenously three times, and tumor volumes were recorded. FCM was employed to analyze the phenotype of TAMs. (B and C) Growth curve and tumor weight for BM-MC38 tumors (n = 5). (D) Frequency of TAMs (CD206+F4/80+ cells) in PBS and GB2-treated mice (n = 4). (E) Analysis of TAMs phenotype in PBS and GB2-treated tumor, staining with CD206 and MHC II and calculating with M2/M1 index (n = 4). (F) CD86 expression on TAMs in PBS and GB2-treated tumor (n = 3-4). (G) Infiltration of CD8+ TILs in BM-MC38 tumors (n = 3). (H) Experimental establishment for TAMs phenotype characterization and activation analysis in MC38 model: mice bearing with MC38 tumors were treated with PBS, MSA-2 (4 mg/kg), and GB2 (10 mg/kg) three times. On day 15, the mice were sacrificed, tumors and serum were collected. FCM and IHC were employed to determine phenotype markers, ELISA was conducted to detect cytokines related to macrophage activation. (I) Analysis of TAMs phenotype in PBS-treated, MSA-2-treated, and GB2-treated tumors, staining with CD206 and MHC II and calculating with M2/M1 index (n = 3-5). (J) CD86 expression on TAMs in PBS and GB2-treated tumor (n = 4-6). (K) Representative images of PBS-treated, MSA-2-treated, and GB2-treated tumors staining with CD206. Scale bar, 100 μm. (L and M) Content of macrophage activator, IL-6, TNF-α, and CXCL10, in both tumor and serum from mice treated with PBS, MSA-2, and GB2 (n = 3). n indicates biological replicates. Error bars represent means ± SD. Differences between groups were tested using one-way ANOVA followed by Tukey's multiple comparisons test.
Figure 8
Figure 8
GB2 promotes CD8+ T cell infiltration and effector function, and augments the efficacy of αPD-1 therapy in MC38 mouse model. (A) Representative IF images of PBS-treated, MSA-2-treated, and GB2-treated tumors at day 8 after treatment, staining with CD8 (green) and DAPI (blue). Scale bars, 50 μm. (B) Representative FCM graphs and quantitative analysis of CD8+ T cell infiltration in PBS-treated, MSA-2-treated, and GB2-treated tumors at day 8 after treatment, staining with CD3, CD8 in CD45+ living lymphocytes (n = 3-4). (C and D) Content of IFN-γ in tumor and serum from PBS-treated, MSA-2-treated, and GB2-treated tumors at day 8 after treatment (n = 3). (E) Representative IF images of PBS-treated, MSA-2-treated, and GB2-treated tumors at day 8 after treatment, stained with GZMB (red), CD8 (green), and DAPI (blue). Scale bars, 50 μm. (F) Experimental design: TDLNs were isolated from PBS-treated, MSA-2-treated, and GB2-treated C57BL/6 mice, the single cell suspensions were treated with 100 nM porbol 12-myristate 13-acetate (PMA) and 500 ng/mL ionomycin, adding Brefeldin A (BrefA) or not, for six-hour ex vivo re-stimulation. FCM was employed to determine intracellular content of IFN-γ and GZMB. ELISA was utilized to determine the extracellular concentration of IFN-γ and GZMB (G and H). Frequency of IFN-γ+ CD8+ T cells or GZMB+ CD8+ T cells after re-stimulation in single cell suspension of TDLNs from mice treated with PBS, MSA-2 and GB2 (n = 3-4). (I and J) Content of IFN-γ and GZMB in the CM of re-stimulated TDLN cells, determined by ELISA (n = 3). (K) Experimental for synergistic therapy: MC38-inoculated C57BL/6 mice were treated with GB2 (10 mg/kg) and αPD-1 (100 μg/mouse) when tumor volumes reach 50 cm3. Tumor volume and mouse survival rate were monitored (n = 8). (L) Synergistic efficacy of αPD-1 and GB2 compared to PBS-treated, PD-1-treated tumor. (M) Tumor growth curves for each group with indicates treatment (n = 8). (N) Survival of C57BL/6 mice bearing MC38 tumors after treatment with PBS, αPD-1or combination of αPD-1 and GB2 (n = 8). n indicates biological replicates. Error bars represent means ± SD. Statistical analyses were performed using the Log-rank (Mantel-Cox) test for survival analysis. Differences between groups were tested using one-way ANOVA followed by Tukey's multiple comparisons test.
Figure 9
Figure 9
Schematic illustration for prodrug GB2's antitumor mechanism.

References

    1. Horesh N, Emile SH, Freund M, Garoufalia Z, Gefen R, Zhou PG. et al. Immunotherapy in locally advanced and metastatic rectal cancer: A propensity score matched analysis of the National Cancer Database. J Clin Oncol. 2023;41:e15633–e15633.
    1. Li B, Chen H, Yang SH, Chen F, Xu LL, Li Y. et al. Advances in immunology and immunotherapy for mesenchymal gastrointestinal cancers. Molecular Cancer. 2023;22:71. - PMC - PubMed
    1. Liu Y, Hu YT, Xue JQ, Li JY, Yi J, Bu JW. et al. Advances in immunotherapy for triple-negative breast cancer. Molecular Cancer. 2023;22:145. - PMC - PubMed
    1. Lin XQ, Deng HY, Chen TQ, Chen LK, Yang YL, Qiu GH. et al. Safety and efficacy of immunotherapy rechallenge following checkpoint inhibitor-related pneumonitis in advanced lung cancer patients: a retrospective multi-center cohort study. Transl Lung Cancer R. 2022;11:2289–2305. - PMC - PubMed
    1. Chu CRS, Pietzak E. Immune mechanisms and molecular therapeutic strategies to enhance immunotherapy in non-muscle invasive bladder cancer Invited review for special issue "Seminar: Treatment Advances and Molecular Biology Insights in Urothelial Carcinoma". Urol Oncol-Semin Ori. 2023;41:398–409. - PMC - PubMed

Publication types

MeSH terms