. 2024 Dec 3;2(12):2970-2983.
doi: 10.1021/acsaenm.4c00657. eCollection 2024 Dec 27.

Breaking through Electrospinning Limitations: Liquid-Assisted Ultrahigh-Speed Production of Polyacrylonitrile Nanofibers

Affiliations

Breaking through Electrospinning Limitations: Liquid-Assisted Ultrahigh-Speed Production of Polyacrylonitrile Nanofibers

John Schossig et al. ACS Appl Eng Mater. .

Abstract

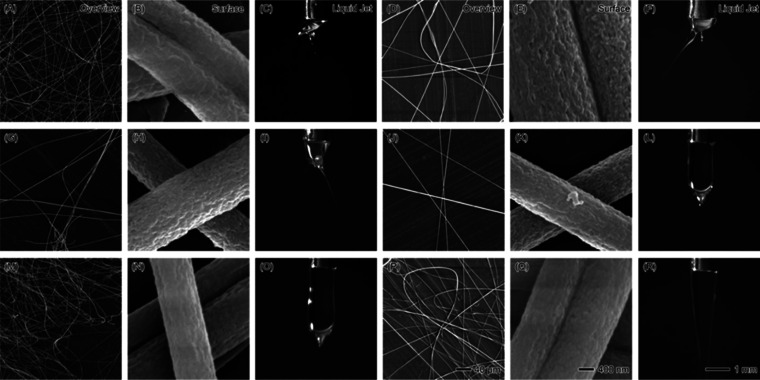
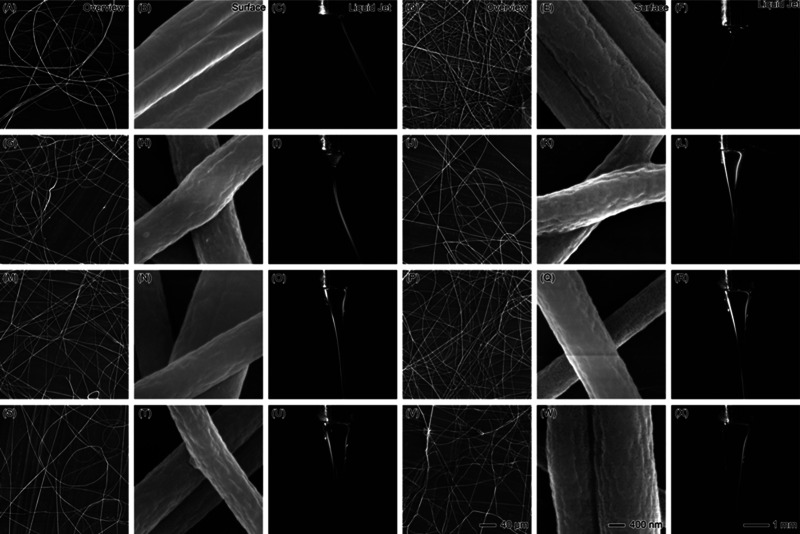
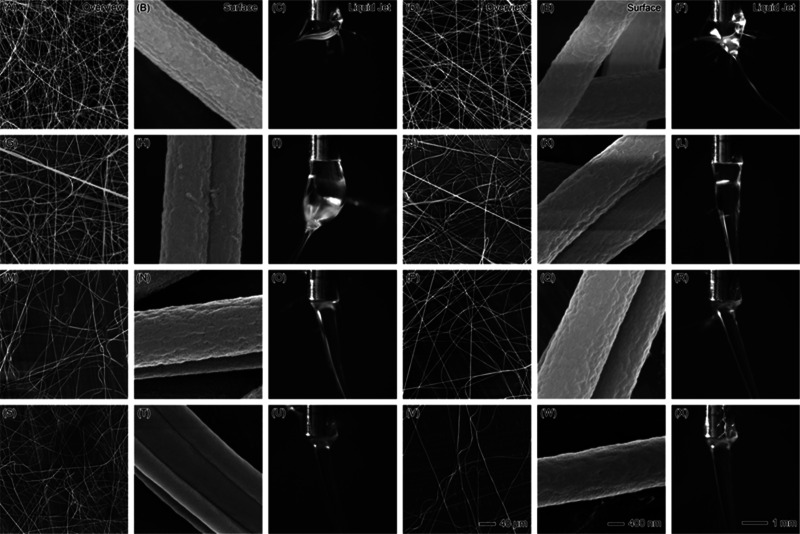
Carbon-based nanofibers are critical materials with broad applications in industries such as energy, filtration, and biomedical devices. Polyacrylonitrile (PAN) is a primary precursor for carbon nanofibers, but conventional electrospinning techniques typically operate at low production rates of 0.1-1 mL/h from a single spinneret, limiting scalability. In this study, we introduce a novel liquid-assisted ultrahigh-speed electrospinning (LAUHS-ES) technique that achieved actual production rates over 220 times faster than conventional methods. This dramatic increase in throughput is achieved through Taylor cone stabilization using a thin layer of liquid sheath, allowing for ultrahigh-speed electrospinning without compromising the structural integrity or uniformity of the nanofibers. Comprehensive characterization, including scanning electron microscopy (SEM), atomic force microscopy (AFM), Fourier-transform infrared spectroscopy (FTIR), and X-ray diffraction (XRD), confirmed the high quality, consistency, and crystallinity of the produced nanofibers. Our results demonstrate that PAN nanofiber fabrication can be scaled up significantly while maintaining precise control over fiber morphology and performance. This advancement holds substantial promise for large-scale industrial applications, enabling more efficient and cost-effective production of carbon-based nanofibers.


Conflict of interest statement

The authors declare no competing financial interest.

Figures

Figure 1
Figure 1
(A) Schematic representation of the LAUHS-ES setup, highlighting the gradual change in Taylor cone geometry as the flow rate increases. Inset shows the variation in Taylor cone shape from initial jet formation to stable cone. (B) Fiber membranes produced after 1 h of electrospinning using conventional electrospinning at 1 mL/h (top) and the novel LAUHS-ES technique at 75 mL/h (bottom), demonstrating a significant increase in production efficiency. Insets provide a closer view of the fiber surface and membrane thickness.
Figure 2
Figure 2
SEM images and liquid jet photographs showing the effects of increasing PAN core flow rates with a constant sheath flow rate of 1 mL/h CHCl3. The top row (A–C) corresponds to 1 mL/h PAN flow rate, the second row (D–F) to 5 mL/h, the third row (G–I) to 10 mL/h, the fourth row (J–L) to 20 mL/h, the fifth row (M–O) to 30 mL/h, and the last row (P–R) to 40 mL/h. Each set includes an overview of the nanofibers (left column), SEM images of fiber surface morphology (middle column), and images of the liquid jet formation (right column). Scale bars: 40 μm (overview), 400 nm (surface morphology), and 1 mm (liquid jet).
Figure 3
Figure 3
SEM images and liquid jet photographs illustrating the effects of increasing PAN core flow rates while maintaining a constant sheath flow rate of 5 mL/h ether. (A–C) 0.1 mL/h PAN, (D–F) 1 mL/h PAN, (G–I) 5 mL/h PAN, (J-L) 10 mL/h, (M–O) 20 mL/h PAN, (P–R) 30 mL/h PAN, (S–U) 40 mL/h PAN, (V–X) 50 mL/h PAN. The scale bar in (V) applies to all overviews (40 μm), the scale bar in (W) applies to all surface morphologies (400 nm), and the scale bar in (X) applies to all Liquid jets (1 mm).
Figure 4
Figure 4
SEM images and liquid jet photographs illustrating the effects of increasing PAN core flow rates with a constant sheath flow rate of 10 mL/h tetrahydrofuran (THF). (A–C) Correspond to 1 mL/h PAN, showing sparse fiber formation in the overview (A), smooth surface morphology (B), and a stable, narrow Taylor cone in the liquid jet (C). (D–F) At 10 mL/h PAN show a denser fiber mat (D), smooth fiber surfaces (E), and a stable, slightly wider Taylor cone (F). (G–I) At 25 mL/h PAN demonstrate an increase in fiber density (G), slight surface roughness (H), and a broader, more defined Taylor cone (I). (J–L) At 50 mL/h PAN display thicker, denser fibers (J), further surface roughness (K), and early signs of Taylor cone instability (L). (M–O) At 75 mL/h PAN show a well-defined fiber mat (M), rough surface texture (N), and a stable but larger Taylor cone (O). (P–R) At 100 mL/h PAN exhibit even denser fibers (P), rough surfaces (Q), and less stability in the Taylor cone (R). (S–U) at 125 mL/h PAN reveal a highly dense fiber mat (S), pronounced surface roughness (T), and increased Taylor cone instability, with polymer dripping from the jet (U). (V–X) At 150 mL/h PAN display thick, uneven fiber distribution (V), a highly rough surface (W), and significant instability in the Taylor cone (X), with frequent polymer dripping and inconsistent fiber production. The scale bar in (V) applies to all Overviews (40 μm), the scale bar in (W) applies to all Surface morphologies (400 nm), and the scale bar in (X) applies to all Liquid jets (1 mm).
Figure 5
Figure 5
Cross-sectional SEM images of nanofibers produced under different flow rate conditions. (A) Shows a nanofiber produced with 5 mL/h PAN and 1 mL/h chloroform (CHCl3), exhibiting a smooth and wrinkled structure. (B) Presents a nanofiber formed with 40 mL/h PAN and 5 mL/h diethyl ether, showing a denser and more compact internal structure. (C) Illustrates a nanofiber produced with 75 mL/h PAN and 10 mL/h tetrahydrofuran (THF), displaying a rougher, and solid internal morphology. The scale bar in (C) applies to all images (400 nm).
Figure 6
Figure 6
AFM images displaying the surface morphology of nanofibers produced with different sheath solvents. (A–D) Nanofiber produced with 5 mL/h PAN and 1 mL/h chloroform (CHCl3); (A) height image over a 25 μm scan, (B) phase image over a 5 μm scan, (C) height image over a 1 μm scan, and (D) 3D height representation over a 1 μm scan. (E–H) Nanofiber produced with 40 mL/h PAN and 5 mL/h diethyl ether; (E) height image over a 25 μm scan, (F) phase image over a 5 μm scan, (G) height image over a 1 μm scan, and (H) 3D height representation over a 1 μm scan. (I–L) Nanofiber produced with 75 mL/h PAN and 10 mL/h tetrahydrofuran (THF); (I) height image over a 25 μm scan, (J) phase image over a 5 μm scan, (K) height image over a 1 μm scan, and (L) 3D height representation over a 1 μm scan. The scale bars in the first row (A,E,I) apply to all height images with a 25 μm scan size (scale bar = 3 μm), the second row (B,F,J) applies to all phase images with a 5 μm scan size (scale bar = 750 nm), and the third row (C,G,K) applies to all height images with a 1 μm scan size (scale bar = 125 nm).
Figure 7
Figure 7
Average diameters of PAN nanofibers produced by LAUHS-ES under various flow rate conditions. (A) Shows the effect of varying PAN flow rates (1–40 mL/h) on fiber diameter with a constant chloroform (CHCl3) flow rate of 1 mL/h. (B) Illustrates the influence of varying CHCl3 flow rates (0.1–3 mL/h) on fiber diameter with a constant PAN flow rate of 5 mL/h. (C) Presents the effect of varying PAN flow rates (1–60 mL/h) on fiber diameter with a constant diethyl ether flow rate of 5 mL/h. (D) Shows the effect of varying ether flow rates (0.1–30 mL/h) on fiber diameter with a constant PAN flow rate of 40 mL/h. (E) Depicts the impact of varying PAN flow rates (1–150 mL/h) on fiber diameter with a constant THF flow rate of 10 mL/h. (F) Illustrates the effect of varying THF flow rates (0.1–50 mL/h) on fiber diameter with a constant PAN flow rate of 75 mL/h. Error bars represent the standard deviation of the measured diameters, reflecting variations in fiber uniformity under different flow rate conditions. Comparison of nanofiber production within 60 min using two different electrospinning methods. (G) Shows the fiber mat produced by conventional electrospinning, with a visibly thinner and less dense fiber layer (top right inset). (H) Displays the fiber mat produced by LAUHS-ES, demonstrating significantly higher fiber density and thickness (top right inset). (I) Presents a quantitative comparison of the mass of nanofibers produced over time by the two methods.
Figure 8
Figure 8
Comprehensive characterization techniques of the structure of the nanofibers. X-ray diffractograms of PAN nanofibers using different sheath liquids. (A) Shows the X-ray diffraction patterns for nanofibers produced with 5 mL/h PAN and varying chloroform (CHCl3). (B) Presents the X-ray diffraction patterns for nanofibers produced with 40 mL/h PAN and varying diethyl ether flow rates. (C) Displays the diffraction patterns for nanofibers produced with 75 mL/h PAN and varying THF flow rates. The vertical lines indicate the primary PAN diffraction peaks around 2θ = 17° and 29°, highlighting the semicrystalline structure of the nanofibers. (D) Infrared (IR) spectra of PAN nanofibers produced with varying core PAN and sheath solvent flow rates.

Similar articles

References

    1. Kenry; Lim C. T. Nanofiber technology: current status and emerging developments. Prog. Polym. Sci. 2017, 70, 1–17. 10.1016/j.progpolymsci.2017.03.002. - DOI
    1. Hiwrale A.; Bharati S.; Pingale P.; Rajput A. Nanofibers: A current era in drug delivery system. Heliyon 2023, 9 (9), e1891710.1016/j.heliyon.2023.e18917. - DOI - PMC - PubMed
    1. Lang C.; Wang H.; Fang J.; Jin J.; Peng L.; Lin T. Recent advances in acoustoelectric conversion of piezoelectric electrospun nanofibers. Nano Energy 2024, 130, 110117.10.1016/j.nanoen.2024.110117. - DOI
    1. Munawar M. A.; Schubert D. W. Revealing Electrical and Mechanical Performances of Highly Oriented Electrospun Conductive Nanofibers of Biopolymers with Tunable Diameter. Int. J. Mol. Sci. 2021, 22 (19), 10295.10.3390/ijms221910295. - DOI - PMC - PubMed
    1. Schoolaert E.; Cossu L.; Becelaere J.; Van Guyse J. F. R.; Tigrine A.; Vergaelen M.; Hoogenboom R.; De Clerck K. Nanofibers with a tunable wettability by electrospinning and physical crosslinking of poly(2-n-propyl-2-oxazoline). Mater. Des. 2020, 192, 108747.10.1016/j.matdes.2020.108747. - DOI

LinkOut - more resources