. 2024 Dec 18:12:1355840.
doi: 10.3389/fpubh.2024.1355840. eCollection 2024.

Long-term trends in educational inequalities in alcohol-attributable mortality, and their impact on trends in educational inequalities in life expectancy

Affiliations

Long-term trends in educational inequalities in alcohol-attributable mortality, and their impact on trends in educational inequalities in life expectancy

Jesús-Daniel Zazueta-Borboa et al. Front Public Health. .

Abstract

Background: Previous studies on socio-economic inequalities in mortality have documented a substantial contribution of alcohol-attributable mortality (AAM) to these inequalities. However, little is known about the extent to which AAM has contributed to time trends in socio-economic inequalities in mortality.

Objective: To study long-term trends in educational inequalities in AAM and assessed their impact on trends in educational inequalities in life expectancy in three European countries.

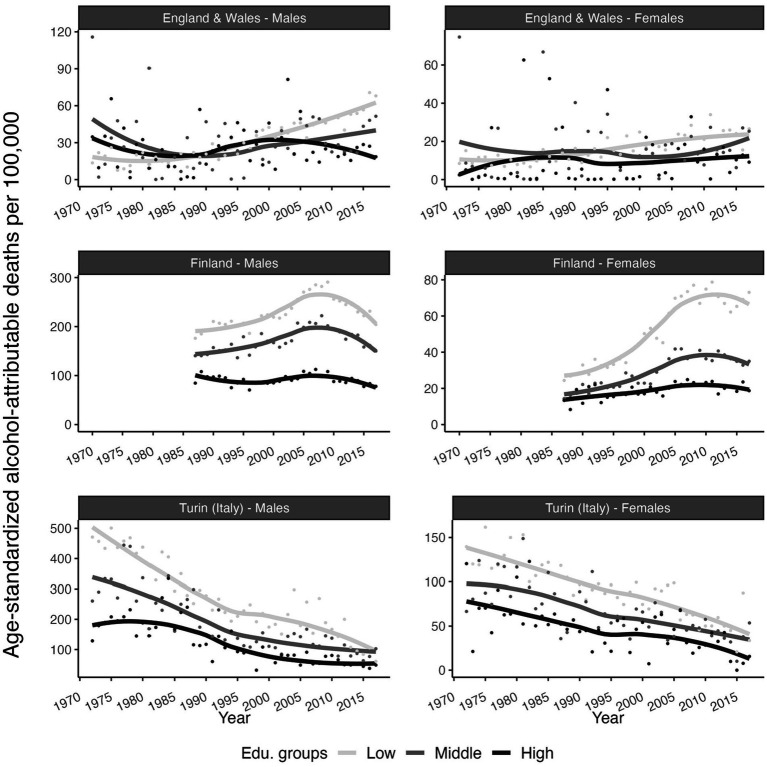
Methods: We analyzed cause-specific mortality data by educational group (low, middle, high) for individuals aged 30 and older in England and Wales, Finland, and Turin (Italy) over the 1972-2017 period. To estimate AAM, we used the multiple causes of death approach for England and Wales and Finland (1987-2017), and a recently introduced method for Turin (Italy). We used segmented regression analysis to study changes in absolute educational inequalities in AAM, measured by the Slope Index of Inequality (SII). We assessed the contribution of AAM to trends in educational differences in remaining life expectancy at age 30 (e30) using cause-deleted life tables.

Results: AAM increased more among the low-educated than the high-educated in England and Wales (1972-2017) and Finland (1987-2007). In contrast, in Finland (2007 onwards) and Turin (1972-2017), AAM decreased more among the low-educated than the high-educated. In England and Wales, AAM contributed 37% (males) and 24% (females) of the increase in educational inequalities in e30. In Finland in 1987-2007, AAM contributed 50% (males) and 34% (females) of the increase in educational inequalities in e30. AAM also contributed to recent trend breaks, such as to the onset of an increase in educational inequalities in e30 in England and Wales, and to the onset of a decline in educational inequalities in e30 in Finland after 2007.

Discussion: AAM mortality contributed substantially not only to levels of, but also to changes in educational inequalities in e30 in the studied populations. Reducing the impact of alcohol on mortality among low-educated groups may positively affect trends in educational inequalities in life expectancy.

Keywords: Europe; alcohol-attributable mortality; educational-inequalities; life-expectancy; trends.


Conflict of interest statement

The authors declare that the research was conducted in the absence of any commercial or financial relationships that could be construed as a potential conflict of interest.

Figures

Figure 1
Figure 1
Smoothed time trends in age-standardized alcohol-attributable deaths per 100,000, by educational attainment level, sex, and country. England and Wales (1972–2017), Finland (1987–2017) and Turin (Italy) (1972–2017). European Standard Population 2013 as standard population. Point are the observed data while the lines are the smoothed trend from Loess-smoothing with span 0.9 and degree 2. Source data: ONS-Longitudinal Study, Statistics Finland, and Turin Longitudinal Study.
Figure 2
Figure 2
Time trends in absolute educational inequalities (SII) in alcohol-attributable mortality (AMM) for England and Wales (1972–2017), Finland (1987–2017), and Turin (Italy) (1972–2017). Points represent the observed values and lines represent the fitted trend obtained from segmented regression analysis (see Table A1). All trend breaks are statistically significant at p-value < 0.05. See Supplementary Table S1 for the p-values. Source data: ONS-Longitudinal Study, Statistics Finland, and Turin Longitudinal Study.
Figure 3
Figure 3
Time trends in educational inequalities in remaining life expectancy at age 30 (e30) with and without alcohol-attributable mortality (AAM) by sex and country. England and Wales (1972–2017), Finland (1987–2017), Turin (Italy) (1972–2017). Points represent the observed values and lines represent the fitted trends obtained from segmented regression analysis. All trend breaks are statistically significant at p-value < 0.05. See Supplementary Table 6 for the p-values. Vertical lines represent the trend breaks in absolute educational inequalities (SII) in AAM obtained from segmented regression analysis. Source data: ONS-Longitudinal Study, Statistics Finland, and Turin Longitudinal Study.

Similar articles

Cited by

References

    1. Probst C, Kilian C, Sanchez S, Lange S, Rehm J. The role of alcohol use and drinking patterns in socioeconomic inequalities in mortality: a systematic review. Lancet Public Health. (2020) 5:e324–32. doi: 10.1016/S2468-2667(20)30052-9 - DOI - PubMed
    1. Probst C, Roerecke M, Behrendt S, Rehm J. Socioeconomic differences in alcohol-attributable mortality compared with all-cause mortality: a systematic review and meta-analysis. Int J Epidemiol. (2014) 43:1314–27. doi: 10.1093/ije/dyu043, PMID: - DOI - PMC - PubMed
    1. Herttua K, Mäkelä P, Martikainen P. Differential trends in alcohol-related mortality: a register-based follow-up study in Finland in 1987–2003. Alcohol Alcohol. (2007) 42:456–64. doi: 10.1093/alcalc/agl099, PMID: - DOI - PubMed
    1. Herttua K, Östergren O, Lundberg O, Martikainen P. Influence of affordability of alcohol on educational disparities in alcohol-related mortality in Finland and Sweden: a time series analysis. J Epidemiol Community Health. (2017) 71:1168–76. doi: 10.1136/jech-2017-209636, PMID: - DOI - PubMed
    1. Mackenbach JP, Kulhánová I, Bopp M, Borrell C, Deboosere P, Kovács K, et al. . Inequalities in alcohol-related mortality in 17 European countries: a retrospective analysis of mortality registers. PLoS Med. (2015) 12:e1001909. doi: 10.1371/journal.pmed.1001909, PMID: - DOI - PMC - PubMed

LinkOut - more resources