. 2025 Jan 1;21(1):433-453.
doi: 10.7150/ijbs.97106. eCollection 2025.

Ganglioside GA2-mediated caspase-11 activation drives macrophage pyroptosis aggravating intimal hyperplasia after arterial injury

Affiliations

Ganglioside GA2-mediated caspase-11 activation drives macrophage pyroptosis aggravating intimal hyperplasia after arterial injury

Yunmin Shi et al. Int J Biol Sci. .

Abstract

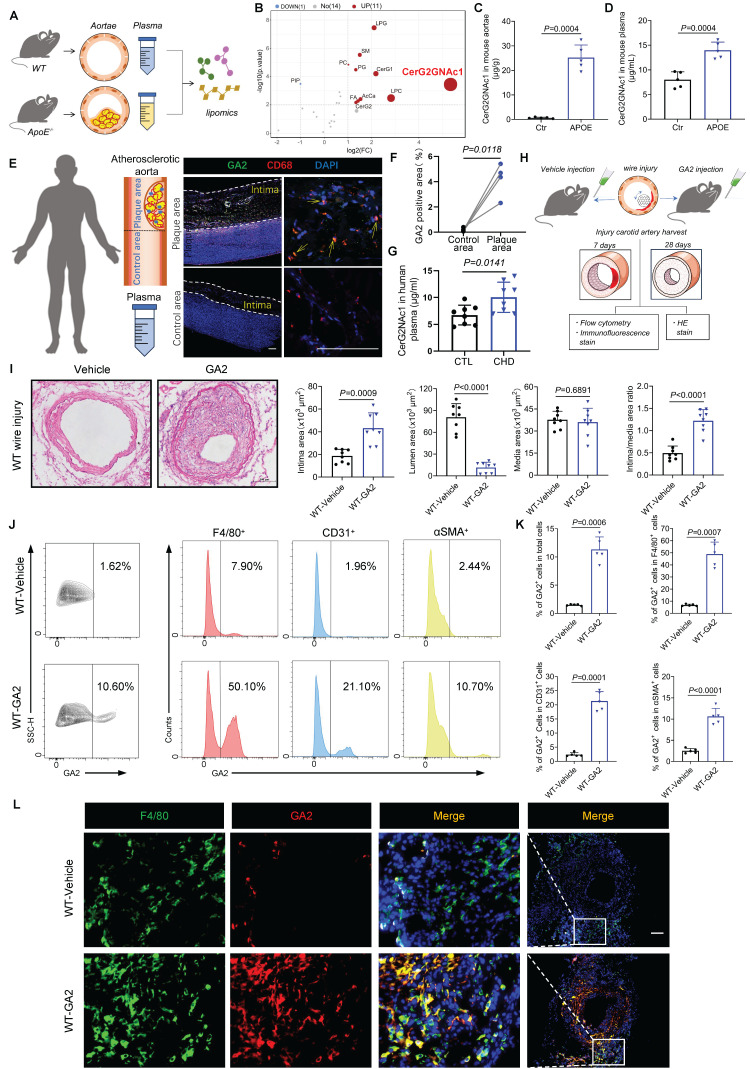
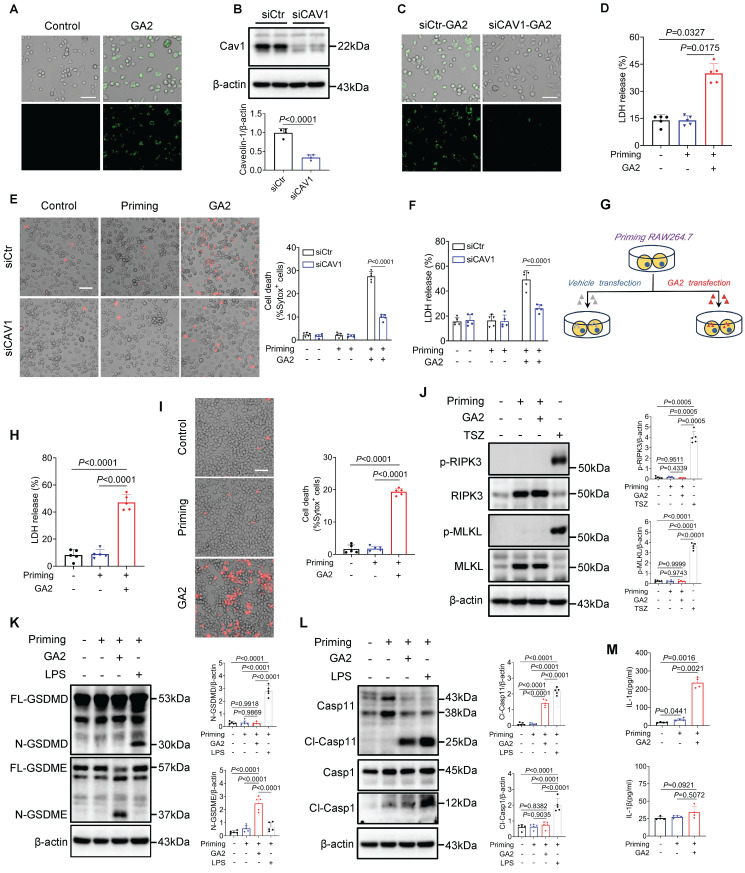
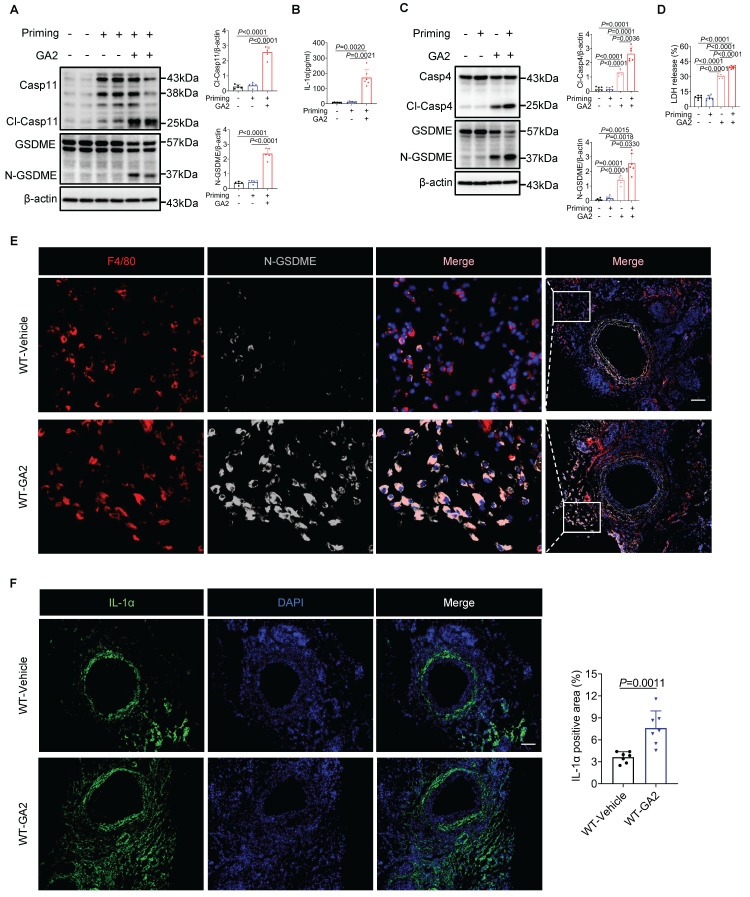
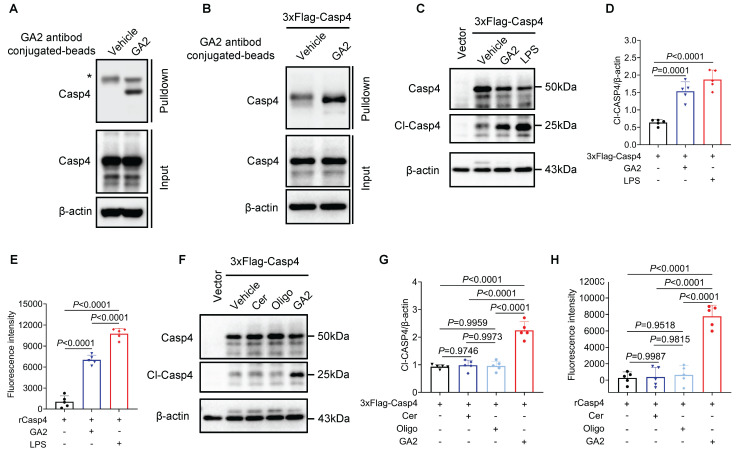
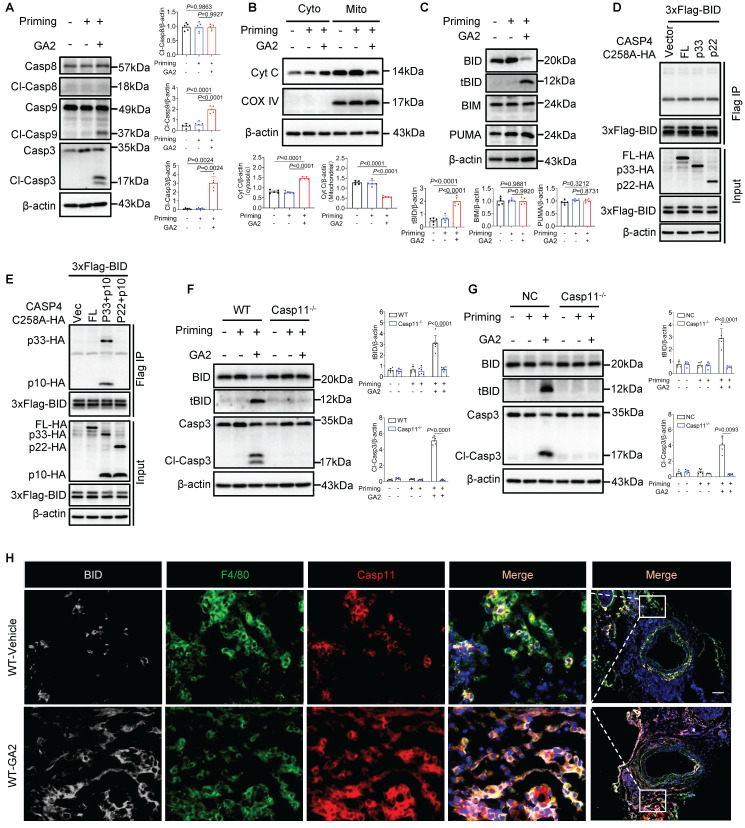
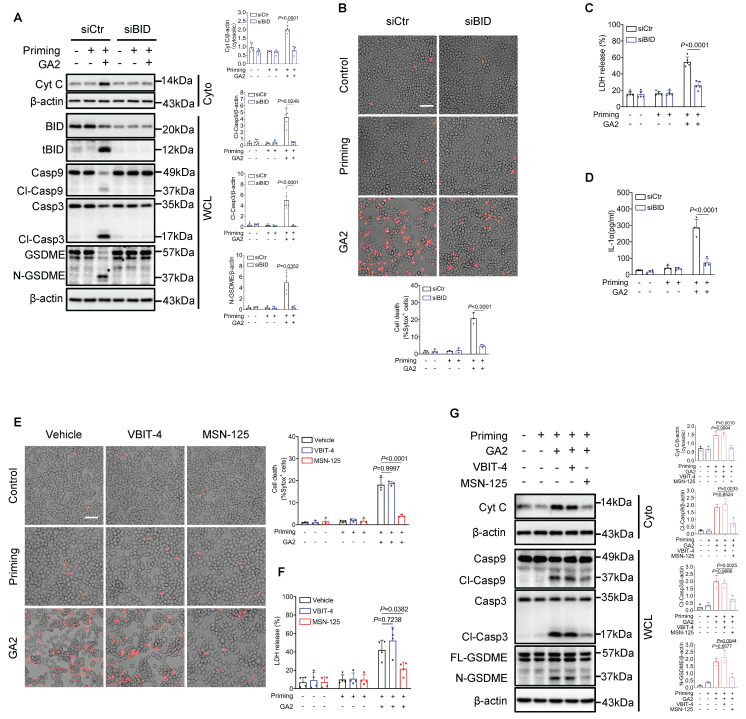
Intimal hyperplasia (IH) remains a significant clinical problem, causing vascular intervention failure. This study aimed to elucidate whether gangliosides GA2 accumulated in atherosclerotic mouse aortae and plasma promote the development of IH. We identified that GA2 was remarkably accumulated in both artery and plasma of atherosclerotic patients and mice. Injected GA2 exacerbated IH and mainly co-stained with macrophages after mouse carotid arterial injury model. Intracellular GA2 induced pyroptosis accompanying the IL-1α release, which was blocked by caspase-11 knockout. Mechanistically, GA2 directly activated caspase-4 as a new ligand. And then, activated caspase-4/11 combined and cleaved BID, promoting the cytochrome C release to cytoplasm, which derived gasdermin E-medicated pyroptosis through activation of caspase-9-caspase-3 pathway. Mice transplanted with caspase-11 deficient bone marrow or mice with caspase-11 knockdown in macrophages exhibited an improvement of the IH aggravated by GA2. These findings suggest GA2-mediated caspase-4/11 activation drives macrophage pyroptosis, contributing to IH. Our results provide a potential diagnostic and therapeutic target in IH.


Conflict of interest statement

Competing Interests: The authors have declared that no competing interest exists.

Figures

Figure 1
Figure 1
GA2 remarkably accumulates in both artery and plasma of atherosclerotic patients and mice; and GA2 largely co-expresses with macrophages in carotid arterial injury model aggravating IH. (A) Experimental design for lipidomics. Wild type (WT) mice fed a normal laboratory diet for 16 weeks served as control (Ctr) group. APOE-/- mice fed high-fat high-cholesterol diet for 16 weeks served as APOE group. (B) Volcano plot of the quantified Classes concentration from Ctr and APOE mouse aortae (n = 5). Cut-off criteria of -log10(p.value) > 2 and |log2 fold change (FC)| > 1 were used, APOE vs Ctr. (C) The quantified CerG2GNAc1 (ganglioside GA2, GA2) from Ctr and APOE mouse aortae (n = 5). (D) The quantified CerG2GNAc1 from Ctr and APOE mouse plasma (n = 5). (E) (left) Experimental design for human vascular tissue and peripheral blood, (right) representative immunofluorescence staining sections from human atherosclerotic thoracic aorta for CD68 (red) and GA2 (green) (n = 4). Nuclei were stained with DAPI (blue). Scale bars: 200 μm. (F) Quantitative analysis of immunofluorescence staining sections from human thoracic atherosclerotic aorta for GA2 (green) (n = 4). (G) The quantified GA2 from plasma of patients with confirmed coronary heart disease (CHD) or patients without CHD (CTR) (n = 8). (H) Experimental design for carotid artery injury model. (I) Representative photomicrographs of hematoxylin and eosin-stained (HE) sections from WT mice after 28 days (d) of the injury and analysis results of intima area, lumen area, media area and intima/media area ratio (n = 8). WT mice were performed carotid arterial injury model, and treated either with vehicle or GA2 through tail intravenous injection one day before surgery and every other day after surgery for 2 weeks. Scale bars: 100 μm. (J-K) Flow cytometry analysis of GA2+ cells, GA2+ cells within total F4/80+ cells, GA2+ cells within total CD31+ cells and GA2+ cells within total αSMA+ cells (n = 5). Single-cell suspensions isolated from the injured carotid arteries of mice. WT mice were treated either with vehicle or GA2 through tail intravenous injection one day before surgery and every other day after surgery for 7 d. (L) Representative immunofluorescence staining sections from the carotid arteries of mice after 7 d of the injury for F4/80 (green) and GA2 (red) (n = 7). Nuclei were stained with DAPI (blue). Scale bars: 100 μm. C, D, I (Intima and Lumen) and K (GA2+ in total, F4/80+ and CD31+) were tested using a two-tailed Welch's t-test; G, I (Media and Intima/media) and K (GA2+ in αSMA) were tested using a two-tailed Student's t-test; F was tested using a two-tailed paired t-test.
Figure 2
Figure 2
Caveolin-1 is required for the GA2 uptake in macrophages; and delivers extracellular GA2 into the cytosol induces the activation of Casp11 and GSDME, cell death and the release of IL-1α in inflammatory macrophages. (A) The uptake of GA2 by mouse peritoneal macrophages (PMs) (n = 6). Green indicates the GA2. PMs were treated with 4 μg/mL fluorescent probe labeled-GA2 for 8 hours (h). Scale bars: 50 μm. (B) Immunoblots for analyzeing the knock-down of caveolin-1 (n = 4). PMs were transfected with siCAV1 (siRNAs targeting caveolin-1) or siCtr (Control siRNA) for 48 h. (C) The uptake of GA2 by PMs (n = 6). PMs were transfected with siCAV1 or siCtr for 48 h, and then treated with 4 μg/mL fluorescent probe labeled-GA2 for 8 h. Scale bars: 50 μm. (D) LDH release of PMs (n = 5). PMs were primed with 100 ng/mL LPS for 6 h to induce inflammatory macrophages. Priming cells were directly stimulated with 4 μg/mL GA2 for 24 h. Priming or non-priming cells stimulated with equimolar DMSO were set as a priming group or a control group. (E) Cell death in PMs measured by SYTOX Green uptake assay (n = 5). Red indicates dead cells. PMs were transfected with siCAV1 or siCtr for 48 h, and then treated as as indicated. Scale bars: 50 μm. (F) LDH release of PMs (n = 5). (G) Experimental design for transfection with GA2 in RAW264.7 cells. (H) LDH release of RAW264.7 cells (n = 5). Priming cells were transfected with 6 μg GA2 for 20 h. Priming or non-priming cells transfected with equimolar DMSO were set as a priming group or a control group. (I) Cell death in RAW264.7 cells (n = 5). Red indicates dead cells. Scale bars: 50 μm. (J) Representative immunoblots of MLKL, pMLKL, RIPK3 and pRIPK3 in RAW264.7 cell lysates and analysis results (n = 5). Cells were triggerd by pretreatment with 20 µM z-VAD-FMK and 10 µM Smac mimetic for 30 minutes (min) and followed by 30 ng/mL TNFα for 4 h (TSZ) to induce necroptosis as a positive control. (K) Representative immunoblots of GSDMD, N-GSDMD, GSDME and N-GSDME in RAW264.7 cell lysates and analysis results (n = 5). Priming cells were transfected with 6 μg LPS for 16 h (LPS) to induce pyroptosis as a positive control. (L) Representative immunoblots of Casp11, Cl-Casp11 (cleaved-Casp11), Casp1 and Cl-Casp1 in RAW264.7 cell lysates and analysis results (n = 5). (M) IL-1α secretion and IL-1β secretion of RAW264.7 cells (n = 4). B was tested using a two-tailed Student's t-test; E, F, H, I, K, and L were tested using a One-way ANOVA test; J and M (IL-1α) were tested using a Welch's ANOVA test; D and M (IL-1β) were tested using a Kruskal Wallis test.
Figure 3
Figure 3
GA2 triggers primary macrophage pyroptosis in vitro, and induces macrophage pyroptosis at injured carotid artery in vivo. (A) Representative immunoblots of Casp11, Cl-Casp11, GSDME and N-GSDME in PMs and analysis results (n = 5). (B) IL-1α secretion of PMs (n = 6). (C) Representative immunoblots of Casp4, Cl-Casp4, GSDME and N-GSDME in HMDMs and analysis results (n = 6). Priming or non-priming cells were directly stimulated with 4 μg/mL GA2 for 24 h. Priming or non-priming cells stimulated with equimolar DMSO were set as a priming group or control group. (D) LDH release of HMDMs (n = 6). (E) Representative immunofluorescence staining sections from mice after 7 d of the injury for F4/80 (red) and N-GSDME (light gray) (n = 7). Nuclei were stained with DAPI (blue). Scale bars: 100 μm. (F) Representative immunofluorescence staining sections from mice after 7 d of the injury for IL-1α (green) and quantitative analysis. Nuclei were stained with DAPI (blue) (n = 7). Scale bars: 100 μm. A and D were tested using a One-way ANOVA test; B and C were tested using a Welch's ANOVA test; F was tested using a two-tailed Student's t-test.
Figure 4
Figure 4
Deletion of Casp11 blocks GA2-mediated GSDME activation and pyroptosis in macrophages. (A-B) LDH release (A) and cell death (B) of PMs (n = 6). PMs derived from Casp11-/- and WT mice were treated as indicated. Scale bars: 50 μm. (C) Representative immunoblots of Casp11, Cl-Casp11, GSDME and N-GSDME in PMs and analysis results (n = 6). (D) IL-1α secretion of PMs (n = 6). (E-F) LDH release (E) and cell death (F) of RAW264.7 cells (n = 4). Casp11-/- and NC (non-targeted control) RAW264.7 cells were treated as indicated. Scale bars: 50 μm. (G) Representative immunoblots of Casp11, Cl-Casp11, GSDME and N-GSDME in RAW264.7 cells and analysis results (n = 5). (H) IL-1α secretion of RAW264.7 cells (n = 4). A, E and G were tested using a One-way ANOVA test; B, C, D, F and H were tested using a Welch's ANOVA test.
Figure 5
Figure 5
GA2 binds to and activates Casp4. (A) Pull-down analysis the interaction between GA2 and Casp4 (n = 3). Lysates from HMDMs were incubated with GA2 or equimolar DMSO (vehicle) and then incubated with anti-GA2 antibody conjugated-magnetic-beads. Casp4 retained by the ligands and inputs were immunoblotted with antibodies against Casp4. (B) Pull-down analysis the interaction between GA2 and Casp4 (n = 3). Lysates from HEK293T cells overexpressing 3×Flag-Casp4 were incubated with GA2 or equimolar DMSO (vehicle) and then incubated with anti-GA2 antibody conjugated-magnetic-beads. Casp4 retained by the ligands and inputs were immunoblotted with antibodies against Casp4. (C-D) Representative immunoblots of Casp4 and Cl-Casp4 in HEK293T cell lysates and analysis results (n = 5). HEK293T cells transfected with 3×Flag-Casp4 for 40 h, and then transfected with 5 μg/mL GA2, 5 μg/mL LPS and equimolar DMSO (vehicle) for 10 h respectively. (E) Activities of recombinant Casp4 (n = 5). 5 μg GA2, 5 μg LPS or equimolar DMSO (vehicle) were incubated with 0.125 μM recombinant Casp4 proteins in a 100 μL reaction buffer for 30 min at room temperature, and then incubated with zVAD-AMC at a final concentration of 80 μM for 30min. (F-G) Representative immunoblots of Casp4 and Cl-Casp4 in HEK293T cell lysates and analysis results (n = 5). HEK293T cells transfected with 3×Flag-Casp4 for 40 h, and then transfected with 5 μg/mL ceramide residue (Cer), 5 μg/mL oligosaccharide headgroup (Oligo), 5 μg/mL GA2 or equimolar DMSO (vehicle) for 10 h respectively. (H) Activities of recombinant Casp4 (n = 5). 5 μg Cer, 5 μg Oligo, 5 μg GA2 or equimolar DMSO (vehicle) were used. D, E, G and H were tested using a One-way ANOVA test.
Figure 6
Figure 6
GA2 mediates Cytochrome C-Casp9-Casp3 pathway activation through Cl-Casp4/11 binding to and cleaving BID. (A) Representative immunoblots of Casp8, Cl-Casp8, Casp9, Cl-Casp9, Casp3 and Cl-Casp3 in PMs and analysis results (n = 5). (B) Representative immunoblots of cytochrome C (Cyt C) in PM cytosol (Cyto) and mitochondrion (Mito) and analysis results (n = 5). (C) Representative immunoblots of BID, tBID (truncated BID), BIM and PUMA in PMs and analysis results (n = 5). (D-E) Coimmunoprecipitation (Co-IP) of activated Casp4 binds to BID in HEK293T cells (n = 3). HEK293T cells were transfected with the indicated plasmids for 24 h and the lysates incubated with anti-Flag-magnetic-beads, then immunoblotted with antibodies against Flag or HA. (F) Representative immunoblots of BID, tBID, Casp3, and Cl-Casp3 in PMs and analysis results (n = 6). (G) Representative immunoblots of BID, tBID, Casp3, and Cl-Casp3 in RAW264.7 cells and analysis results (n = 5). (H) Representative immunofluorescence staining sections from mice after 7 d of the injury for BID (light gray), F4/80 (green), and Casp11 (red) (n = 7). Nuclei were stained with DAPI (blue). Scale bars: 100 μm. A, B, C, F (tBID) and G (tBID) were tested using a One-way ANOVA test; F (Cl-Casp3) and G (Cl-Casp3) were tested using a Welch's ANOVA test.
Figure 7
Figure 7
The Knock-down of BID and pharmacological inhibition of Bax/Bak prevents macrophage pyroptosis. (A) Representative immunoblots and analysis results of Cyt C in cytosol (Cyto), BID, tBID, Casp9, Cl-Casp9, Casp3, Cl-Casp3, GSDME, and N-GSDME in whole cell lysates (WCL) (n = 5). RAW264.7 cells were transfected with siBID (siRNAs targeting BID) or siCtr for 30 h, and then treated as indicated. (B) Cell death of RAW264.7 cells (n = 3). Scale bars: 50 μm. (C) LDH release of RAW264.7 cells (n = 5). (D) IL-1α secretion of RAW264.7 cells (n = 4). (E) Cell death of RAW264.7 cells (n = 3). Cells were primed or not primed with 100 ng/mL LPS for 6 h, and pretreated with 1 μM VBIT-4, 1 μM MSN-125 or equimolar DMSO (vehicle) for 30 min, and then treated as indicated. (F) LDH release of RAW264.7 cells (n = 5). (G) Representative immunoblots and and analysis results of Cyt C in Cyto, Casp9, Cl-Casp9, Casp3, Cl-Casp3, GSDME, and N-GSDME in WCL (n = 3). A (Cyt C and Cl-Casp3), B, C, D, E, F and G were tested using a One-way ANOVA test; A (Cl-Casp9 and N-GSDME) were tested using a Welch's ANOVA test.
Figure 8
Figure 8
Transplanted with Casp11-/- bone marrow or specific knockdown of Casp11 in bone marrow-derived macrophages protects against ganglioside GA2-induced exacerbation of IH. (A) Experimental design for bone marrow transplantation and intervention. (B) Immunoblots for analyzing the Casp11 expression of bone marrow-derived myeloid cells from chimeric mice. WT mice were transplanted with Casp11-/- (Casp11-/--WT) or WT (WT-WT) bone marrow. (C) Representative immunofluorescence staining sections from mice after 7 d of the injury for F4/80 (red) and N-GSDME (light gray) (n = 6). Nuclei were stained with DAPI (blue). Scale bars: 100 μm. (D-E) Representative immunofluorescence staining sections from mice after 7 d of the injury for IL-1α (green) and quantitative analysis. Nuclei were stained with DAPI (blue) (n = 6). Scale bars: 100 μm. (F-G) Representative HE-stained sections from mice after 28 d of the injury, and analysis results of intima area, lumen area, media area, and intima/media area ratio (n = 7). Scale bars: 100 μm. (H) Experimental design for bone marrow macrophage specific Casp11-knockdown and intervention. (I) RT-qPCR analysis of Casp11 mRNA expression in Cd45+F4/80+ cells and Cd45+F4/80- cells from mice (n = 5). Single-cell suspensions isolated from bone marrow cells (BMC) and Peripheral blood mononuclear cells (PBMC) of mice. WT mice were treated either with vehicle or GA2 through tail intravenous injection one day before surgery and every other day after surgery for 7 d among AAV-F4/80-NC group (AAV-F4/80-NC-GA2) and AAV-F4/80-Casp11 group (AAV-F4/80-Casp11-GA2). (J) Representative immunofluorescence staining sections from AAV-F4/80-NC-GA2 and AAV-F4/80-Casp11-GA2 after 7 d of the injury for F4/80 (red) and N-GSDME (light gray) (n = 6). Nuclei were stained with DAPI (blue). Scale bars: 100 μm. (K-L) Representative immunofluorescence staining sections from mice after 7 d of the injury for IL-1α (green) and quantitative analysis. Nuclei were stained with DAPI (blue) (n = 6). Scale bars: 100 μm. (M-N) Representative HE-stained sections from mice after 28 d of the injury, and analysis results of intima area, lumen area, media area, and intima/media area ratio among AAV-F4/80-NC-GA2 and AAV-F4/80-Caspase11-GA2 groups (n = 6). Scale bars: 100 μm. E, G (Media), I, L and N were tested using a two-tailed Student's t-test; G (Intima and Intima/media) were tested using a two-tailed Welch's t-test; G (Lemun) was tested using a two-tailed Mann-Whitney U test.

Similar articles

Cited by

References

    1. Breiden B, Sandhoff K. Lysosomal Glycosphingolipid Storage Diseases. Annual review of biochemistry. 2019;88:461–85. - PubMed
    1. Mukhin DN, Prokazova NV, Bergelson LD, Orekhov AN. Ganglioside content and composition of cells from normal and atherosclerotic human aorta. Atherosclerosis. 1989;78:39–45. - PubMed
    1. Mukhin DN, Chao FF, Kruth HS. Glycosphingolipid accumulation in the aortic wall is another feature of human atherosclerosis. Arteriosclerosis, thrombosis, and vascular biology. 1995;15:1607–15. - PubMed
    1. Garner B, Priestman DA, Stocker R, Harvey DJ, Butters TD, Platt FM. Increased glycosphingolipid levels in serum and aortae of apolipoprotein E gene knockout mice. Journal of lipid research. 2002;43:205–14. - PubMed
    1. Galis ZS, Muszynski M, Sukhova GK, Simon-Morrissey E, Libby P. Enhanced expression of vascular matrix metalloproteinases induced in vitro by cytokines and in regions of human atherosclerotic lesions. Annals of the New York Academy of Sciences. 1995;748:501–7. - PubMed

Publication types

MeSH terms