. 2025 Jan 1;21(1):363-381.
doi: 10.7150/ijbs.102744. eCollection 2025.

Quantitative Histopathology Analysis Based on Label-free Multiphoton Imaging for Breast Cancer Diagnosis and Neoadjuvant Immunotherapy Response Assessment

Affiliations

Quantitative Histopathology Analysis Based on Label-free Multiphoton Imaging for Breast Cancer Diagnosis and Neoadjuvant Immunotherapy Response Assessment

Ruiqi Zhong et al. Int J Biol Sci. .

Abstract

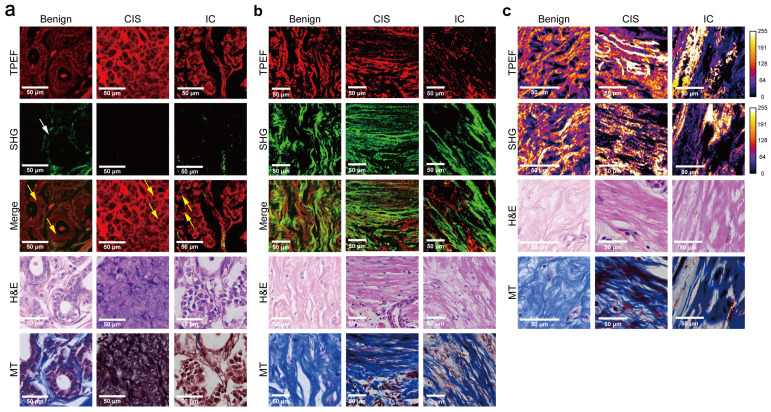
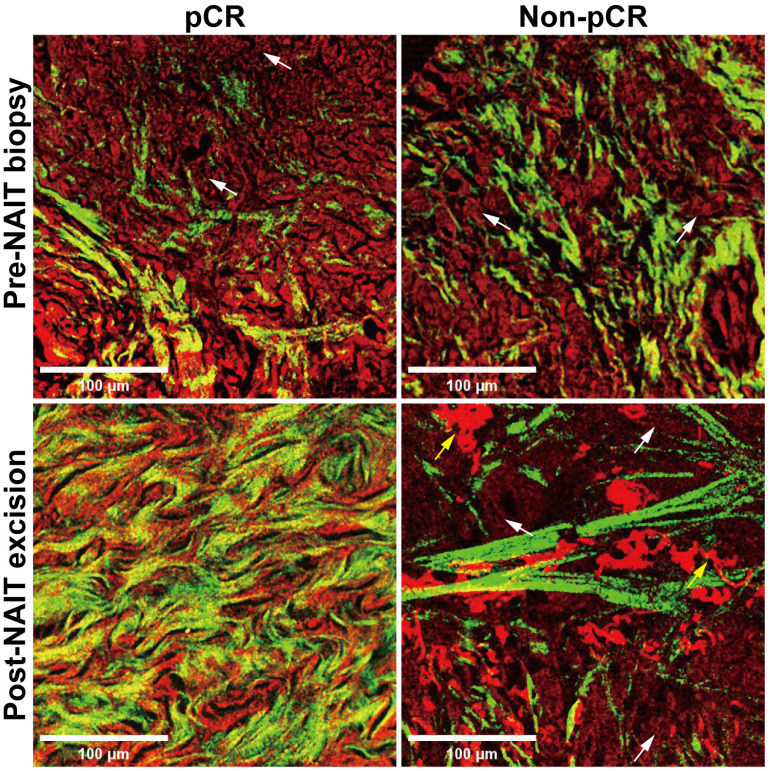
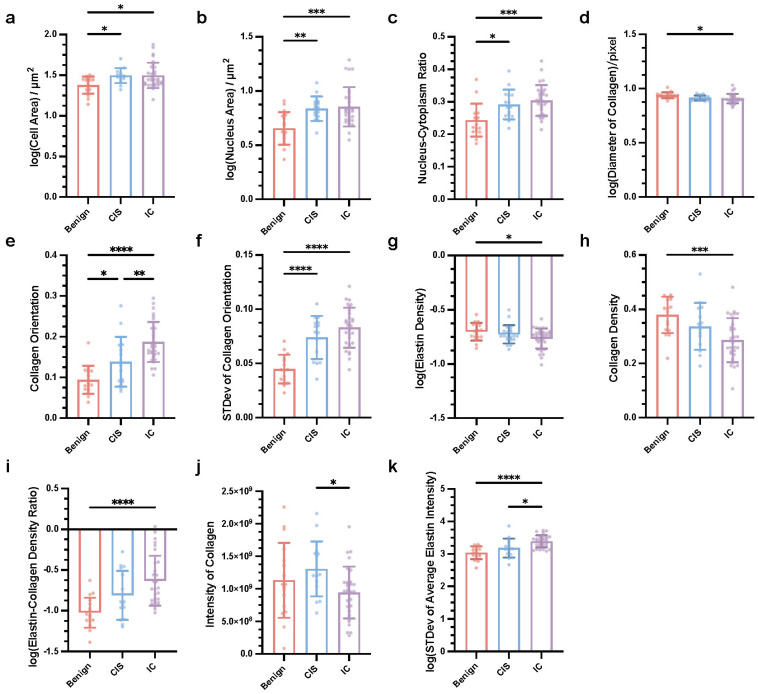
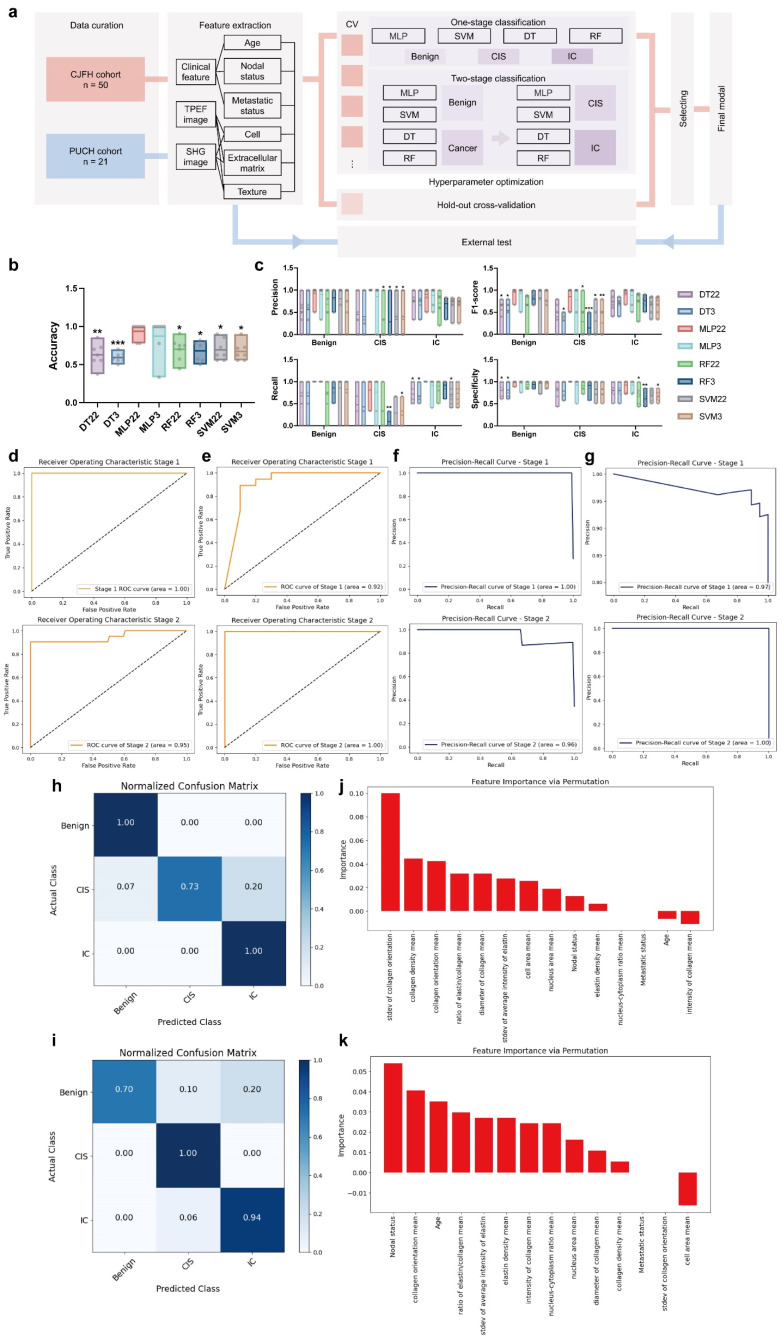
Accurate diagnosis and assessment of breast cancer treatment responses are critical challenges in clinical practice, influencing patient treatment strategies and ultimately long-term prognosis. Currently, diagnosing breast cancer and evaluating the efficacy of neoadjuvant immunotherapy (NAIT) primarily rely on pathological identification of tumor cell morphology, count, and arrangement. However, when tumors are small, the tumors and tumor beds are difficult to detect; relying solely on tumor cell identification may lead to false negatives. In this study, we used the label-free multiphoton microscopy (MPM) method to quantitatively analyze breast tissue at the cellular, extracellular, and textural levels, and identified 11 key factors that can effectively distinguish different types of breast diseases. Key factors and clinical data are used to train a two-stage machine learning automatic diagnosis model, MINT, to accurately diagnose breast cancer. The classification capability of MINT was validated in independent cohorts (stage 1 AUC = 0.92; stage 2 AUC = 1.00). Furthermore, we also found that some factors could predict and assess the efficacy of NAIT, demonstrating the potential of label-free MPM in breast cancer diagnosis and treatment. We envision that in the future, label-free MPM can be used to complement stromal and textural information in pathological tissue, benefiting breast cancer diagnosis and neoadjuvant therapy efficacy prediction, thereby assisting clinicians in formulating personalized treatment plans.

Keywords: breast cancer; extracellular matrix; label-free multiphoton imaging; neoadjuvant immunotherapy; quantitative analysis; texture.


Conflict of interest statement

Competing Interests: The authors have declared that no competing interest exists.

Figures

Figure 1
Figure 1
Comparison of representative label-free MPM images of different breast tissue samples. Cellular (a), extracellular (b) morphology and texture feature (c) of benign breast lesion, CIS, and IC. Each column represents the corresponding position of the same tissue. The heatmaps for the TPEF and SHG channels are obtained after converting the images to 8-bit for analysis. Benign, benign breast lesion; Merge, the merge image of TPEF and SHG channel. White arrow: complete basement membrane. Yellow arrow: the black rounded area with no signal represents the nuclei. Scale bar, 50 μm.
Figure 2
Figure 2
Morphological changes before and after neoadjuvant immunotherapy in label-free MPM images. NAIT, neoadjuvant immunotherapy; pCR, pathological complete response. White arrow: tumor cells. Yellow arrow: fractured elastic fibers. Scale bar, 100 μm.
Figure 3
Figure 3
Key quantitative factors for breast cancer diagnosis in label-free MPM Images. Mean of cell area (a), nucleus area (b), and nucleus-cytoplasm ratio (c), diameter of collagen (d), collagen orientation (e), elastin density (g), collagen density (h), elastic-collagen density ratio (i), intensity of collagen (j), standard deviation of collagen orientation (f) and average elastin intensity were significantly different in three types of breast lesions. nBenign=17, nCIS=15, nIC=30, n refers to the number of slices. STDev, standard deviation. Data are represented as the means ± SD. If the data conforms to a Gaussian distribution, one-way ANOVA with Tukey's test for multiple comparisons in benign breast lesions, CIS and IC; otherwise, Kruskal-Wallis test with Dunn's multiple comparisons test was applied. Significance levels are indicated as follows: *P < 0.05, **P < 0.01, ***P < 0.001, ****P < 0.0001.
Figure 4
Figure 4
Training, cross-validation and testing of MINT. (a) Schematic of the machine learning framework. CV, cross validation; DT, decision-tree; SVM, support vector machine; RF random forest; MLP, multi-layer perceptron. Distribution of each modal's accuracy (b), precision, recall, F1-score, specificity (c). n=7 models were trained during 7-fold cross-validation per group. One-way ANOVA with Dunnett's test was used to carry out multiple comparisons test of MLP22 versus other models. Significance levels are indicated as follows: *P < 0.05, **P < 0.01, ***P < 0.001, ****P < 0.0001. The minimum, maximum, mean, as well as each sample point, are shown. Receiver operating characteristics curves of the CJFH cohort (d) and PUCH cohort (e). As for CJFH cohort, the mean of 7-fold cross-validation is shown. Precision-recall curves of the CJFH cohort (f) and PUCH cohort (g). As for CJFH cohort, the mean of 7-fold cross-validation is shown. Confusion matrices of CJFH cohort (h) and PUCH cohort (i) showing the predictions and actual classification of the slices. Data is shown in normalized version. Permutation importance analysis of stage 1 (j) and stage 2 (h). The importance of the features decreases from left to right.
Figure 5
Figure 5
Dynamic changes in key label-free MPM factors pre- and post-neoadjuvant immunotherapy in patients with breast cancer. Dynamic changes of mean of nucleus area (a), mean of collagen orientation (b), standard deviation of collagen orientation (c), mean of elastin density (d), mean of collagen density (e), mean of intensity of collagen (f) pre- and post-NAIT in breast cancer patients, stratified by pCR or non-pCR. The blue points indicated the dynamic changes of patients who achieved pCR in NAIT; the red points indicated the dynamic changes of patients who did not achieve pCR in NAIT. npCR=10, nNon-pCR=16, n refers to the number of slices. Outliers were removed using the ROUT method with an aggressive Q=1%. If the data followed a Gaussian distribution, paired t-test was used to analyze the significance of dynamic changes of each factor pre- and post-treatment; otherwise, Wilcoxon matched-pairs signed rank test was applied. Significance levels are indicated as follows: *P < 0.05, **P < 0.01, ***P < 0.001, ****P < 0.0001.
Figure 6
Figure 6
Label-free MPM factors predict the efficacy of neoadjuvant immunotherapy. (a) The levels of mean of average elastin intensity were significantly different between pCR and non-pCR patients. (b) The levels of standard deviation of elastin intensity were significantly different between responders and non-responders. R, responder; Non-R, non-responder. (c) The levels of mean of average elastin intensity and standard deviation of elastin intensity were significantly different between patients with MP grade 4 or 5 and patients with MP grade 1 to 3. (d&e) Correlation analysis of the baseline level of standard deviation of elastin intensity or mean of average elastin intensity, and responses of patient with breast cancer to NAIT. R, responder, including patients diagnosed with a CR (complete response) and PR (partial response) after treatment; Non-R, non-responder, including patients diagnosed with an SD (stable disease) and PD (progressive disease) after treatment. npCR=10, nNon-pCR=16, nMP4/5=17, nMP1/2/3=9, nR=20, nNon-R=6, n refers to the number of slices. Outliers were removed using the ROUT method with an aggressive Q=1%. Data are represented as the means ± SD. If the data followed a Gaussian distribution, unpaired t test with Welch's correction was used to compare the difference between two groups; otherwise, Mann-Whitney test was applied. Significance levels are indicated as follows: *P < 0.05, **P < 0.01, ***P < 0.001, ****P < 0.0001.
Figure 7
Figure 7
Label-free MPM imaging in fresh breast tissues. (a) Representative Label-free MPM images of fresh breast tissue. The dashed rectangle highlights diagnostically significant structures in different breast diseases. Specifically, normal tissue exhibited intact lobular architecture, whereas CIS displays tumor tissue fully encapsulated by collagen fibers. However, tumor cells in IDC and ILC infiltrated into the surrounding stroma. The grid-like lines in the image are caused by the “screen door effect” in image stitching in large-field MPM imaging. (b) Stereoscopic imaging of microinvasive breast cancer, with adjacent images spaced 5-10 μm apart along the z-axis. White arrows indicate the progression of the basement membrane from intact to disintegration. IDC, invasive ductal carcinoma; ILC, invasive lobular carcinoma.

Similar articles

Cited by

References

    1. Elston CW, Ellis IO. Pathological prognostic factors in breast cancer. I. The value of histological grade in breast cancer: experience from a large study with long-term follow-up. Histopathology. 1991;19:403–10. - PubMed
    1. Bloom HJ, Richardson WW. Histological grading and prognosis in breast cancer; a study of 1409 cases of which 359 have been followed for 15 years. Br J Cancer. 1957;11:359–77. - PMC - PubMed
    1. Tan PH, Ellis I, Allison K, Brogi E, Fox SB, Lakhani S. et al. The 2019 World Health Organization classification of tumours of the breast. Histopathology. 2020;77:181–5. - PubMed
    1. WHO Classification of Tumours Editorial Board. Classification of Breast Tumours, 5th edn. Lyon: IARC Press. 2019.
    1. See SHC, Siziopikou KP. Pathologic evaluation of specimens after neoadjuvant chemotherapy in breast cancer: Current recommendations and challenges. Pathol Res Pract. 2022;230:153753. - PubMed