

Association between waist-to-height ratio and osteoporosis in the National Health and Nutrition Examination Survey: a cross-sectional study
- PMID: 39744530
- PMCID: PMC11688312
- DOI: 10.3389/fmed.2024.1486611
Association between waist-to-height ratio and osteoporosis in the National Health and Nutrition Examination Survey: a cross-sectional study
Abstract
Background: The link between waist-to-height ratio (WHtR) and osteoporosis (OP) remains a contentious issue in the field of medical research. Currently, the available evidence on this association is deemed insufficient. This topic has garnered significant attention and is a focal point of ongoing investigations.
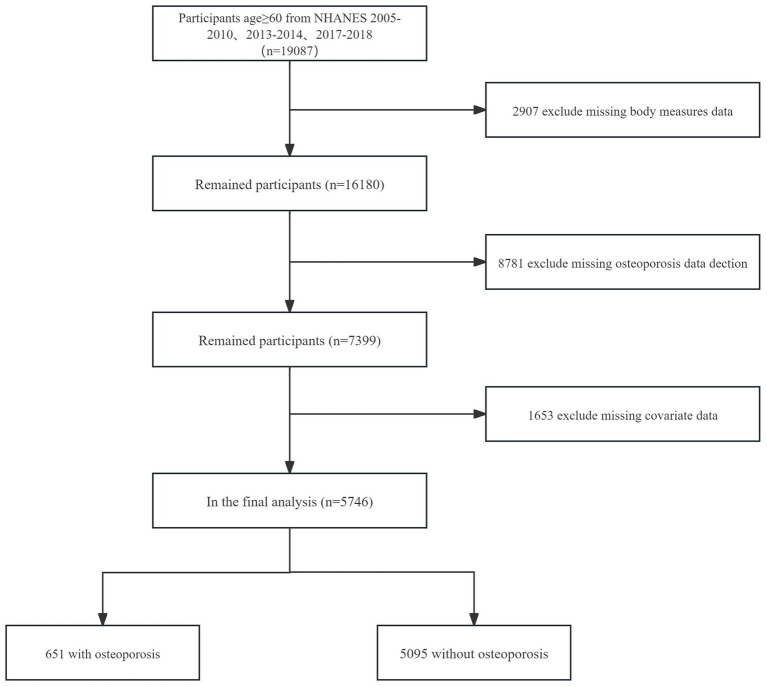
Methods: A retrospective cross-sectional study was conducted, involving 5,746 participants from the National Health and Nutrition Examination Survey. Data on various demographic and clinical parameters, including age, gender, race, poverty income ratio, educational level, smoking status, drinking status, cardiovascular disease, hypertension, diabetes mellitus, hemoglobin A1c, alanine transaminase, aspartate transaminase, serum total bilirubin, serum creatinine, uric acid, blood urea nitrogen, serum sodium, serum phosphorus, total calcium, serum potassium, and serum iron, were collected from all participants. The main analytical methods utilized in this study were multivariable logistic regression, restricted cubic splines, and threshold effect analysis to investigate the association between WHtR and OP.
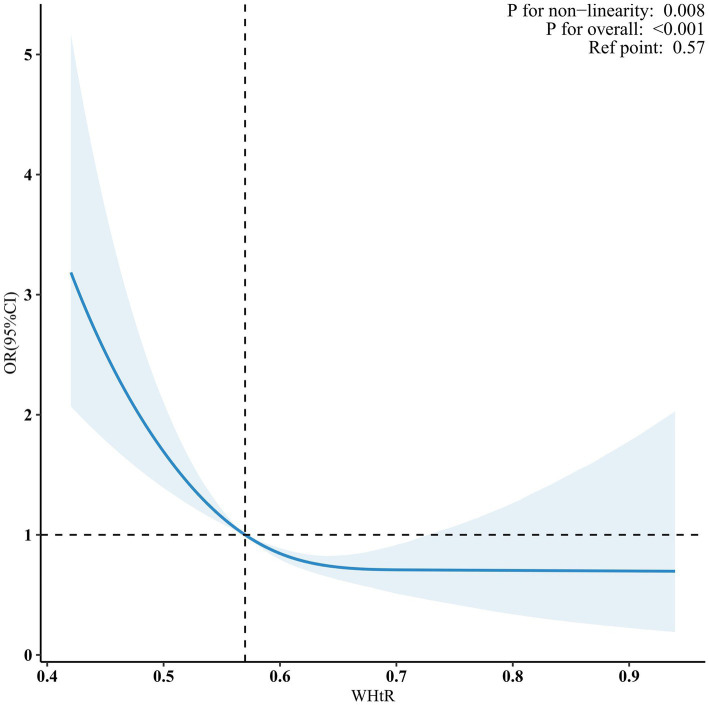
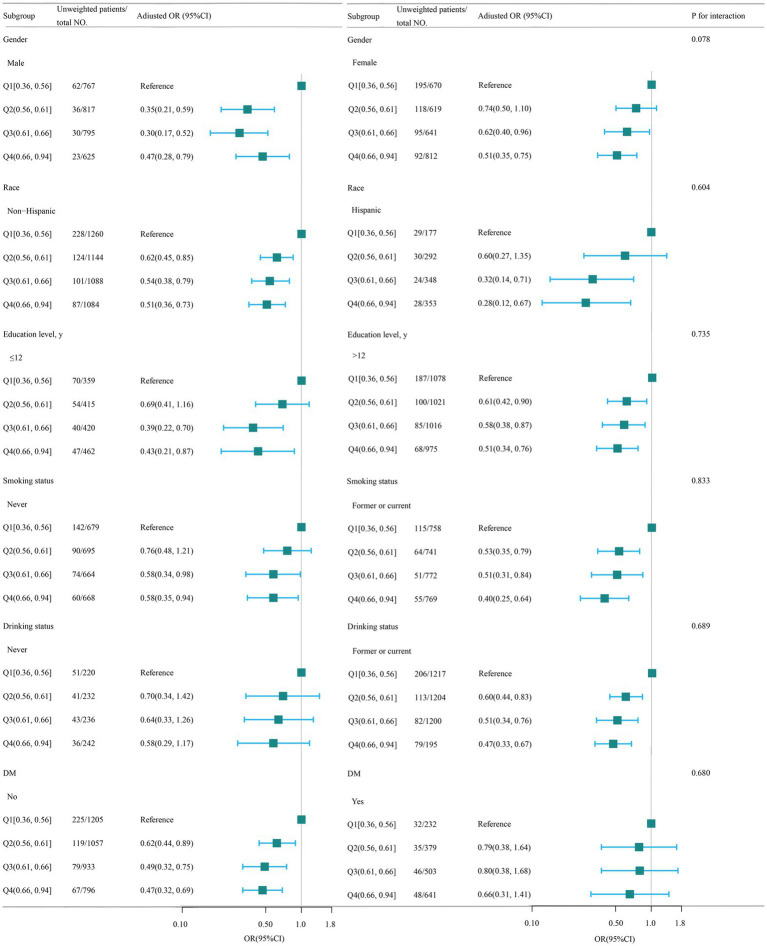
Results: A total of 5,746 elderly participants were enrolled, with a median age of 69.3 years. Compared with individuals with lower WHtR Q1 (≤0.36 to ≤0.56), the adjusted OR values for WHtR and OP in Q2 (<0.56 to ≤0.61), Q3 (<0.61 to ≤0.66), and Q4 (<0.66 to ≤ 0.94) were 0.63 (95% CI: 0.47-0.85, p = 0.003), 0.53 (95% CI: 0.37-0.76, p < 0.001), and 0.49 (95% CI: 0.35-0.68, p < 0.001), respectively. The association between WHtR and OP exhibited an L-shaped curve (nonlinear, p = 0.008) with an inflection point of roughly 0.57. The OR for the presence of OP was 0.50 (95% CI: 0.31-0.82, p = 0.007) in participants with WHtR <0.57. There was no association between WHtR and OP in participants with WHtR ≥0.57.
Conclusion: The association between WHtR and OP showed an L-shaped curve, with an inflection point at around 0.57.
Keywords: NHANES; cross-sectional study; elderly people; osteoporosis; waist-to-height ratio.
Copyright © 2024 Li, Qiu, Gao, Li and Chu.
Conflict of interest statement
The authors declare that the research was conducted in the absence of any commercial or financial relationships that could be construed as a potential conflict of interest.
Figures
Similar articles
-
Association between triglyceride glucose-waist height ratio index and overactive bladder: based on NHANES 2005-2018.Front Endocrinol (Lausanne). 2025 Apr 15;16:1541218. doi: 10.3389/fendo.2025.1541218. eCollection 2025. Front Endocrinol (Lausanne). 2025. PMID: 40303634 Free PMC article.
-
Association of triglyceride glucose-related obesity indices with sarcopenia among U.S. adults: a cross-sectional study from the National Health and Nutrition Examination Survey.Sci Rep. 2025 Jan 2;15(1):574. doi: 10.1038/s41598-024-84278-3. Sci Rep. 2025. PMID: 39747346 Free PMC article.
-
Association between triglyceride glucose index and hyperuricemia: a new evidence from China and the United States.Front Endocrinol (Lausanne). 2024 Jul 1;15:1403858. doi: 10.3389/fendo.2024.1403858. eCollection 2024. Front Endocrinol (Lausanne). 2024. PMID: 39010899 Free PMC article.
-
Anthropometric indicators and cardiovascular diseases risk in pre-diabetic and diabetic adults: NHANES 1999-2018 cross-sectional analysis.Exp Gerontol. 2024 Sep;194:112516. doi: 10.1016/j.exger.2024.112516. Epub 2024 Jul 10. Exp Gerontol. 2024. PMID: 38977206
-
Predicting cardiometabolic risk: waist-to-height ratio or BMI. A meta-analysis.Diabetes Metab Syndr Obes. 2013 Oct 24;6:403-19. doi: 10.2147/DMSO.S34220. Diabetes Metab Syndr Obes. 2013. PMID: 24179379 Free PMC article. Review.
References
-
- Mills ES, Hah RJ, Fresquez Z, Mertz K, Buser Z, Alluri RK, et al. . Secondary fracture rate after vertebral osteoporotic compression fracture is decreased by anti-osteoporotic medication but not increased by cement augmentation. J Bone Joint Surg Am. (2022) 104:2178–85. doi: 10.2106/JBJS.22.00469, PMID: - DOI - PubMed
LinkOut - more resources
Full Text Sources
Medical
Miscellaneous