. 2024 Dec 18:15:1483182.
doi: 10.3389/fimmu.2024.1483182. eCollection 2024.

Anti-PD1 therapies induce an early expansion of Ki67+CD8+ T cells in metastatic non-oncogene addicted NSCLC patients

Affiliations

Anti-PD1 therapies induce an early expansion of Ki67+CD8+ T cells in metastatic non-oncogene addicted NSCLC patients

Alain Gelibter et al. Front Immunol. .

Abstract

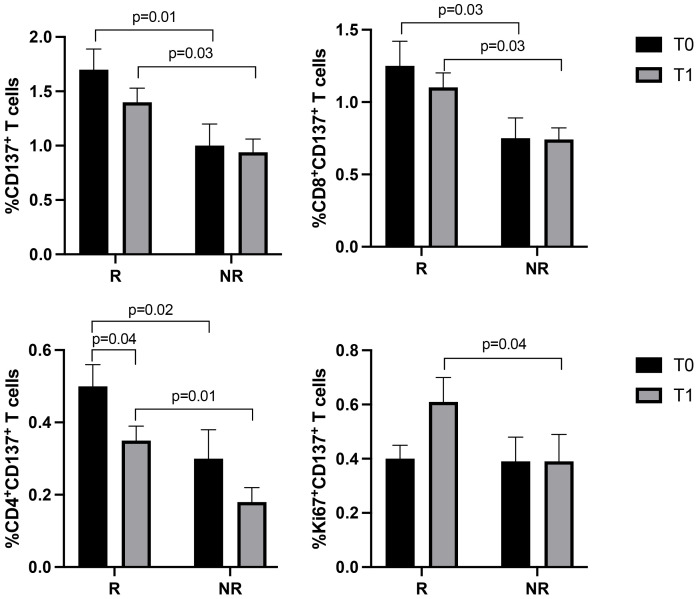
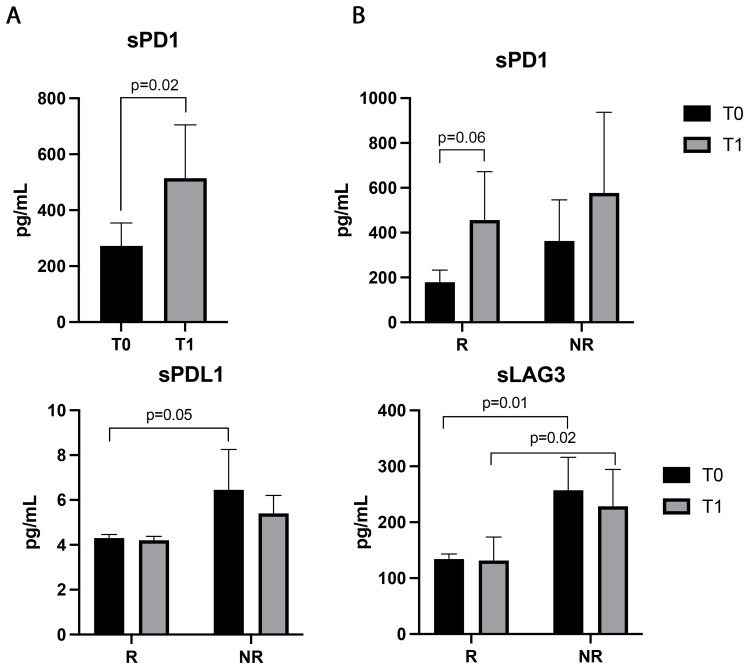
Pembrolizumab (an anti-PD1 antibody) alone or combined with chemotherapy represented the standard of care for advanced non-oncogene addicted non-small cell lung cancer (NSCLC) patients. These therapies induced early modifications of the immune response impacting the clinical outcome. Identifying early changes in the immune system was critical to directing the therapeutic choice and improving the clinical outcome. In this study, we aim to analyze the activating and inhibiting immune cells of NSCLC patients before and during therapy to identify patients who will benefit from immunotherapies. Forty-eight NSCLC patients were analyzed before (T0) and after the first cycle of immunotherapy (T1), evaluating several activating (CD137+and PD1+), proliferating (Ki67+) and immunosuppressing immune subsets (Tregs: total, active, resting, and non-suppressive; MDSCs: PMN(Lox1+)-MDSC and M-MDSCs) by cytofluorimetry. Concurrently, 14 soluble immune checkpoints were analyzed by Luminex assay. Immunotherapy significantly increased the levels of Ki67+(total and CD8+) T cells, PMN(Lox1+)-MDSCs, non-suppressive Tregs (nsTregs), and soluble PD1 from T0 to T1 in the entire NSCLC population, while decreased active Tregs. These changes were partially attributed to responding patients who showed an increase of Ki67+ and CD8+T cells and nsTregs at T1. CD137+(total, CD8+, and CD4+) T cells and soluble LAG3 were predictor factors at T0 and T1. A low ratio of Tregs/CD137+ T cells and high levels of Ki67+CD137+ T cells positively correlated with response to therapy at T0 and T1, respectively. Results highlighted that immunotherapy improved the immunological fitness of those patients who benefited from immunotherapy, changing the immunological balance towards immune activation.

Keywords: CD137; NSCLC; anti-PD-1; immune checkpoint inhibitors; lymphocytes.


Conflict of interest statement

MS reports travel grants from Novartis grants and speaker’s honoraria. AG received speaker’s honoraria from and participated on the advisory board from AstraZeneca, MSD, Roche, BMS, Takeda. The remaining authors declare that the research was conducted in the absence of any commercial or financial relationships that could be construed as a potential conflict of interest.

Figures

Figure 1
Figure 1
Modulation of CD3+, CD137+, PD1+, and Ki67+ T cell subsets during ICIs in 48 NSCLC patients evaluated by cytofluorimetry. The scattered dot plots display the values of CD3+ (total, CD8+, and CD4+) (top, left), CD137+ (total, CD8+, and CD4+) (lower, left), PD1+ (total, CD8+, and CD4+) (top, right) and Ki67+ (total, CD8+, and CD4+) (lower, right) T cells before (T0) and after the first cycle of therapy (T1). The horizontal lines correspond to the median values of the percentage of each T cell subset at T0 and T1. p values <0.05 were considered significant.
Figure 2
Figure 2
CD3+, Ki67+, CD8+, and CD4+ T cell subsets evaluated before and during therapy in responding and non-responding patients. The histograms represent the median values of the percentage CD3+, Ki67+, CD8+, and CD4+ T cell subsets in 32 responders (upper) and 16 non-responders (lower). The black histograms correspond to the values analyzed at baseline (T0) and the grey histograms correspond to the values analyzed after the first cycle of ICIs (T1) ± SEM. p values <0.05 were considered significant.
Figure 3
Figure 3
CD137+ (total, CD8+, CD4+, and Ki67+) T cell subsets evaluated by cytofluorimetry before and during therapy in responders and non-responders. The histograms represent the median values of the percentage CD137+ (total, CD8+, CD4+, and Ki67+) T cell subsets in responders (R) and non-responders (NR). The black histograms correspond to the values analyzed at baseline (T0) and the grey histograms correspond to the values analyzed after the first cycle of ICIs (T1) ± SEM. p values <0.05 were considered significant.
Figure 4
Figure 4
Treg and MDSC modulation evaluated in 48 NSCLC patients during immunotherapy. (A) The scattered dot plots display the values of the percentage of non-suppressive (upper), and active (lower) Tregs in NSCLC patients under ICIs before (T0) and after the first cycle of treatment (T1). The histograms showed the median levels of the percentage of non-suppressive and active Tregs at T0 (black histograms) and T1 (gray histograms) ± SEM. (B) Histograms showed the percentage of PMN(Lox1+)-MDSCs and M-MDSCs evaluated at T0 (black histograms) and T1 (gray histograms) ± SEM. (C) Histogram represented the %active Treg/%CD137+ T cells ratio in responders and non-responders. The black histograms display the median value of the ratio at T0, and the gray histogram is the ratio median value at T1± SEM. p values <0.05 were considered significant.
Figure 5
Figure 5
Soluble PD1, LAG3, and PDL1 evaluated in the sera of 48 NSCLC patients before and during immunotherapy. (A) Histograms represent the median values of the concentrations (pg/mL) of soluble PD1 before (T0, black histograms) and after the first cycle of ICIs (T1, gray histograms) ± SEM. (B) Histograms represent the median values of the concentrations (pg/mL) of soluble PD1, PDL1and LAG3 analyzed in responders (R) and non-responders (NR), before (T0, black histograms) and after the first cycle of immunotherapy (T1, gray histograms) ± SEM. B) p values <0.05 were considered significant.

Similar articles

Cited by

References

    1. Bade BC, Dela Cruz CS. Lung cancer 2020: epidemiology, etiology and prevention. Clin Chest. Med. (2020) 41:1–24. doi: 10.1016/j.ccm.2019.10.001 - DOI - PubMed
    1. Hodi FS, O'Day SJ, McDermott DF, Weber RW, Sosman JA, Haanen JB, et al. . Improved survival with ipilimumab in patients with metastatic melanoma. N Engl J Med. (2010) 363:711–23. doi: 10.1056/nejmoa1003466 - DOI - PMC - PubMed
    1. Naimi A, Mohammed RN, Raji A, Chupradit S, Yumashev AV, Suksatan W, et al. . Tumor immunotherapies by immune checkpoint inhibitors (ICIs); the pros and cons. Cell Commun Signal. (2022) 20:44. doi: 10.1186/s12964-022-00854-y - DOI - PMC - PubMed
    1. Sezer A, Kilickap S, Gümüş M, Bondarenko I, Özgüroğlu M, Gogishvili M, et al. . Cemiplimab monotherapy for first-line treatment of advanced non-small-cell lung cancer with PD-L1 of at least 50%: a multicentre, open-label, global, phase 3, randomised, controlled trial. Lancet. (2021) 397:592–604. doi: 10.1016/s0140-6736(21)00228-2 - DOI - PubMed
    1. Gandhi L, Rodríguez-Abreu D, Gadgeel S, Esteban E, Felip E, De Angelis F, et al. . Pembrolizumab plus chemotherapy in metastatic non-small-cell lung cancer. N Engl J Med. (2018) 378:2078–92. doi: 10.1056/nejmoa1801005 - DOI - PubMed

MeSH terms