. 2025 Jan 1;15(2):726-744.
doi: 10.7150/thno.100638. eCollection 2025.

S100A proteins show a spatial distribution of inflammation associated with the glioblastoma microenvironment architecture

Affiliations

S100A proteins show a spatial distribution of inflammation associated with the glioblastoma microenvironment architecture

Blanca Cómitre-Mariano et al. Theranostics. .

Abstract

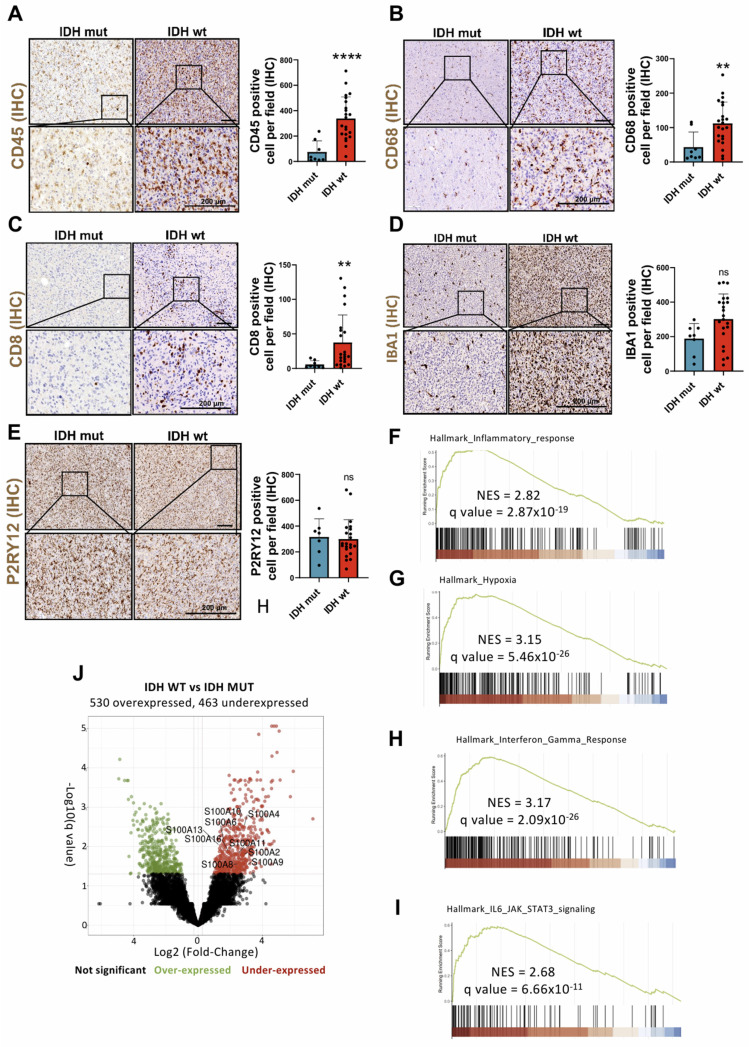
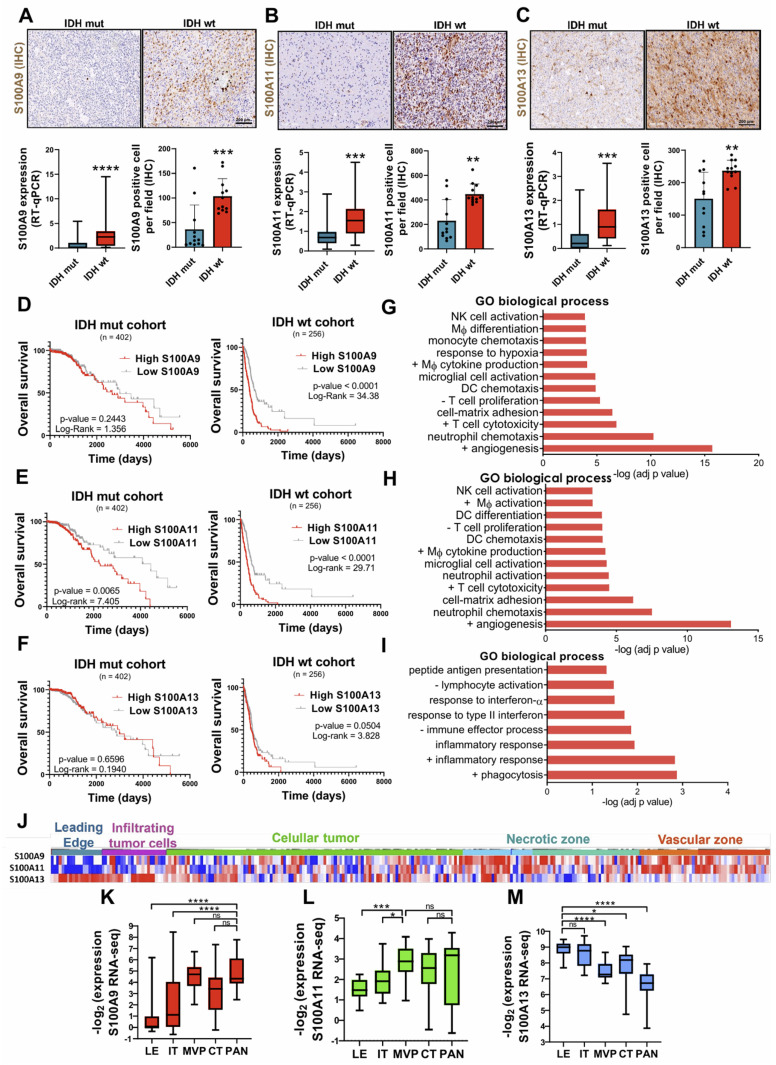
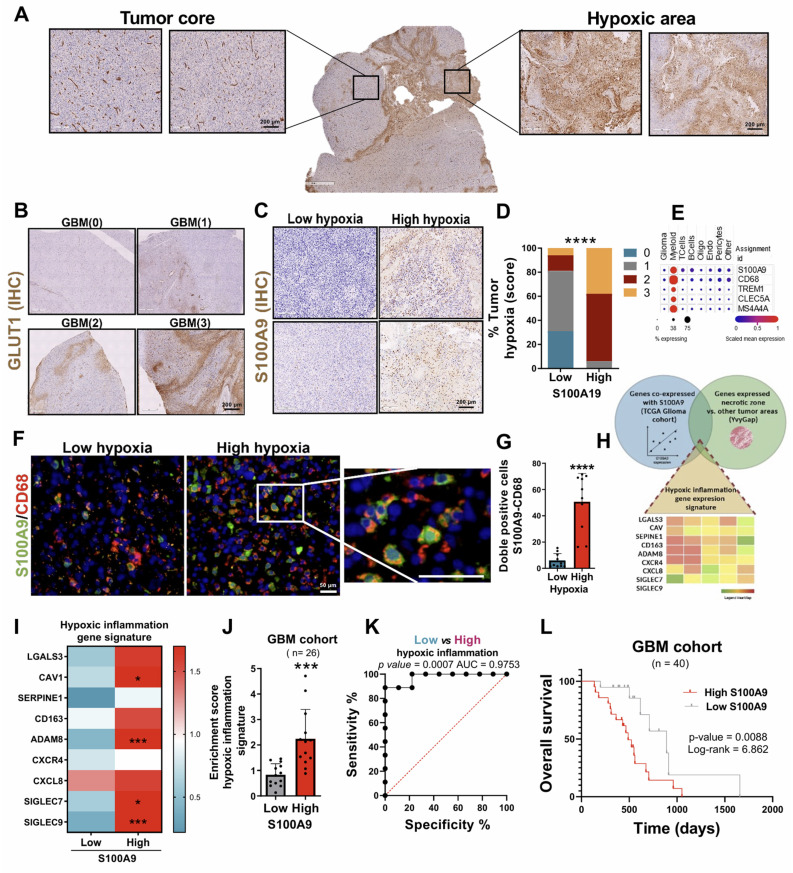
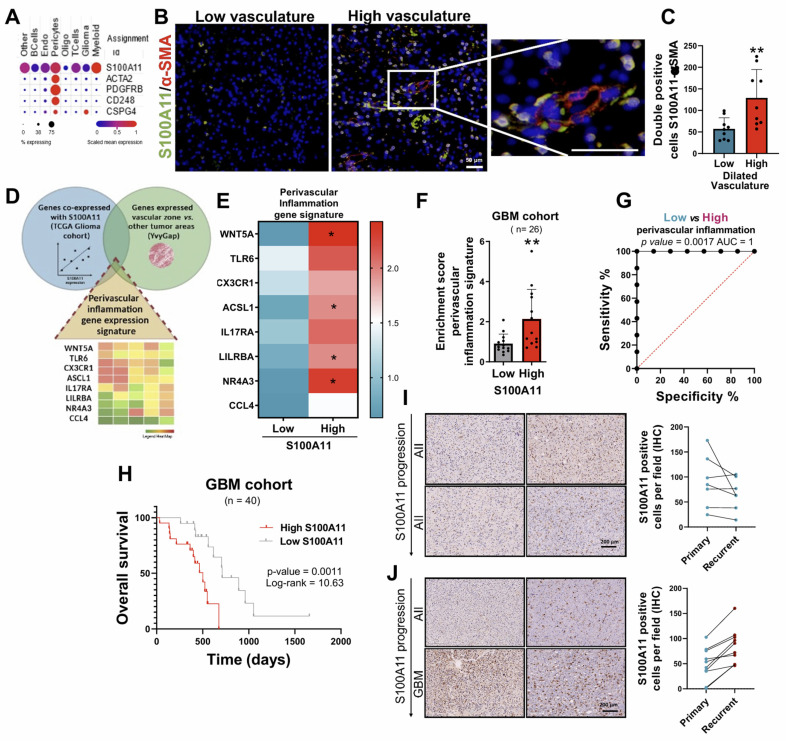
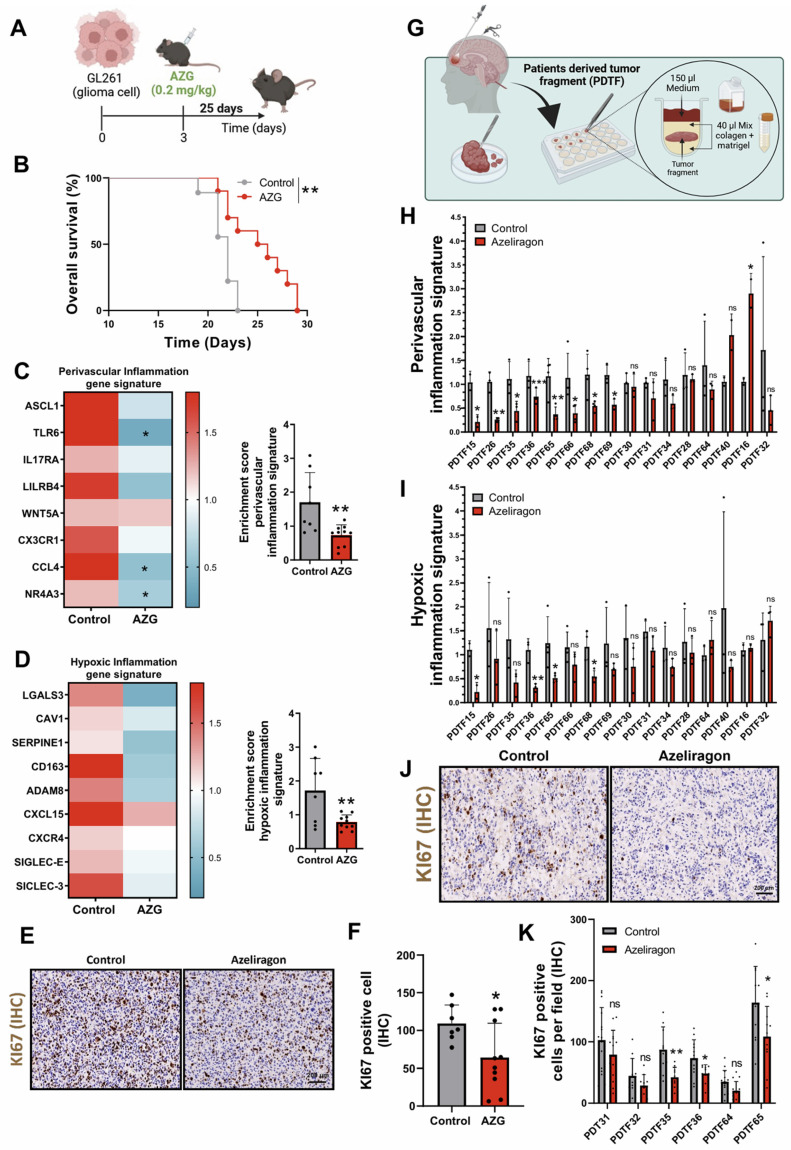
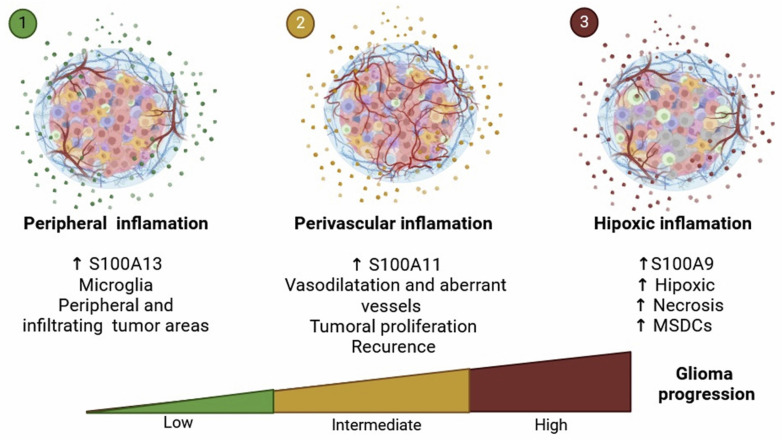
Background: Glioblastoma IDH wild type (GBM IDH wt) has a poor prognosis and a strongly associated with inflammatory processes. Inflammatory molecules generate positive feedback with tumor cells fueling tumor growth as well as recruitment of immune cells that promote aggressiveness. Although the role of many inflammatory molecules is well known, there are many macromolecules, such as the S100A proteins, whose role is only now beginning to be established. Methods: Using RNA-seq, bioinformatics tools and a cohort of glioma patients to validate the results, we have analysed the inflammatory processes involved in glioma. Transcriptional profiles were also used to define biological processes of relevance to specific S100A proteins. Finally, we characterized the relevant immune populations with an IHC analysis and transcriptional profiling. Results: We have noted an increased expression of S100A in GBM IDH wt compared to gliomas IDH mutants. This allowed us to analyse the involvement of different members of the family, such as S100A9, A11 and A13 as possible regulators of inflammatory processes in the GBM-IDH wt microenvironment. Thus, we observed that S100A9 is located in hypoxic areas linked to the function of neutrophils, S100A11 is found in vascular areas associated with the function of perivascular pericytes and macrophages, and finally, S100A13 which is related to the dysfunction of microglia. Conclusion: Our findings define different functions for S100A9, A11 and A13 proteins that are associated with the architecture of the glioblastoma microenvironment and define its progression. Moreover, these alterations can be reversed by the RAGE inhibitor, Azeliragon which is in a phase I/II clinical trial NCT05635734.

Keywords: Alzheimer disease; Glioblastoma; Myeloid Cells; clinical trials; neuroinflammation.


Conflict of interest statement

Competing Interests: Steve G. Marcus is the CEO of Cantex Pharmaceuticals. All other authors declare they have no conflict of interest.

Figures

Figure 1
Figure 1
Biological processes and proteins involved in the infiltration of immune cells of Glioblastoma IDH wt. (A-E) Immune cell infiltration in IDH wt glioblastomas (n= 8) compared to IDH mut astrocytomas (n = 22) using IHC against CD45 (A), CD8 (B), CD68 (C) IBA-1 (D) and P2RY12 (E). Data represent mean ± SD. **** P ≤ 0.0001; ** P ≤ 0.01; n.s., not significant. Statistical significance was determined by Mann-Whitney test. (F-I) GSEA analysis using the differential expression of IDH wt compared to the IDH mutant shows inflammatory response (F), hypoxia (G), interferon gamma response (H) and IL-6/JAK/STAT3 signalling pathway (H), MSigDB database. (J) Volcano plot showing differential expression in IDH wt compared to the IDH mut cohort data obtained by RNA-seq (IlluminaHiSeq). Scale bar 200 μm (IHC).
Figure 2
Figure 2
Differential expressions of S100A9, S100A11 and S100A13 in various areas of the tumor drives TEM remodelling, correlating with lower survival of glioma patients. (A-C) Representative images and expression levels at the transcriptomic (RT-qPCR) and protein (IHC) levels of S100A9 (A), S100A11 (B) and S100A13 (C) in our cohort of glioma patients classified into IDH mut (n = 22/12) and IDH wt (n = 42/12) respectively. Data represent mean ± SD. **** P ≤ 0.0001; *** P ≤ 0.001; ** P ≤ 0.01. Statistical significance was determined by the Mann-Whitney test. (D-F) Kaplan-Meier survival curves of patients with gliomas (TCGA LGG+HGG cohort), in relation to the expression of S100A9 (D), S100A11 (E), S100A13 (F). P values were determined by Mantel-Cox log-rank test. (G-I) Gene ontology enrichment analysis of pathways co-regulated with S100A9 (G), S100A11 (H), S100A13 (I) in the glioma cohort (TCGA GBM, Firehose Legacy). (J-M) Heat map (J) (IvyGAP) and quantification of the expression values (RNA-seq) of S100A9 (J), S100A11 (K), and S100A13 (L) in different tumor areas of the glioma (LE leading edge, IT infiltrating tumor cells, MVP microvascular proliferation, CT cellular tumor and PAN palisading cell around necrosis). Data represent mean ± SD. **** P ≤ 0.0001; *** P ≤ 0.001; * P ≤ 0.05; n.s., not significant. Statistical significance was determined by the One-way ANOVA ordinary test. +, positive regulation of; -, negative regulation of; NK cell, Natural Killer cell; DC Dendritic Cell; Mф, Macrophage. Scale bar 200 µm (IHC).
Figure 3
Figure 3
S100A13 expression was associated with peripheral and infiltrating microglia in GBM. (A) IHC images of S100A13 in the peripheral and infiltrating areas of the tumor. (B) IHC images of the P2RY12 in tumors with high and low microglia. (C-D) Representative images of IHC (C) and quantification (D) of S100A13 in high and low microglia tumor sections. (E-F) IF images (E) and quantification (F) of S100A13+ P2RY12+ double-positive cells in high (n = 4) and low (n = 4) microglia sections. Data represent mean ± SD. **** P ≤ 0.0001; * P ≤ 0.05. Statistical significance was determined by Student's t-test(G) Kaplan-Meier survival curve of our cohort of GBM patients (n = 40) stratified based on S100A13 expression.; n.s., not significant. P values were determined by Mantel-Cox log-rank test. Scale bar 200 μm (IHC) and 50 µm (IF).
Figure 4
Figure 4
S100A9 expression was related to hypoxic inflammation in necrotic areas of GBM. (A-B) IHC images of GLUT1 in areas with high and low hypoxia. (C-D) Representative IHC images (C) and quantification (D) of S100A9 in high- and low-hypoxic tumor sections. (E) scRNA-seq analysis of expression levels of myeloid markers (CD68, TREM1, CLEC5A, MS4A4) in glioma. (F-G) IF images (F) and quantification (G) of S100A9+ CD68+ double-positive cells in high (n = 5) and low (n = 5) hypoxic glioma sections. Data represent mean ± SD. **** P ≤ 0.0001. Statistical significance was determined by Student's t-test. (H) Venn diagram of the intersection of genes co-expressed with S100A9, related to inflammatory processes and expressed in the hypoxic and necrotic zone of the tumor (hypoxic inflammation signature). (I-J) Heat map (I) and quantification (J) of hypoxic inflammation signature expression in our own cohort of GBM patients (n = 26) stratified based on S100A9 expression. Data represent mean ± SD. *** P ≤ 0.001. Statistical significance was determined by Student's t-test. (K) ROC curve to evaluate the diagnostic efficacy of hypoxic inflammation gene signature expression in GBM. (L) Kaplan-Meier survival curve of our GBM patient cohort (n = 40) stratified based on S100A9 expression. P values were determined by Mantel-Cox log-rank test. Scale bar 200 µm (IHC) 50 μm (IF).
Figure 5
Figure 5
S100A11 expression was associated with perivascular inflammation, linked to GBM proliferation. (A) IHC images of CD34 in tumor sections. (B-C) Correlation analysis between S100A11 expression and percent of dilated vessels (n = 23) (B) and vascular density (n = 20) (C). Data represent mean ± SD. Statistical significance was determined by Pearson's rank correlation (D-E) Representative IHC images (D) and quantification (E) of S100A11-positive cells in the brain parenchyma and around blood vessels. Data represent mean ± SD. *** P ≤ 0.001. Statistical significance was determined by Student's t-test. (F) Quantification of S100A11+ cells in tumor sections with high and low vasculature. Data represent mean ± SD. *** P ≤ 0.001. Statistical significance was determined by Student's t-test. (G) Representative IHC images of hematoxylin eosin staining tumor areas. (H) Quantification of S100A11+ cells in sections with high and low tumor density. (I) IHC images of MIB-1 in tumor sections. (J-K) Correlation analysis between the number of S100A11+ cells and the mitotic (K) and proliferative (L) index. Data represent mean ± SD. Statistical significance was determined by Pearson's rank correlation Scale bar 200 μm (IHC).
Figure 6
Figure 6
The expression of S100A11 was associated with pericyte cells, and their perivascular inflammation, linked to poor prognosis and glioma recurrence. (A) scRNA-seq analysis of the expression levels of S100A11 and vascular markers (ACTA2/ αSMA, PDGFRB, CD348, CS248) in gliomas. (B-C) IF images (B) and quantification (C) of S100A11+ αSMA+ double-positive cells in tumor sections with high (n = 3) and low (n= 3) vasculature. Data represent mean ± SD. ** P ≤ 0.01. Statistical significance was determined by Student's t-test. (D) Venn diagram of the intersection of genes co-expressed with S100A11 related to inflammatory processes and expressed in the vascular zone (perivascular inflammation signature). (E-F) Heat map (E) and quantification (F) of perivascular inflammation signature expression in our own cohort of GBM patients (n = 26). Data represent mean ± SD. ** P ≤ 0.01. Statistical significance was determined by Student's t-test. (G) ROC curve to evaluate the diagnostic efficacy of the perivascular inflammation genetic signature in GBM. (H) Kaplan-Meier survival curve of the GBM patient cohort (n = 40) stratified by S100A11 expression. P values were determined by Mantel-Cox log-rank test. (I-J) Representative IHC images of S100A11 from paired glioma samples (primary and recurrent tumor) with progression (I) and without progression (J). Scale bar 50 μm (IF).
Figure 7
Figure 7
Response associated with perivascular and hypoxic inflammation with treatment with Azeliragon in glioblastoma mouse model and PDTFs model. (A) Schematic diagram of AZG treatment in mice injected with GL261 tumors. (B) Kaplan-Meier overall survival curves of control and AZG-treated mice. GL261 control (n = 9) and AZG (n = 10). ** P ≤ 0.01 by Mantel-Cox log-rank test for survival experiments. (C-D) Heatmap and quantification of perivascular (C) and hypoxic (D) inflammation gene signature after treatment with AZG (0.2 mg/kg for 25 days). (E-F) Representative IHC images (E) and quantification (F) of KI67 in murine model. Data represent mean ± SD. ** P ≤ 0.01; * P ≤ 0.05. Statistical significance was determined by Student's t-test. (G) Schematic representation of the PDTF procedure. (H-I) Quantification of the gene expression signature of perivascular (H) and hypoxic (I) inflammation after treatment with AZG (10 µg/ml for 24 h). (J-K) Representative IHC images (J) and quantification (K) of KI67 in PDTFs. Data represent mean ± SD. *** P ≤ 0.001; ** P ≤ 0.01; * P ≤ 0.05; n.s., not significant. Statistical significance was determined by Student's t-test. PDTF; Patients Derived Tumor Fragment; AZG; Azeliragon.
Figure 8
Figure 8
Representative diagram of the extracellular S100s signaling.
Figure 9
Figure 9
Representative diagram of the different types of inflammation linked to glioma progression. It shows the differential spatial distribution of S100A13, S100A11, and S100A9, allowing us to attribute specific functions to their locations within the architecture of glioblastoma.

References

    1. Louis DN, Perry A, Wesseling P, Brat DJ, Cree IA, Figarella-Branger D. et al. The 2021 WHO Classification of Tumors of the Central Nervous System: a summary. Neuro Oncol. 2021;23(8):1231–51. - PMC - PubMed
    1. Torp SH, Solheim O, Skjulsvik AJ. The WHO 2021 Classification of Central Nervous System tumours: a practical update on what neurosurgeons need to know-a minireview. Acta Neurochir (Wien) 2022;164(9):2453–64. - PMC - PubMed
    1. Grochans S, Cybulska AM, Siminska D, Korbecki J, Kojder K, Chlubek D. et al. Epidemiology of Glioblastoma Multiforme-Literature Review. Cancers (Basel) 2022;14(10):2412. - PMC - PubMed
    1. Weller M, van den Bent M, Preusser M, Le Rhun E, Tonn JC, Minniti G. et al. EANO guidelines on the diagnosis and treatment of diffuse gliomas of adulthood. Nat Rev Clin Oncol. 2021;18(3):170–86. - PMC - PubMed
    1. Gonzalez LL, Garrie K, Turner MD. Role of S100 proteins in health and disease. Biochim Biophys Acta Mol Cell Res. 2020;1867(6):118677. - PubMed

Publication types

MeSH terms

Associated data