. 2025 Jan 1;15(2):632-655.
doi: 10.7150/thno.103449. eCollection 2025.

Orchestrating the frontline: HDAC3-miKO recruits macrophage reinforcements for accelerated myelin debris clearance after stroke

Affiliations

Orchestrating the frontline: HDAC3-miKO recruits macrophage reinforcements for accelerated myelin debris clearance after stroke

Jiaying Li et al. Theranostics. .

Abstract

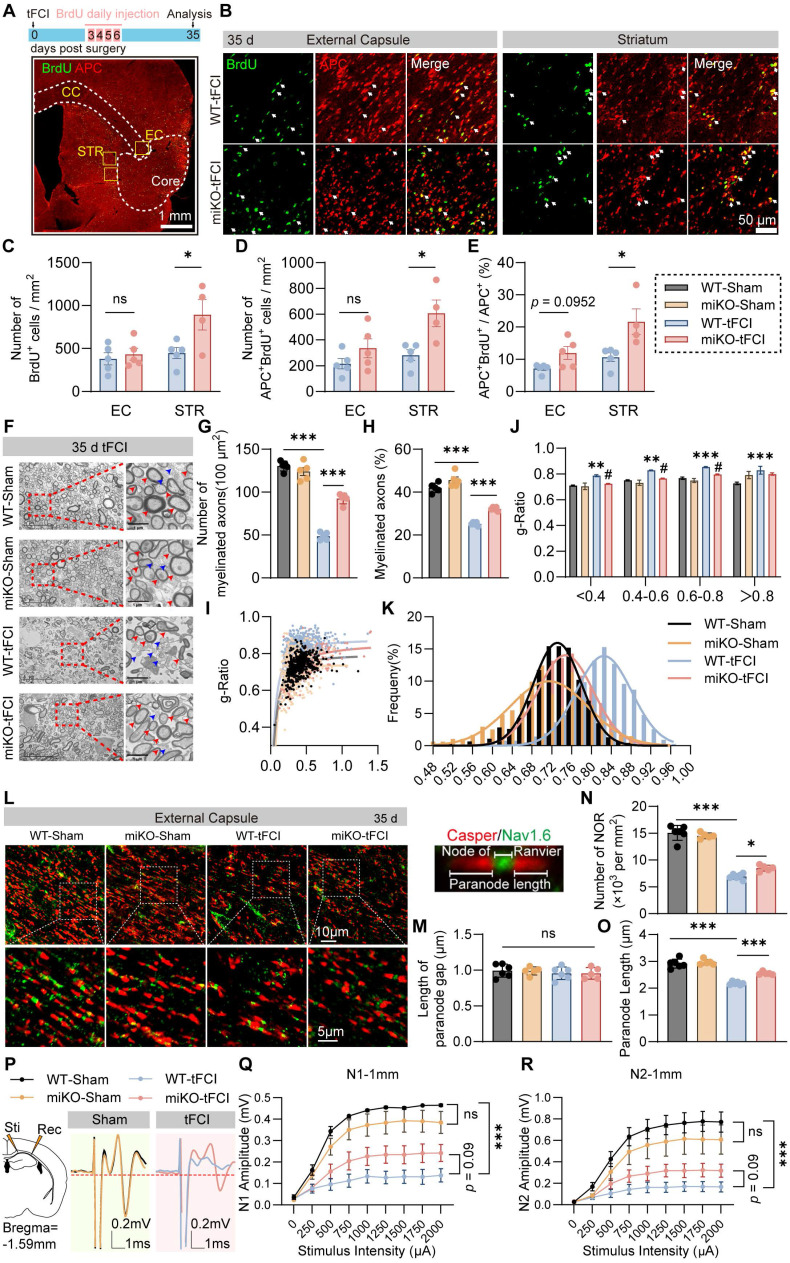
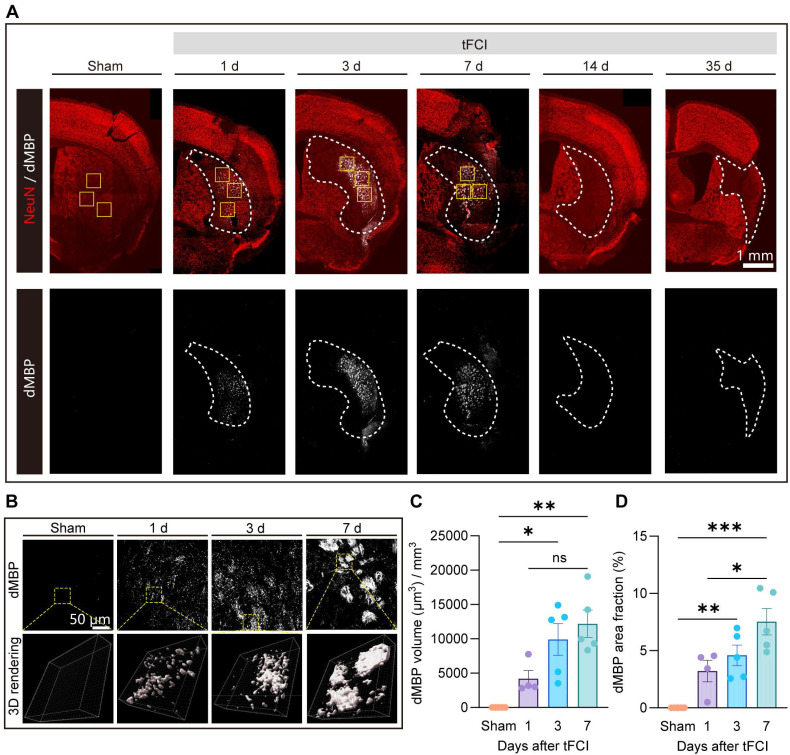
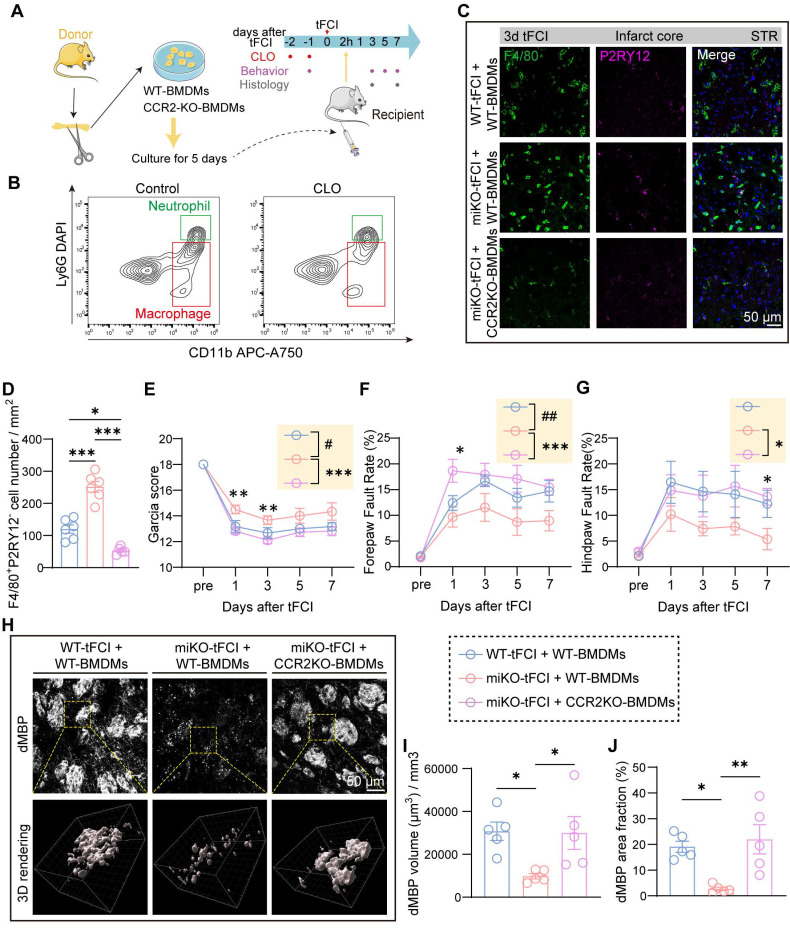
Rational: White matter has emerged as a key therapeutic target in ischemic stroke due to its role in sensorimotor and cognitive outcomes. Our recent findings have preliminarily revealed a potential link between microglial HDAC3 and white matter injury following stroke. However, the mechanisms by which microglial HDAC3 mediates these effects remain unclear. Methods : We generated microglia-specific HDAC3 knockout mice (HDAC3-miKO). DTI, electrophysiological technique and transmission electron microscopy were used to assess HDAC3-miKO's effects on white matter. RNA sequencing, flow cytometry, immunofluorescence staining and ex vivo phagocytosis assay were conducted to investigate the mechanism by which HDAC3-miKO ameliorated white matter injury. Macrophage depletion and reconstitution experiments further confirmed the involvement of macrophage CCR2 in the enhanced white matter repair and sensorimotor function in HDAC3-miKO mice. Results : HDAC3-miKO promoted post-stroke oligodendrogenesis and long-term histological and functional integrity of white matter without affecting early-stage white matter integrity. In the acute phase, HDAC3-deficient microglia showed enhanced chemotaxis, recruiting macrophages to the infarct core probably by CCL2/CCL7, where dMBP-labelled myelin debris surged and coincided with their infiltration. Infiltrated macrophages outperformed resident microglia in myelin phagocytosis, potentially serving as true pioneers in myelin debris clearance. Although macrophage phagocytosis potential was similar between HDAC3-miKO and WT mice, increased macrophage numbers in HDAC3-miKO accelerated myelin debris clearance. Reconstitution with CCR2-KO macrophages in HDAC3-miKO mice slowed this clearance, reversing HDAC3-miKO's beneficial effects. Conclusions : Our study demonstrates that HDAC3-deficient microglia promote post-stroke remyelination by recruiting macrophages to accelerate myelin debris clearance, underscoring the essential role of infiltrated macrophages in HDAC3-miKO-induced beneficial outcomes. These findings advance our understanding of microglial HDAC3's role and suggest therapeutic potential for targeting microglial HDAC3 in ischemic stroke.

Keywords: HDAC3-miKO; chemotaxis; macrophages; myelin debris; white matter repair.


Conflict of interest statement

Competing Interests: The authors have declared that no competing interest exists.

Figures

Figure 1
Figure 1
HDAC3-miKO occupies a reparative but not a protective role in post-stroke white matter. (A) Representative images of Iba1/HDAC3 immunostaining in the peri-infarct striatum (STR) 3 days after tFCI. White arrows indicate HDAC3+ microglia/macrophages. Yellow arrows indicate HDAC3- microglia/macrophages. 3D rendering was performed on the cell indicated by the white boxes to depict HDAC3 expression in Iba1+ cells. (B) Quantification of the mean fluorescence intensity (MFI) of HDAC3 in each Iba1+ cell. (C) Quantification of HDAC3 MFI in all Iba1+ cells in each animal. Each dot indicates an animal. n = 3-4 mice/group. (D) Gating strategy for flow-sorted microglia (CD11b+CD45int) and infiltrated macrophages (CD11b+CD45+Gr1-CD11c-). (E&F) RNA expression level of Hdac3 in flow-sorted microglia (E, n = 6/group) or macrophages (F, n = 4 for WT-tFCI; n = 6 for miKO-tFCI). (G) DEC map presented from rostral planes to caudal planes was used to visualize ex vivo DTI on day 35 after tFCI. (H&I) FA or RD value on day 3 and day 14 in EC area (H) and IC area (I). n = 5/group. (J&K) The foot fault rate for fore paws (J) and hind paws (K). n = 8 for WT-Sham; n = 5 for miKO-Sham; n = 12 for WT-/miKO-tFCI. (L) Correlation matrix between fore/hind paw fault rates and FA/RD in EC/IC on day 3/14/35. The color and the area of circles indicate the (absolute) value of correlation coefficients. n = 5 for WT-tFCI; n = 6 for miKO-Sham. All data are presented as means±SEM. Data were analyzed using (B-C) one-way ANOVA followed by Bonferroni's post hoc, (E) unpaired two-tailed Student's t test, (F) Mann-Whitney test, and (H-K) two-way ANOVA followed by Bonferroni's post hoc, or (L) Pearson correlation. *p < 0.05, **p < 0.01, ***p < 0.001, ns: no significance, as indicated.
Figure 2
Figure 2
HDAC3-miKO promotes oligodendrogenesis and improves long-term histological and functional integrity of white matter after stroke. (A) Time line for BrdU injection and representative large images of BrdU/APC immunofluorescence. The yellow boxes indicated the locations where the BrdU/APC immunofluorescence images (B) were taken in the peri-infarct region of STR or EC on day 35 after tFCI. (B) Representative group-wise images of BrdU/APC immunofluorescence. White arrows indicated BrdU+APC+ newly-generated oligodendrocytes. (C-E) Quantification of the number of BrdU+ cells (C), APC+BrdU+ cells (D), and the percentage of APC+BrdU+ cells to the total APC+ cells (E). n = 5 for WT-tFCI; n = 6 for miKO-tFCI. (F) Representative electron micrographs. Red arrows indicated myelinated axons and blue axons indicated unmyelinated axons. (G-K) Quantification of the number of myelinated axons per 100 μm2 (G), the percentage of myelinated axons to the total axons (H), scatter plot of g-ratio (I), group-wise comparison of g-ratio in different scales (J), and frequency histogram of g-ratio (K). n = 5/group. (L) Representative images of Caspr/Nav1.6 immunofluorescence staining in the peri-infarct EC 35 days after tFCI. The right sub-image indicated an intact NOR, demonstrating the length of paranode gap and paranode length. (M-O) Quantification of the length of paranode gap (M), the number of NOR (N), and the paranode length (O). n = 6 for WT-Sham/-tFCI; n = 5 for miKO-Sham/-tFCI. (P) Schematic diagram indicating the stimulating site (Sti) and recording site (Rec) for CAPs recording in the EC at Bregma -1.59 mm and group-wise visualization of CAPs demonstrating N1 or N2 amplitudes. (Q&R) Group-wise comparison of N1 (Q) and N2 (R) amplitudes under different stimulus intensity. n = 5 for WT-Sham; n = 6 for miKO-Sham; n = 7 for WT-/miKO-tFCI. All data are presented as means±SEM. Data were analyzed using (C-E) unpaired two-tailed Student's t test, Mann-Whitney test, or (G&H, J, M-O) one-way ANOVA followed by Bonferroni's post hoc or (Q&R) two-way ANOVA followed by Bonferroni's post hoc. *p < 0.05, ***p < 0.001, WT -tFCI vs. WT-Sham or as indicated; #p < 0.05, miKO-tFCI vs. WT-tFCI, ns: no significance, as indicated.
Figure 3
Figure 3
RNA-seq reveals increased chemotaxis in HDAC3-deficient microglia. (A) Ridge plot visualizing GSEA results (miKO-tFCI vs. WT-tFCI). (B) GSEA results showed significantly upregulated GO pathways of “chemotaxis”, “granulocyte migration”, “leukocyte migration” and “myeloid leukocyte migration” (miKO-tFCI vs. WT-tFCI). (C) Heatmap showed expression level of genes associated with the term “Leukocyte Chemotaxis” in microglia. Each column represents a biological replicate. (D) qPCR validation of representative C-C chemokine genes whose expression significantly changed in miKO-tFCI vs. WT-tFCI. n = 6 for WT-tFCI; n = 5 for miKO-tFCI. All data are presented as means±SEM. Data were analyzed using unpaired two-tailed Student's t test. *p < 0.05, ***p < 0.001, as indicated.
Figure 4
Figure 4
HDAC3-deficient microglia recruit macrophage reinforcements to the infarct core. (A) Macrophages (CD11b+CD45hiLy6C+), neutrophils (CD11b+CD45hiCD11c-Gr1+), dendritic cells (DCs) (CD11b+CD45hiCD11c+Gr1-), T cells (CD11b-CD45hiCD3+), B cells (CD11b-CD45hiCD19+) and microglia (CD11b+CD45int). (B-H) The percentage of these cells to single cells, respectively. n = 8/group. (I) Representative large image of Iba1/NeuN immunostaining, which indicated the infarct core and penumbra region photographed for Iba1/F4/80/P2RY12 staining (J-M). (J&K) Representative images of Iba1/P2RY12 immunostaining (J) and quantification of the number of Iba1+P2RY12- cells and Iba1+P2RY12+ cells (K) in the ischemic penumbra 3 d after tFCI. The right panel showed the proportion of Iba1+P2RY12- cells or Iba1+P2RY12+ cells to the overall Iba1+ cells. (L&M) Representative images of F4/80/P2RY12 immunostaining (L) and quantification of the number of F4/80+P2RY12- cells and P2RY12+ cells (M) in the ischemic core 3 d after tFCI. The right panel showed the proportion of F4/80+P2RY12- cells or P2RY12+ cells to the overall F480+ or P2RY12+ cells. n = 4 for WT-tFCI; n = 5 for miKO-tFCI. All data are presented as means±SEM. Data were analyzed using (B-E) one-way ANOVA followed by Bonferroni's post hoc, (F-H) Kruskal-Wallis test followed by Dunn's post hoc test or (K&M) unpaired two-tailed Student's t test. *p < 0.05, **p < 0.01, ***p < 0.001, ns: no significance, as indicated (B-H). ***p < 0.001 for comparison of Iba1+P2RY12+ cell number between miKO-tFCI and WT-tFCI. ##p < 0.01 for comparison of the overall Iba1+ cells (K). ***p < 0.001 for comparison of F4/80+P2RY12- cell number between miKO-tFCI and WT-tFCI. ##p < 0.01 for comparison of the overall F480+ or P2RY12+ cells (M).
Figure 5
Figure 5
Spatiotemporal pattern of myelin debris distribution after stroke. (A) Representative large images of dMBP/NeuN immunofluorescence staining on Sham group or on day 1,3,7,14,35 after tFCI. The white dashed lines outlined the infarct core with neuronal loss. The following images (B) were taken from where the yellow boxes indicated. (B) Representative images demonstrating dMBP signals and the 3D rendering of these signals in the infarct core. (C) Quantification of dMBP volume (μm3) per mm3. (D) Quantification of dMBP area fraction (%). n = 4 for WT-/miKO-Sham; n = 5 for WT-/miKO-tFCI. All data are presented as means±SEM. Data were analyzed using (C) one-way ANOVA followed by Bonferroni's post hoc and (D) Kruskal-Wallis test followed by Dunn's post hoc test *p < 0.05, **p < 0.01, ***p < 0.001, ns: no significance, as indicated.
Figure 6
Figure 6
HDAC3-miKO accelerates myelin debris clearance by boosting macrophage recruitment without altering phagocytosis capability. (A) Representative image of F4/80/dMBP immunofluorescence staining, indicating the (a) “Engulfed” state (overlap volume ratio > 0) or (b) “No contact” state (overlap volume ratio = 0) of F4/80+ cells. (B) Group-wise representative images of F4/80/dMBP immunofluorescence staining and the associated 3D rendering illustrating the internalization of dMBP+ myelin debris by an F4/80+ cell. (C) Quantification of F4/80+ cell number per mm3. (D&E) Quantification of the number of F4/80+ “Engulfed” or “No contact” cells (D), their respective percentage to the total F4/80+ cells (E). (F&G) The average overlap volume ratio of all F4/80+ cells (F) and the average cell volume of all F4/80+ cells (G) in all the FOVs photographed. Each dot represented a mouse, 10-15 F4/80+ cells were quantified for each mouse. n = 4 for WT-tFCI; n = 6 for miKO-tFCI (C-G). (H) Schematic diagram showing the method of ex vivo phagocytosis assay. (I) Representative histograms showing PKH26-red fluorescence intensity in CD11b+CD45int microglia or CD11b+CD45hi macrophages, assessed by flow cytometry. (J) Percentage of microglia/macrophages containing PKH26 signal. n = 6 for WT-tFCI; n = 3 for miKO-tFCI. (K) Representative histograms showing pHrodo-red fluorescence intensity in CD11b+CD45int microglia or CD11b+CD45hi macrophages, assessed by flow cytometry. (L) Percentage of microglia/macrophages containing pHrodo-red signal. n = 6/group. (M) Quantification of total engulfed dMBP volume by F4/80+ cells in all photographed FOVs. Each dot represented a mouse. n = 4 for WT-tFCI; n = 6 for miKO-tFCI. (N) Representative images of dMBP immunofluorescence staining on day 3/7 after tFCI. (O) Quantification of dMBP volume (μm3) per mm3. (P) Quantification of dMBP area fraction (%).3 d: n = 6 for WT-tFCI; n = 7 for miKO-tFCI. 7 d: n = 5 for WT-tFCI; n = 4 for miKO-tFCI (O&P). All data are presented as means±SEM. Data were analyzed using (C-G, J&L and N-P) unpaired two-tailed Student's t test, Mann-Whitney test or (J&L) one-way ANOVA followed by Bonferroni's post hoc. *p < 0.05, **p < 0.01, ***p < 0.001, ns: no significance, as indicated.
Figure 7
Figure 7
CCR2-KO BMDMs reconstitution reduces infiltration into the brain and reverses the effects of HDAC3-miKO. (A) Experimental design indicating the strategy for CCR2 deficency macrophages administration. (B) Flow cytometry showing depletion of macrophages 24 h after CLO administration. (C-D) Representative images of F4/80/P2RY12 immunostaining and (D) quantification of the number of F4/80+P2RY12 cells. (E-G) Sensorimotor function assessment by Garcia score (E) and foot fault test (F&G). n = 6 for WT-tFCI+WT-BMDM or miKO-tFCI+WT-BMDM; n = 11 for miKO-tFCI+CCR2 KO-BMDM. (H) Representative images of dMBP immunofluorescence staining and the corresponding 3D rendering in three groups. (I) Quantification of dMBP volume (μm3) per mm3. (J) Quantification of dMBP area fraction (%). All data are presented as means±SEM. Data were analyzed using (D&I-J) one-way ANOVA followed by Bonferroni's post hoc test or (E-G) two-way ANOVA followed by Bonferroni's post hoc test. Comparisons in the yellow blocks referred to the main effects between groups for the ANOVA. *p < 0.05, **p < 0.01, ***p < 0.001 for comparison between miKO-tFCI+WT-BMDM and miKO-tFCI + CCR2-KO BMDM; #p < 0.05; ##p < 0.01 for comparison between WT-tFCI + WT-BMDM and miKO-tFCI + WT-BMDM.

Similar articles

Cited by

References

    1. Cheng YD, Al-Khoury L, Zivin JA. Neuroprotection for ischemic stroke: two decades of success and failure. NeuroRx. 2004;1(1):36–45. - PMC - PubMed
    1. Yuan C, Shi L, Sun Z, Xu F, Wang C, Shan J. et al. Regulatory T cell expansion promotes white matter repair after stroke. Neurobiol Dis. 2023;179:106063. - PubMed
    1. Jin C, Shi Y, Shi L, Leak RK, Zhang W, Chen K. et al. Leveraging single-cell RNA sequencing to unravel the impact of aging on stroke recovery mechanisms in mice. Proc Natl Acad Sci U S A. 2023;120(25):e2300012120. - PMC - PubMed
    1. Xu J, Zhang L, Li M, He X, Luo J, Wu R. et al. TREM2 mediates physical exercise-promoted neural functional recovery in rats with ischemic stroke via microglia-promoted white matter repair. J Neuroinflammation. 2023;20(1):50. - PMC - PubMed
    1. Zhang J, Zhang W, Gao X, Zhao Y, Chen D, Xu N. et al. Preconditioning with partial caloric restriction confers long-term protection against grey and white matter injury after transient focal ischemia. J Cereb Blood Flow Metab. 2019;39(7):1394–409. - PMC - PubMed

Publication types