. 2025 Jan 1;15(2):340-361.
doi: 10.7150/thno.100748. eCollection 2025.

Targeting macrophage circadian rhythms with microcurrent stimulation to activate cancer immunity through phagocytic defense

Affiliations

Targeting macrophage circadian rhythms with microcurrent stimulation to activate cancer immunity through phagocytic defense

Yuya Yoshida et al. Theranostics. .

Abstract

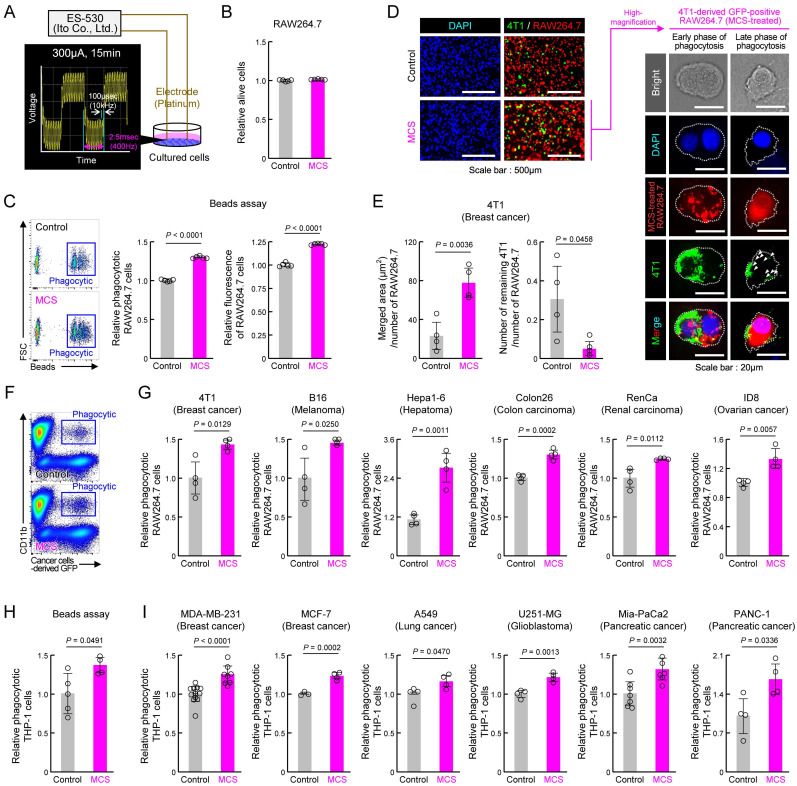
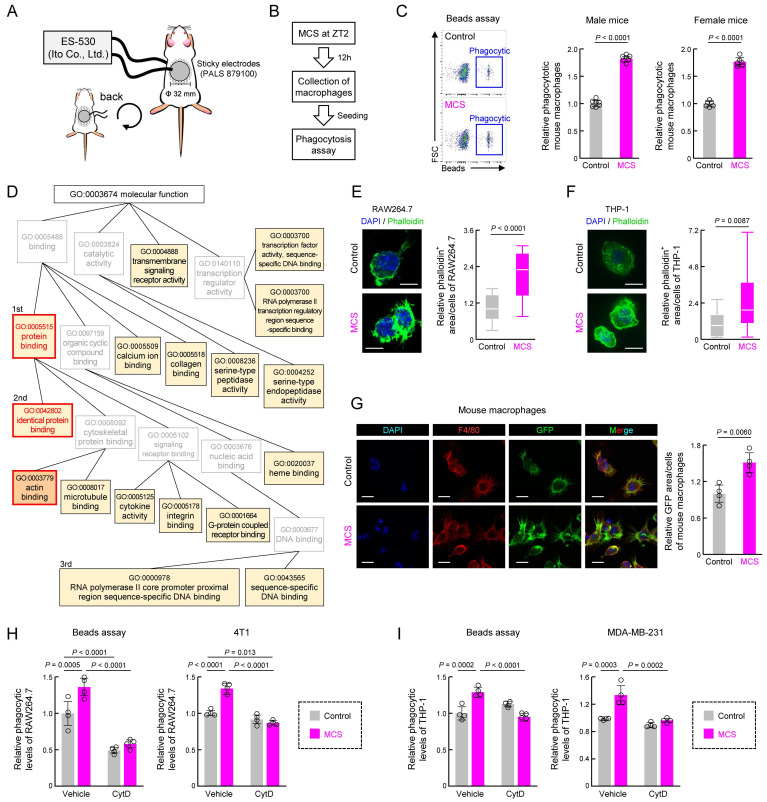
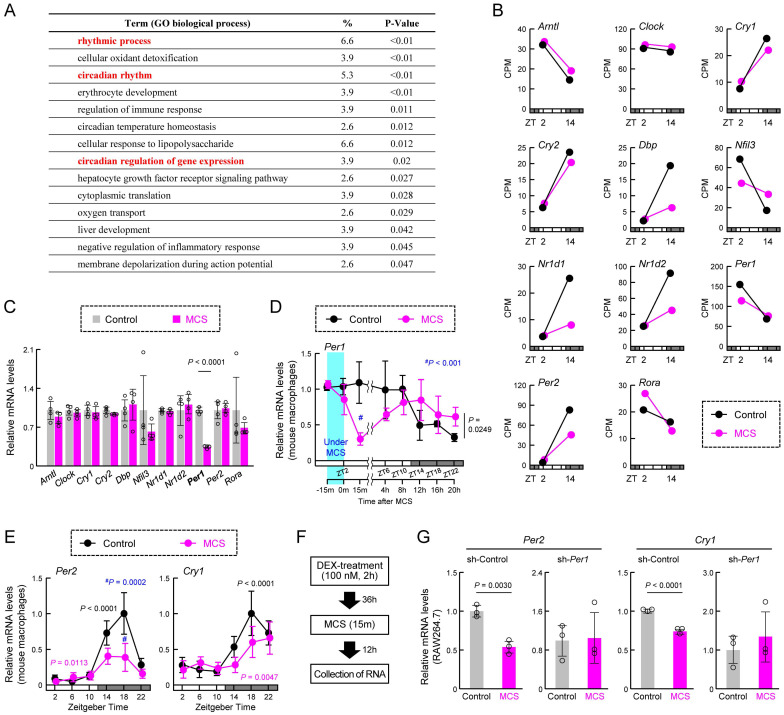
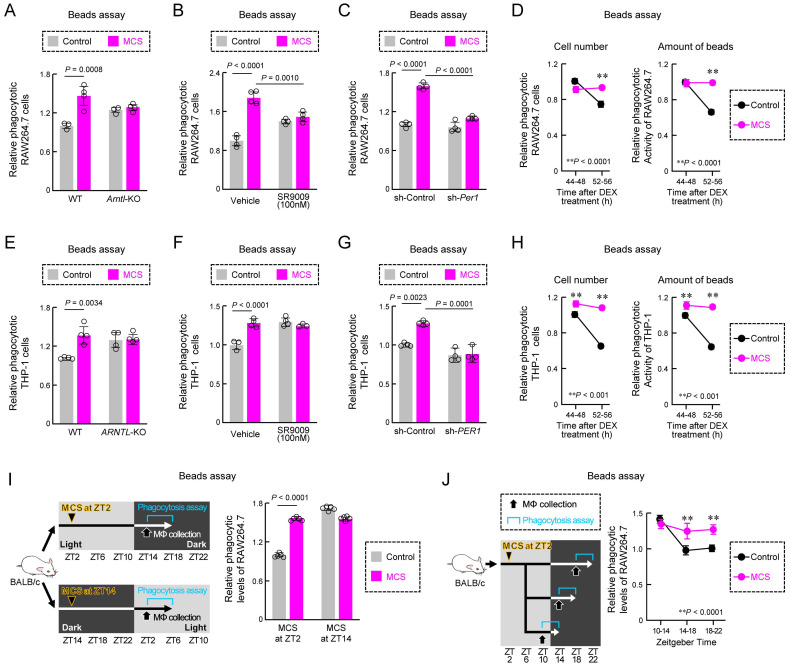
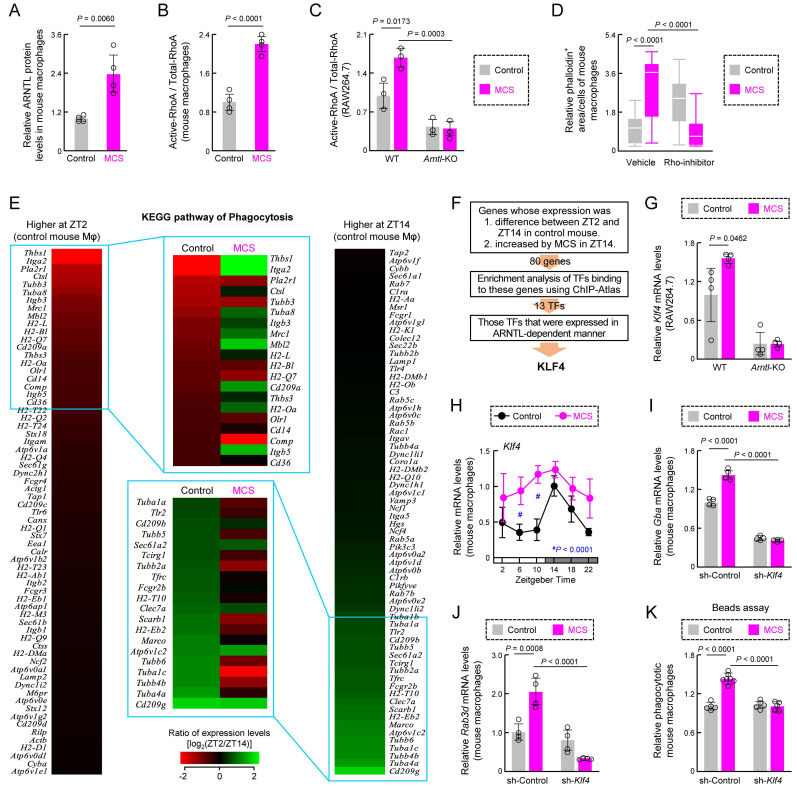
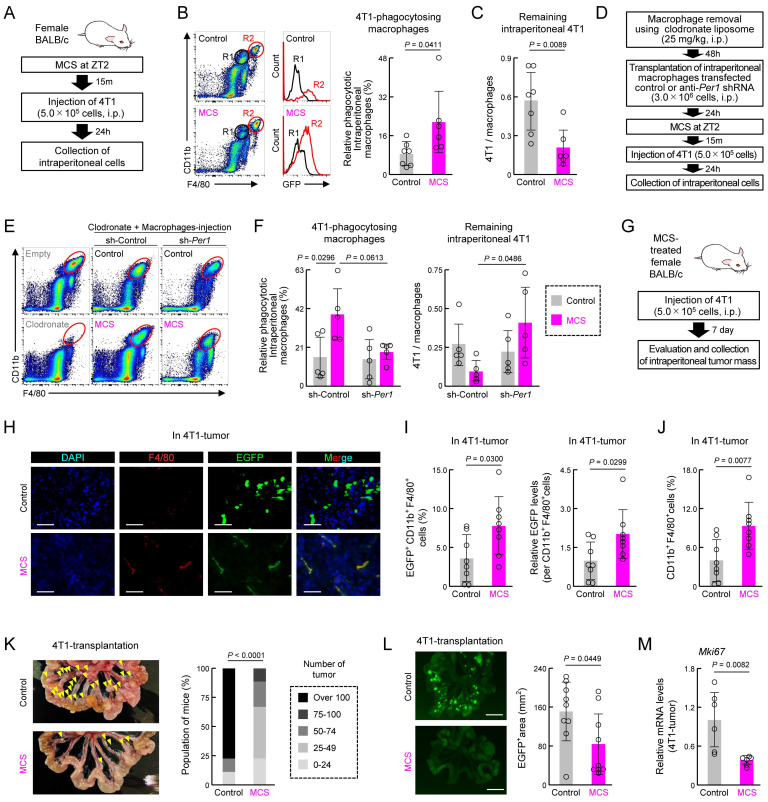
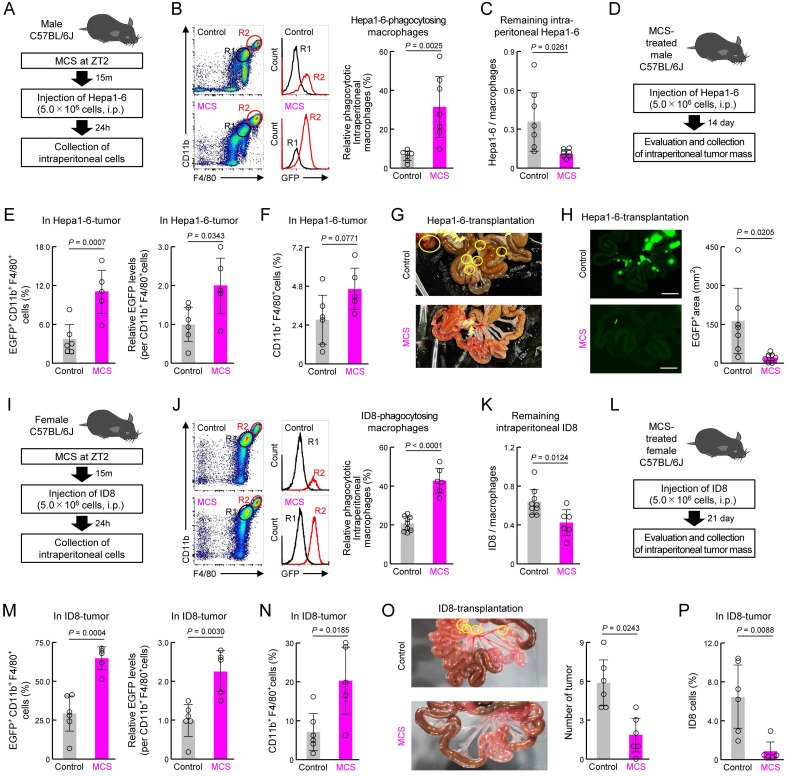
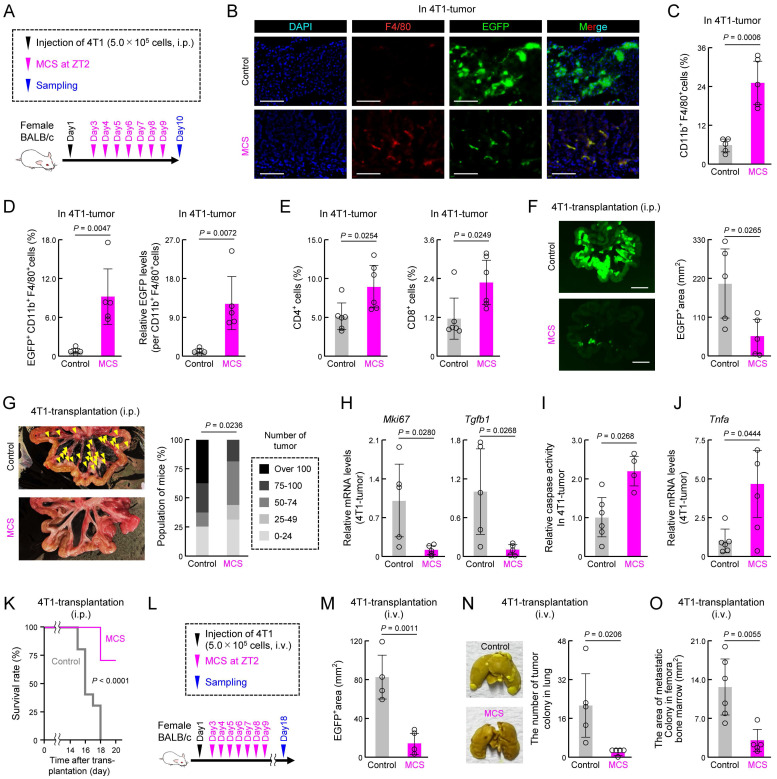
Rationale: Macrophage phagocytosis plays a role in cancer immunotherapy. The phagocytic activity of macrophages, regulated by circadian clock genes, shows time-dependent variation. Intervening in the circadian clock machinery of macrophages is a potentially novel approach to cancer immunotherapy; however, data on this approach are scarce. Microcurrent stimulation (MCS) promotes inflammation, proliferation, and remodeling, suggesting its potential to modulate macrophage function; however, its application has been limited. In this study, we investigated the impact of MCS on macrophage phagocytosis of cancer cells using mouse/human macrophage cell lines and various mouse/human cancer cell lines. Methods: Cells and mice received 300 µA, 400 Hz bidirectional pulsed MCS. Gene expression, protein expression, and phagocytosis activity were assessed in intraperitoneal macrophages collected from mice, as well as in RAW264.7, and THP-1 cells. Flow cytometry, population, phagocytosis activity, RNA-seq, and immunohistochemistry analyses were performed. Results: Noninvasive MCS prevented time-dependent reduction in macrophage phagocytosis of cancer cells by modulating the circadian clock genes. MCS also enhanced phagocytosis in mouse RAW264.7 and human THP-1 cells across various cancer types by promoting actin polymerization; similar in vivo effects were observed in mice. This enhancement occurred in abdominal macrophages of both sexes and was mediated by changes in clock gene expression. Specifically, suppressing the clock gene Per1 nullified the effects of MCS. Moreover, although macrophage phagocytosis typically declined during the dark period, MCS during the light period prevented this reduction. MCS also increased phagocytosis of peritoneally implanted cancer cells (4T1, ID8, and Hepa1-6) in mice, significantly reducing tumor engraftment and growth, and ultimately improving prognosis. Conclusions: The findings of this study suggest that targeting macrophage circadian mechanisms via MCS could enhance cancer immunity, offering new avenues for cancer immunotherapy.

Keywords: cancer immunotherapy; circadian rhythm; macrophage; microcurrent stimulation; phagocytosis.


Conflict of interest statement

Competing Interests: The authors have declared that no competing interest exists.

Figures

Figure 1
Figure 1
Effect of MCS on cancer cell phagocytosis by RAW264.7 and THP-1 macrophages. (A) Schematic illustration of the MCS treatment protocol for RAW264.7 and THP-1 cells. Phagocytosis was assessed 12 h post-MCS treatment. (B) Comparison of survival rates of RAW264.7 cells following 12 h of MCS treatment. (C) Effect of MCS treatment on phagocytic activity of RAW264.7 cells on opsonized beads. Left panels depict flow cytometric analysis of the phagocytosis assay. The middle panel illustrates the difference in the ratio of opsonized bead-derived FITC+ macrophage cell populations between non-MCS- and MCS-treated cells. The right panel shows the variance in phagocytosed beads per cell. Beads were added 12 h after MCS and co-incubated for another 3 h. The phagocytic activity was measured immediately after the addition of the beads. (D,E) Visualization of GFP-positive 4T1 cells (green) and Control or MCS-treated RAW264.7 cells (red) co-cultured for 3 h. For panel D, the representative GFP-positive RAW264.7 cells in the MCS treatment group on the left panel are shown enlarged on the right panel. The white arrow indicates a fragment of 4T1 cells phagocytosed by RAW264.7. For panel E, the comparison of the area of GFP derived from 4T1 that overlaps with RAW264.7 is shown on the left panel, and the comparison of the number of 4T1 cells that do not overlap with RAW264.7 is shown on the right panel. (F) Representative flow cytometry panel for assessing the phagocytosis capacity of RAW264.7 cells using GFP-positive 4T1. The gating strategy is outlined in Figure S19. (G) Relative number of RAW264.7 cells that have phagocytosed 4T1, B16, Hepa1-6, Colon26, RenCa, and ID8 cells. The phagocytic activity was measured immediately after the addition of each cancer cell 12 h after MCS and co-incubated for another 3 h. (H) Effect of MCS on phagocytic activity of THP-1 cells on opsonized beads. Cells were differentiated using PMA exposure for 48 h to evaluate phagocytosis. The phagocytic activity was measured immediately after beads were added 12 h after MCS and co-incubated for another 3 h. (I) Relative number of PMA-treated THP-1 cells that have phagocytosed MDA-MB-231, MCF-7, A549, U251-MG, Mia-PaCa2, and PANC-1 cells. The phagocytic activity was measured immediately after the addition of each cancer cell 12 h after MCS and co-incubated for another 3 h. Data are expressed as the mean ± S.D. (n = 4-10). The control value is normalized to 1.0. Statistical significance was determined using two-tailed Student's t-tests. P-values are shown in each graph. FITC: fluorescein isothiocyanate; MCS: microcurrent stimulation; PMA: phorbol 12-myristate 13-acetate; S.D.: standard deviation.
Figure 2
Figure 2
Effect of abdominal MCS on phagocytic capacity of intraperitoneal macrophages in mice. (A) Schematic illustration detailing the MCS procedure applied to mice. After shaving the abdomen and back, an adhesive pad was utilized for MCS application. (B,C) Evaluation of phagocytic activity using opsonized beads. Panel B shows the protocol of MCS treatment. In panel C, the left panels display representative flow cytometry data assessing phagocytosis capacity. The right panels illustrate the difference in the FITC+ macrophage cell population ratio between macrophages isolated from control and MCS-treated male and female mice. (D) Gene Ontology analysis of genes exhibiting MCS-dependent expression variation, based on RNA-seq results obtained from RNA extracted from intraperitoneal macrophages collected 12 h post-MCS. The analysis includes genes with a Control-to-MCS ratio > 2. From the terms with P < 0.05, the top 25 match rates were targeted and arranged based on the hierarchy of parent-child terms. The gene list, all terms with P < 0.05 are provided in Table S1, Figure S3. (E). Left: visualization of polymerized actin with GFP-labeled phalloidin in Control or MCS-treated RAW264.7 cells. Scale bar: 30 μm. Right: Calculation of the relative GFP area / DAPI count, indicative of polymerized actin abundance per cell. Twelve hours after MCS, polymerized actin was stained with phalloidin. (F) Left: visualization of polymerized actin with GFP-labeled phalloidin in Control or MCS-treated THP-1 cells. Cells were differentiated using PMA exposure for 48 h. Scale bar: 30 μm. Right: Calculation of the relative GFP area / DAPI count, indicative of polymerized actin abundance per cell. Twelve hours after MCS, polymerized actin was stained with phalloidin. (G) Visualization of polymerized actin in mouse peritoneal macrophages 12 h post-MCS treatment at ZT2. GFP represents polymerized actin, Red represents F4/80 (macrophage marker), and DAPI represents nuclei. Scale bar: 30 μm. The left panel demonstrates the relative GFP area / F4/80 area, indicating polymerized actin abundance per macrophage. (H) Effect of MCS on phagocytosis of beads (left) or 4T1 cells (right) of RAW264.7 under CytD exposure, an inhibitor of actin polymerization. 12 h after MCS, RAW264.7 cells were treated with CytD for 30 m, and then cultured with beads or 4T1 cells for 3 h before measuring phagocytic activity. (I) Effect of MCS on phagocytosis of beads (left) or MDA-MB-231 cells (right) of PMA-treated THP-1 under CytD exposure, an inhibitor of actin polymerization. 12 h after MCS, THP-1 cells were treated with CytD for 30 m, and then cultured with beads or MDA-MB-231 cells for 3 h before measuring phagocytic activity. Values represent the mean with standard deviation (F: n = 20, others: n = 4-5). For panels C, E-I, the control group is normalized to 1.0. Statistical significance was determined using two-way ANOVA with Tukey-Kramer post-hoc tests (H,I) or two-tailed Student's t-tests (C,E, F,G). P-values are shown in each graph. ANOVA: analysis of variance; CytD: cytochalasin D; DAPI: 4′,6-diamidino-2-phenylindole; FITC: fluorescein isothiocyanate; GFP: green fluorescent protein; MCS: microcurrent stimulation; RNA-seq: RNA sequencing; S.D.: standard deviation; ZT: Zeitgeber Time.
Figure 3
Figure 3
Effect of MCS on the temporal expression of clock genes in macrophages. (A) Gene Ontology analysis of genes exhibiting MCS-dependent expression variations, based on RNA-seq results obtained from intraperitoneal macrophages collected 12 h post-MCS. The analysis includes genes with a Control-to-MCS ratio > 4. The gene list is provided in Table S2. (B) Expression levels of key clock genes involved in circadian clock machinery periodicity, including Arntl, Clock, Cry1, Cry2, Dbp, Nfil3, Nr1d1, Nr1d2, Per1, Per2, and Rora, extracted from RNA-seq results. The values for ZT2 are those in the RNA extracted from macrophages immediately after the end of MCS. The values for ZT14 are those in the RNA extracted from macrophages 12 h after the end of MCS. (C) Expression levels of Arntl, Clock, Cry1, Cry2, Dbp, Nfil3, Nr1d1, Nr1d2, Per1, Per2, and Rora in intraperitoneal macrophages prepared from mice 15 m after MCS. Each mRNA level was measured using RT-qPCR. (D) Temporal mRNA expression profiles of Per1 in intraperitoneal macrophages from Control or MCS-treated female BALB/c mice. The label at the bottom indicates the elapsed time; the time immediately after the end of MCS is defined as 0 m. (E) Temporal mRNA expression profiles of Per2 and Cry1 in intraperitoneal macrophages from Control or MCS-treated female BALB/c mice. (F,G) Effect of MCS on time-dependent decline in the expression of Per2 and Cry1 in DEX-treated WT and Per1-knockdown RAW264.7 cells. MCS was performed 24 h following treatment with 100 nM DEX for 2 h. The protocol of DEX and MCS treatment is shown in panel F. Data are expressed as the mean ± S.D (n = 4-5). Statistical significance was determined using two-way ANOVA with Tukey-Kramer post-hoc tests. P-values are shown in each graph. ANOVA: analysis of variance; MCS: microcurrent stimulation; RNA-seq: RNA sequencing; S.D.: standard deviation.
Figure 4
Figure 4
Effects of MCS on the phagocytic activity via the circadian clock machinery. (A,B) Effects of Arntl KO (A) and SR9009 exposure (B) on phagocytic activity of RAW264.7 cells using opsonized bead. The phagocytic activity was measured immediately after the addition of beads 12 h after MCS and co-incubated for another 3 h with or without SR9009 (100 nM). (C) Influence of sh-Per1 lentivirus transduction on phagocytic activity of RAW264.7 cells. The phagocytic activity was measured immediately after the addition of beads 12 h after MCS and co-incubated for another 3 h. The expression of PER1 protein in the cells is illustrated in Figure S5A. (D) Effect of MCS on time-dependent decline in the number of phagocytic cells (left) and number of phagocytized beads per cell (right) in DEX-treated RAW264.7 cells. MCS was performed 24 h following treatment with 100 nM DEX for 2 h. The phagocytic activity was measured after beads were added 36 or 48 h following treatment with DEX and co-incubated for another 3 h. (E,F) Effects of ARNTL KO (E) and SR9009 exposure (F) on phagocytic activity of PMA-treated THP-1 cells using an opsonized bead. The phagocytic activity was measured immediately after the addition of beads 12 h after MCS and co-incubated for another 3 h with or without SR9009 (100 nM). (G) Influence of sh-PER1 lentivirus transduction on phagocytic activity of PMA-treated THP-1 cells. The phagocytic activity was measured immediately after the addition of beads 12 h after MCS and co-incubated for another 3 h. The expression of PER1 protein in the cells is illustrated in Figure S5. (H) Effect of MCS on time-dependent decline in the number of phagocytic cells (left) and number of phagocytized beads per cell (right) in DEX-treated and PMA-treated THP-1 cells. MCS was performed 24 h after treatment with 100 nM DEX for 2 h. The phagocytic activity was measured after the addition of beads 36 or 48 h after DEX-treatment and co-incubated for another 3 h. (I) Stimulation time-dependent effect of MCS on phagocytic activity in peritoneal macrophages against opsonized beads. Phagocytosis activity was evaluated 12 h after MCS treatment. (J) Effect of MCS on the time-dependent decline in phagocytosis in peritoneal macrophages. Peritoneal macrophages were collected after 8 h of MCS, plated, and exposed to opsonized beads every 4 h to assess phagocytosis activity. Data are expressed as the mean ± S.D. (n = 4-5). Statistical significance was determined using two-way ANOVA with Tukey-Kramer post-hoc tests. P-values are shown in each graph. ANOVA: analysis of variance; DEX: dexamethasone; MCS: microcurrent stimulation; KO: knockout; RNA-seq: RNA sequencing; S.D.: standard deviation; ZT: Zeitgeber Time.
Figure 5
Figure 5
Effects of MCS on the macrophage phagocytosis-related factors. (A) The expression levels of ARNTL protein in intraperitoneal macrophages from Control or MCS-treated female BALB/c mice in ZT14. (B) The expression levels of active-RhoA protein in intraperitoneal macrophages from Control or MCS-treated female BALB/c mice in ZT14. (C) Effects of Arntl KO on RhoA activity of RAW264.7 cells. The expression of each protein was measured using cells 12 h after MCS. For panel A-C, the images of the western blots for each protein are shown in Figure S7. (D) Effects of Rho-inhibitor (1 µg/mL) on polymerized actin levels of intraperitoneal macrophages from Control or MCS-treated female BALB/c mice. The cells were exposed to the Rho inhibitor 8 h after MCS. Four hours after exposure to Rho-inhibitor, polymerized actin was stained with phalloidin. (E) Effect of MCS on time-dependent variations in phagocytosis-related gene expression in intraperitoneal macrophages, utilizing phagocytosis-related gene expression levels obtained from the RNA-seq results. The heatmaps depict genes with log (ZT2/ZT14) values above 0 (left) and below 0 (right) in control macrophages. The top 20 genes with the highest absolute values of each ratio were compared with the log (ZT2/ZT14) values of MCS macrophages, revealing reversed time-dependent variation for many genes. (F) Screening for a transcription factor (TF) that mediates the effects of MCS on genes whose expression levels are time-dependent. Using ChIP-Atlas enrichment analysis, we narrowed down the list of candidate TFs that bind to the region ±5,000 bp from the transcription start site of genes whose expression differed between ZT2 and ZT14 in control mice and increased by MCS in ZT14. Of these TFs, only KLF4 was expressed in mouse macrophages and affected by the loss of Arntl. The results of RNA-seq, ChIP-Atlas, and RT-qPCR used for this screening are shown in Figure S8 and Table S4. (G) Effects of Arntl KO on the Klf4 mRNA expression of RAW264.7 cells. The mRNA levels were measured 12 h after MCS. (H) Temporal mRNA expression profiles of Klf4 in intraperitoneal macrophages from Control or MCS-treated female BALB/c mice. (I,J) The expression levels of Gba and Rad3d mRNA levels in the vehicle or sh-Klf4 lentivirus transducted-mouse macrophages. The expression levels of KLF4 protein and Klf4 mRNA in each cell are illustrated in Figure S9. (K) Influence of sh-Klf4 lentivirus transduction on phagocytic activity of intraperitoneal macrophages from Control or MCS-treated female BALB/c mice. The phagocytic activity was measured immediately after the addition of beads 12 h after MCS and co-incubated for another 3 h. Data are expressed as the mean ± S.D. (D: n = 20-80, others: n = 4-6). Statistical significance was determined using two-way ANOVA with Tukey-Kramer post-hoc tests. P-values are shown in each graph. ANOVA: analysis of variance; DEX: dexamethasone; MCS: microcurrent stimulation; KO: knockout; RNA-seq: RNA sequencing; S.D.: standard deviation; ZT: Zeitgeber Time.
Figure 6
Figure 6
Effect of prior MCS treatment on the viability of peritoneally seeded 4T1 cells. (A) Protocol of MCS treatment and 4T1 cell injection. Female BALB/c mice received MCS treatment at ZT2 followed by intraperitoneal injection of 5.0 × 10⁵ GFP-expressing 4T1 cells. (B) Flow cytometry was utilized to assess the expression of macrophage markers CD11b and F4/80. GFP-positive macrophages, indicative of those phagocytosing 4T1 cells, were identified in the R2 region. The right panel illustrates the percentage of GFP positivity in macrophages (Ly6G-, CD11b+, F4/80+). The gating strategy is provided in Figure S19. (C) Counts of the 4T1 cells in collected intraperitoneal cells expressed as a ratio to total macrophages. (D) Protocol of macrophage removal, transplantation of Per1-downregulated macrophages, MCS treatment, and 4T1 cell injection. (E,F) Flow cytometry to assess CD11b and F4/80 expression (E), GFP positivity in macrophages (F; left), and counts of 4T1 cells (F; right) in collected intraperitoneal cells from Per1-downregulated macrophage-transplanted mice. (G) Protocol of 4T1 cell injection into MCS-treated mice and evaluation and collection of intraperitoneal tumor mass. (H) Immunohistochemistry image depicting the tumor mass formed around the portal vein. Nuclei were stained with DAPI, F4/80 with Red, and GFP represents 4T1 cells. Scale bar: 20 μm. (I) Ratio of GFP+ macrophages and the phagocytosed amount per cell in the tumor mass formed around the portal vein. (J) Total number of macrophages in the tumor. (K) Left: image of the removed small intestine. Yellow arrows indicate nodular tumors formed around the portal vein. Right: Number of nodular tumors formed in the abdominal cavity. Mice are ranked according to the number of tumors, with the percentage of mice in each rank depicted for the control and MCS groups, respectively. (L) 4T1-derived GFP fluorescence around the portal vein. The right panel illustrates the proportion of the GFP-positive area. Scale bar: 10 mm. (M) Difference in the expression of Mki67 mRNA in tumors between the control and MCS-treated groups. Data are expressed as the mean ± S.D. (n = 4-7). Statistical significance was determined using two-way ANOVA with Tukey-Kramer post-hoc tests (f) or two-tailed Student's t-tests (B,C, I-M). P-values are shown in each graph. ANOVA: analysis of variance; DAPI: 4′,6-diamidino-2-phenylindole; GFP: green fluorescent protein; MCS: microcurrent stimulation; S.D.: standard deviation; ZT: Zeitgeber Time.
Figure 7
Figure 7
Effect of prior MCS treatment on the viability of peritoneally seeded Hepa1-6 and ID8 cells. (A) Protocol of MCS treatment and Hepa1-6 cell injection. Male C57BL/6J mice received MCS treatment at ZT2 followed by intraperitoneal injection of 5.0 × 10⁶ GFP-expressing Hepa1-6 cells. (B) Flow cytometry was utilized to assess the expression of macrophage markers CD11b and F4/80. GFP-positive macrophages, indicative of those phagocytosing Hepa1-6 cells, were identified in the R2 region. The right panel illustrates the percentage of GFP positivity in macrophages (Ly6G-, CD11b+, F4/80+). The gating strategy is provided in Figure S19. (C) Counts of Hepa1-6 cells in collected intraperitoneal cells presented as a ratio to total macrophages. (D) Protocol of Hepa1-6 cell injection into MCS-treated male C57BL/6J mice and evaluation and collection of intraperitoneal tumor mass. (E) The ratio of GFP+ macrophages and the phagocytosed amount per cell in the tumor mass formed around the portal vein. (F) Total number of macrophages in the tumor. (G) Image of the removed small intestine of Hepa1-6-transplanted male mice. Yellow arrows indicate nodular tumors and yellow circles indicate tumors with visible capillaries. (H) Hepa1-6-derived GFP fluorescence around the portal vein in male mice. The right panel shows the proportion of the GFP-positive area. Scale bar: 10 mm. (I) Protocol of MCS treatment and ID8 cell injection. Female C57BL/6J mice received MCS treatment at ZT2 followed by intraperitoneal injection of 5.0 × 10⁶ GFP-expressing ID8 cells. (J) Flow cytometry was utilized to assess the expression of macrophage markers CD11b and F4/80. GFP-positive macrophages, indicative of those phagocytosing ID8 cells, were identified in the R2 region. The right panel illustrates the percentage of GFP positivity in macrophages (Ly6G-, CD11b+, and F4/80+). The gating strategy is provided in Figure S19. (K) Counts of ID8 cells in collected intraperitoneal cells presented as a ratio to total macrophages. (L) Protocol of ID8 cell injection into MCS-treated female C57BL/6J mice and evaluation and collection of intraperitoneal tumor mass. (M) Ratio of GFP+ macrophages and the phagocytosed amount per cell in the tumor mass formed around the portal vein. (N) Total number of macrophages in the tumor. (O) Left: Photographic image of the removed small intestine of ID8-transplanted female mice. Yellow circles indicate nodular tumors. Right: The number of the tumor mass formed around the portal vein. (P) The number of ID8 cells as a percentage of the total number of cells in the tumor mass, as measured by flow cytometry. Data are expressed as the mean ± S.D. (n = 4-7). Statistical significance was determined using two-tailed Student's t-tests. P-values are shown in each graph. GFP: green fluorescent protein; MCS: microcurrent stimulation; S.D.: standard deviation; ZT: Zeitgeber Time.
Figure 8
Figure 8
Effect of MCS on tumor development, immune response, metastasis, and survival rate. (A) MCS treatment protocol in BALB/c mice intraperitoneally injected with 4T1 cells. MCS was administered daily for 1 week starting from the second day post-injection. (B) Immunohistochemistry image depicting tumor mass formation around the portal vein. Nuclei are stained with DAPI (blue), F4/80-positive macrophages are stained in red, and GFP indicates 4T1 cells. Scale bar: 20 μm. (C) Total macrophage count within tumors around the portal vein. (D) Ratio of GFP-positive macrophages and the amount of phagocytosed material per cell within tumors. (E) Ratio of infiltrated CD4+ or CD8+ T cells (CD3+ CD19-) within tumors. (F) Visualization of 4T1-derived GFP fluorescence around the portal vein. The right panel shows the proportion of the GFP-positive area. Scale bar: 10 mm. (G) Left: Image of excised small intestine with yellow arrows indicating nodular tumors around the portal vein. Right: Number of nodular tumors formed in the abdominal cavity. Each mouse is ranked based on tumor count, and the percentage of mice in each rank is presented for control and MCS groups. (H) Differential Mki67 and Tgfβ1 mRNA expression in tumors between control and MCS-treated groups. (I) Difference in caspase-3/7 activity between control and MCS-treated tumors. (J) Difference in Tnfa mRNA expression in tumors between control and MCS-treated groups. (K) Kaplan-Meier survival curves of control and MCS-treated mice intraperitoneally injected with 4T1 cells. (L) MCS treatment protocol in BALB/c mice injected with 4T1 cells via the tail vein. MCS was administered daily for 1 week starting from the second day post-injection. For panels M-O, the mice were used 18 days after 4T1 transplantation. (M) The 4T1-derived GFP-positive area around the portal vein in control and MCS-treated mice injected with 4T1 via the tail vein. Representative images are shown in Figure S11A. (N) The number of pulmonary tumor colonies in control and MCS-treated mice injected with 4T1 via the tail vein. The left panels show representative images of pulmonary tumor colonies. The right panel shows the quantification of the number of tumor colonies in the lungs. (O) The quantification of the area of metastatic colonies isolated from tumor-bearing mice femora bone marrow. Representative photographs of tumor colonies are shown in Figure S11B. Data are expressed as mean ± S.D. (n = 4-7). Statistical significance was determined using two-tailed Student's t-tests. P-values are shown in each graph. ANOVA: analysis of variance; DAPI: 4′,6-diamidino-2-phenylindole; GFP: green fluorescent protein; MCS: microcurrent stimulation; S.D.: standard deviation.

Similar articles

Cited by

References

    1. Schmid P, Adams S, Rugo HS, Schneeweiss A, Barrios CH, Iwata H. et al. Atezolizumab and nab-paclitaxel in advanced triple-negative breast cancer. N Engl J Med. 2018;379:2108–21. - PubMed
    1. Larkin J, Chiarion-Sileni V, Gonzalez R, Grob JJ, Cowey CL, Lao CD. et al. Combined nivolumab and ipilimumab or monotherapy in untreated melanoma. N Engl J Med. 2015;373:23–34. - PMC - PubMed
    1. Horn L, Mansfield AS, Szczęsna A, Havel L, Krzakowski M, Hochmair MJ. et al. First-line atezolizumab plus chemotherapy in extensive-stage small-cell lung cancer. N Engl J Med. 2018;379:2220–9. - PubMed
    1. Veillette A, Chen J. SIRPα-CD47 Immune checkpoint blockade in anticancer therapy. Trends Immunol. 2018;39:173–84. - PubMed
    1. Anderson NR, Minutolo NG, Gill S, Klichinsky M. Macrophage-based approaches for cancer immunotherapy. Cancer Res. 2021;81:1201–8. - PubMed

Publication types