. 2025 Jan 1;15(2):707-725.
doi: 10.7150/thno.101658. eCollection 2025.

A molecularly distinct cell type in the midbrain regulates intermale aggression behaviors in mice

Affiliations

A molecularly distinct cell type in the midbrain regulates intermale aggression behaviors in mice

Chunyang Li et al. Theranostics. .

Abstract

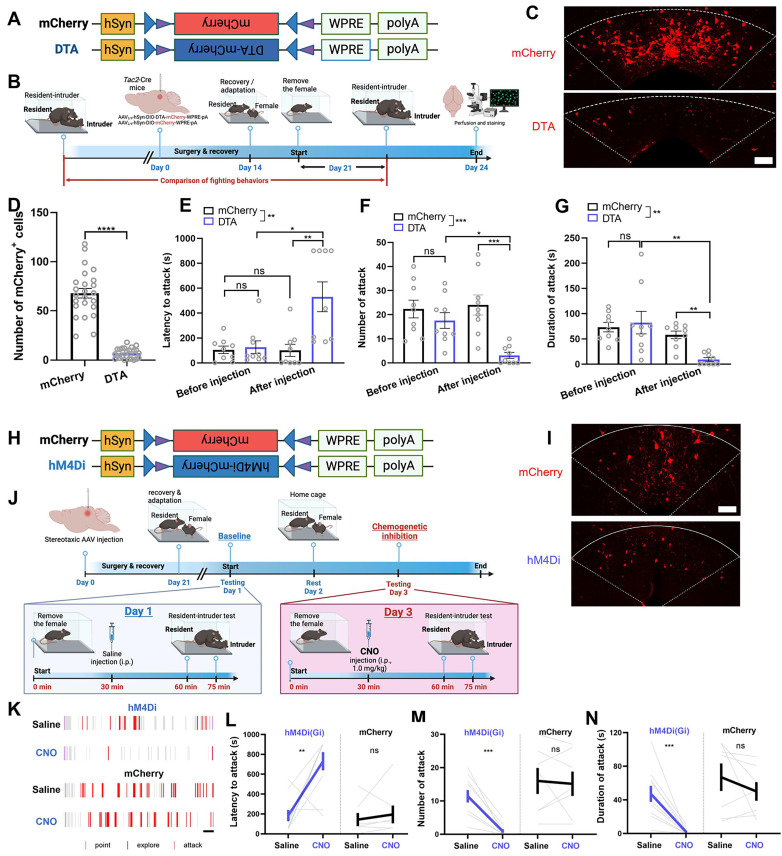
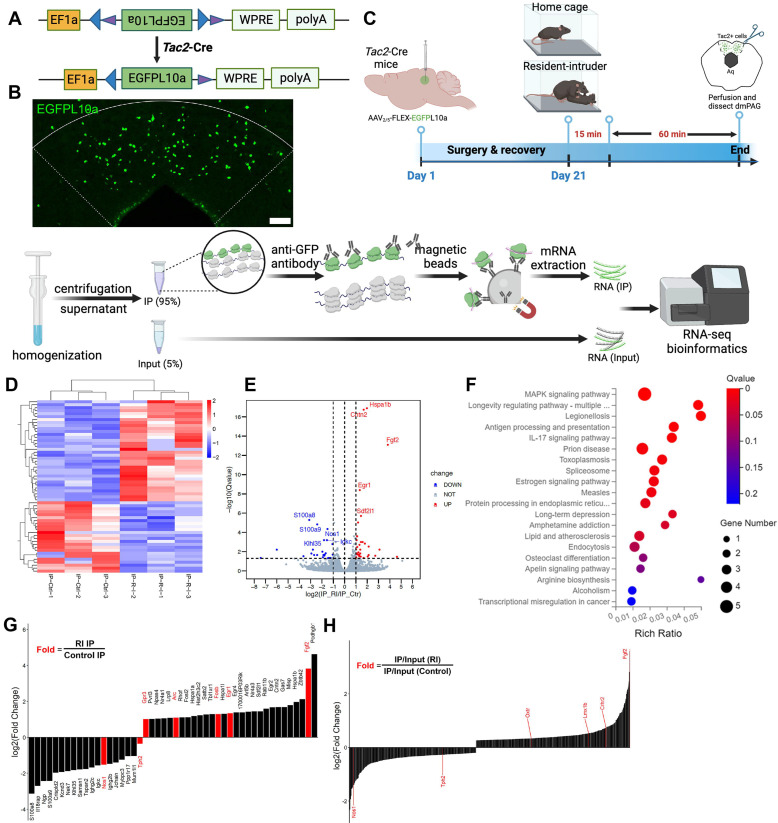
Rationale: The periaqueductal gray (PAG) is a central hub for the regulation of aggression, whereas the circuitry and molecular mechanisms underlying this regulation remain uncharacterized. In this study, we investigate the role of a distinct cell type, Tachykinin 2-expressing (Tac2+) neurons, located in the dorsomedial PAG (dmPAG) and their modulation of aggressive behavior in mice. Methods: We combined activity mapping, in vivo Ca2+ recording, chemogenetic and pharmacological manipulation, and a viral-based translating ribosome affinity purification (TRAP) profiling using a mouse resident-intruder model. Results: We revealed that dmPAGTac2 neurons are selectively activated by fighting behaviors. Chemogenetic activation of these neurons evoked fighting behaviors, while inhibition or genetic ablation of dmPAGTac2 neurons attenuated fighting behaviors. TRAP profiling of dmPAGTac2 neurons revealed an enrichment of serotonin-associated transcripts in response to fighting behaviors. Finally, we validated these effects by selectively administering pharmacological agents to the dmPAG, reversing the behavioral outcomes induced by chemogenetic manipulation. Conclusions: We identify dmPAGTac2 neurons as critical modulators of aggressive behavior in mouse and thus suggest a distinct molecular target for the treatment of exacerbated aggressive behaviors in populations that exhibit high-level of violence.

Keywords: Aggression; Periaqueductal gray; Tachykinin; Translating ribosome affinity purification.


Conflict of interest statement

Competing Interests: The authors have declared that no competing interest exists.

Figures

Figure 1
Figure 1
PAG Tac2-expressing neurons are mainly located in the dmPAG. (A) Schematic showing breeding strategy to selectively express tdTomato reporter in Tac2+ cells. (B) Whole-brain analysis of Tac2tdTomato cell density, showing high expression levels in the MHb, HPF, dmPAG. N=3 mice, with 4 brain sections from each mouse. (C) Representative fluorescent images showing tdTomato-labeled Tac2+ cells (red) in coronal brain sections in Tac2-Cre/Ai9 mice (upper panels) and in their respective ABA images (lower panels). Scale bar, 500 μm. (D) Distribution pattern of Tac2+ cells in the PAG subregions. Scale bars, 1,000 μm (left) and 100 μm (right, enlarged view), respectively. (E) Analysis of Tac2tdTomato cells in PAG subregions. N=5 mice, with 4 brain sections from each mouse. (F) Pie chart showing percentage of Tac2tdTomato cells in PAG subregions. A total of 648 Tac2+ cells were included from N = 3 mice. Data were expressed as mean ± S.E.M. Significance was calculated by One-way ANOVA and Tukey's multiple comparisons test, ****P < 0.0001. Abbreviations: OB: Olfactory bulb; NAc: nucleus accumbens; BNST: bed nuclei of the stria terminalis; MPO: medial preoptic area; MPN: medial preoptic nucleus; AHN: anterior hypothalamic nucleus; LHA: lateral hypothalamic area; CeA: central amygdalar nucleus; MeA: medial amygdalar nucleus; HPF: hippocampal formation; MHb: medial habenula; BLA: basolateral amygdalar nucleus; ARH: arcuate hypothalamic nucleus; VMH: ventromedial hypothalamic nucleus; DMH: dorsomedial nucleus of the hypothalamus; dmPAG: dorsomedial periaqueductal gray.
Figure 2
Figure 2
dmPAG neurons respond to aggression. (A) Strategy for mapping c-Fos expression in WT mice subjected to the RI test. (B) c-Fos activation in dmPAG of mice from various groups. Scale bar, 100 μm. (C) Number of c-Fos+ cells in the dmPAG of WT mice. N = 3 mice/group, with 4 brain sections from each mouse. (D) Strategy for in vivo fiber photometry in WT mice injected with AAV-hSyn-GCaMP6m. (E) Fiber position targeting the dmPAG of WT mice. Scale bar, 50 μm. (F) Distribution of attack behavior synchronized with ΔF/F%. (G) Heatmap showing Ca2+ activity time-locked to an attack episode. x-axis shows 4 sec prior to and 8 sec after the attack episode (red arrow). (H) Representative Ca2+ trace showing one trial of Ca2+ activity in a WT mouse during the RI test. Scale bar: 10s in x-axis and 2000 A.U. in y-axis. Baseline (bottom trace): reference control channel (405 nm); upper trace, Ca2+ channel (470 nm). Red shaded areas indicate attack episodes and durations. Data represent mean ± S.E.M. Significance was calculated by One-way ANOVA and Tukey's multiple comparisons test, ***P < 0.001, ****P < 0.0001.
Figure 3
Figure 3
Tac2-expressing neurons in dmPAG respond to aggression. (A) Vector information for AAV-hSyn-DIO-mCherry. (B) Strategy for examining activation of Tac2+ neuron by fighting behaviors. AAV vector was injected to Tac2-Cre mice to drive mCherry expression in dmPAGTac2 neurons. (C) c-Fos expression (green) in dmPAGTac2 neurons (red mCherry labeled) in Tac2-Cre mice subjected to the RI test. Lower panels showing enlarged view from the white box in the upper panel. Scale bars, 50 μm (upper), 20 μm (lower), respectively. (D) Vector information for AAV-hSyn-DIO-GCaMP6m in Tac2-Cre mice. (E) Strategy for in vivo fiber photometry in Tac2-Cre mice injected with Cre-dependent AAV-GCaMP6m vector. (F) Fiber position targeting dmPAG region of Tac2 mice. Scale bar, 50 μm. (G) Example recording of dmPAGTac2 neurons during the RI test. Color shades indicate different behavioral syllables during intruder encounter. Scale bar: 60s in x-axis, 1.5% GCaMP6m ΔF/F signal in Y-axis. (H-O) Ca2+ activity time-locked to attack (H-I), sniffing (J-K), grooming (L-M) and tail rattling (N-O). (H) Distribution of attack events (top), heatmap of GCaMP6m ΔF/F signals (middle) and ΔF/F% (bottom), (I) Analysis of peak ΔF/F before (Pre) and after (Post) each attack episode. The other panels present the same manner but with different behavioral syllables, including sniffing (J-K), grooming (L-M), and tail rattle (N-O). Data represent mean ± S.E.M. Paired t-test, ***P < 0.001; ns, no significance.
Figure 4
Figure 4
Ablation or inhibition of dmPAGTac2 neurons suppresses fighting behaviors. (A) A Cre-dependent DTA vector or its control vector to be expressed in dmPAGTac2 neurons. (B) Strategy for genetic ablation. (C) Validation of DTA (bottom) and control AAV (upper) in Tac2-Cre mouse. Scale bar, 100 μm. (D) Number of mCherry+ cells in dmPAG in Tac2-Cre mice receiving genetic ablation. N = 6 mice, with 4 brain sections from each mouse. (E-G) Analysis of latency to attack (E), number of attack (F) and duration of attack (G). N = 9/group. Significance was calculated with Two-way RM ANOVA followed by Tukey's multiple comparisons test. *P < 0.05, **P < 0.01, ***P < 0.001. (H) A Cre-dependent hM4Di vector or its control to be expressed in dmPAGTac2 neurons. (I) Representative fluorescent images of mCherry (upper) or hM4Di-mCherry (bottom). Scale bar, 100 μm. (J) Strategy for the RI test in Tac2-Cre mice receiving inhibitory DREADDs vectors. (K) Raster plots showing mouse attack (red bar) or exploring behaviors (gray bar) during the RI assay. Scale, 1 minute. (L-N) Analysis of latency to attack (L), number of attack (M) and duration of attack (N). N = 10 in Tac2hM4Di group and N = 7 in Tac2mCherry group. Data represent mean ± S.E.M. Significance was calculated by means of paired t-test. **P < 0.01, ***P < 0.001; ns, no significance.
Figure 5
Figure 5
Chemogenetic activation of dmPAGTac2 neurons elicits fighting behaviors. (A) A Cre-dependent hM3Dq vector or its control vector to be expressed in dmPAGTac2 neurons. (B) Representative fluorescent images of hM3Dq-mCherry (bottom) or mCherry (upper) in dmPAGTac2 neurons. Scale bar, 100 μm. (C) Activation of dmPAGTac2 neurons in Tac2hM3Dq and control Tac2mCherry mice following intraperitoneal administration of CNO and normal saline, respectively (red: mCherry; green: c-Fos; blue: Hoechst). Scale bars, 50 μm (left) and 10 μm (enlarged right panel), respectively. (D) Number of mCherry+ cells in c-Fos+ neurons in Tac2-Cre mice receiving CNO injection (0.5 mg/kg, i.p.). N=3 mice, with 4 brain sections from each mouse. (E) Strategy for the RI test in Tac2-Cre mice receiving DREADDs vectors. (F) Raster plots showing mouse attack (red) or exploring behavior (gray) during the RI test. Time scale, 1 minute. (G-I) Analysis of latency to attack (G), number of attack (H), and duration of attack (I). N = 10 in Tac2hM3Dq group and N = 7 in Tac2mCherry group. Data represent mean ± S.E.M. Significance was calculated by means of paired t-test. **P < 0.01, ***P < 0.001, ****P < 0.0001.
Figure 6
Figure 6
TRAP-seq reveals transcriptional alterations following fighting behaviors. (A) A Cre-dependent TRAP (AAV-FLEX-EGFPL10a) vector to be expressed in Tac2-Cre mice. (B) Representative fluorescent images of EGFPL10a protein (green) in dmPAG. Scale bar, 100 μm. (C) Strategy for TRAP-seq in Tac2-Cre mice injected with AAV-FLEX-EGFPL10a in dmPAG and subjected to the RI assay or maintained at home cage (control). (D) Heatmap showing DEGs of the IP samples. |Log2FC|>1, adjusted q value < 0.05. (E) Volcano plot showing DEGs of the IP samples. (F) KEGG enrichment analysis showing top 20 most enriched pathways affected by RI when compared to the control. (G) Fold-change analysis showing log2(FC) value of RI-IP to Control-IP samples. Genes labeled in red are immediate-early genes (Gpr3, Arc, Fosb, Egr1, Fgf2) or genes related to the 5-HT system. (H) A secondary analysis of enrichment score, based on normalizing IR/Input (RI) to IR/Input (Control). Note that Nos1, Tph2, Oxtr, Lmx1b, Crhr2, and Fgf2 (labeled in red on the left) were listed among the most enriched genes that were related to the 5-HT system.
Figure 7
Figure 7
Pharmacological validation of molecular targets identified by TRAP-seq. (A) Strategy for pharmacological manipulation of the 5-HT system with fluoxetine or CP-93129 to alter fighting behaviors. (B) Representative fluorescent image showing cannula position targeting dmPAG region in Tac2-Cre mice. (C-E) Analysis of latency to attack (C) number of attack (D) and duration of attack (E) in Tac2hM3dq mice injected with fluoxetine/vehicle and CNO/saline in the dmPAG. N = 9 mice/group. (F-H) Analysis of latency to attack (F) number of attack (G) and duration of attack (H) in Tac2hM3dq mice injected with CP-93129/vehicle and CNO/saline in the dmPAG. N = 10 mice/group. Data represent mean ± SEM. Significance was calculated by means of paired t-test. *P < 0.05, **P < 0.01, ***P < 0.001, ****P < 0.0001.

Similar articles

Cited by

References

    1. Motta SC, Carobrez AP, Canteras NS. The periaqueductal gray and primal emotional processing critical to influence complex defensive responses, fear learning and reward seeking. Neurosci Biobehav Rev. 2017;76:39–47. - PubMed
    1. Silva C, McNaughton N. Are periaqueductal gray and dorsal raphe the foundation of appetitive and aversive control? A comprehensive review. Prog Neurobiol. 2019;177:33–72. - PubMed
    1. Chen Z, Chen X, Liu M, Liu S, Yu S, Ma L. Magnetic Resonance Image Texture Analysis of the Periaqueductal Gray Matter in Episodic Migraine Patients without T2-Visible Lesions. Korean J Radiol. 2018;19:85–92. - PMC - PubMed
    1. Hunsperger RW, Bucher VM. Affective behaviour by electrical stimulation in the forebain and brain stem of the cat. Prog Brain Res. 1967;27:103–27. - PubMed
    1. Hunsperger RW. [Affective reaction from electric stimulation of brain stem in cats] Helv Physiol Pharmacol Acta. 1956;14:70–92. - PubMed

Publication types

LinkOut - more resources