. 2025 Jan 15;138(2):jcs263541.
doi: 10.1242/jcs.263541. Epub 2025 Jan 24.

Cell migration signaling through the EGFR-VAV2-Rac1 pathway is sustained in endosomes

Affiliations

Cell migration signaling through the EGFR-VAV2-Rac1 pathway is sustained in endosomes

Itziar Pinilla-Macua et al. J Cell Sci. .

Abstract

Ligand binding to EGFR activates Rho family GTPases, triggering actin cytoskeleton reorganization, cell migration and invasion. Activated EGFR is also rapidly endocytosed but the role of EGFR endocytosis in cell motility is poorly understood. Hence, we used live-cell microscopy imaging to demonstrate that endogenous fluorescently labeled VAV2, a guanine nucleotide exchange factor for Rho GTPases, is co-endocytosed with EGFR in genome-edited human oral squamous cell carcinoma (HSC3) cells, an in vitro model for head-and-neck cancer where VAV2 is known to promote metastasis and is associated with poor prognosis. Chemotactic migration of HSC3 cells toward an EGF gradient is found to require both VAV2 and clathrin-mediated endocytosis. Moreover, sustained activation of Rac1, a Rho family GTPase promoting cell migration and a major substrate of VAV2, also depends on clathrin. Endogenous fluorescently labeled Rac1 localizes to EGFR-containing endosomes. Altogether, our findings suggest that signaling through the EGFR-VAV2-Rac1 pathway persists in endosomes and that this endosomal signaling is required for EGFR-driven cell migration.

Keywords: Cell motility; EGFR; Endocytosis; Rac1; VAV2.


Conflict of interest statement

Competing interests The authors declare no competing or financial interests.

Figures

Fig. 1.
Fig. 1.
Labeling of endogenous VAV2 with mNG in HSC3 cells and its EGF-dependent phosphorylation. (A) Schematics of the insertion of the mNG sequence into the endogenous locus in VAV2 gene. HA, homology arm. (B) Lysates of parental (par) HSC3 and pooled HSC3 mNG-VAV2 cells were probed by western blotting (WB) with anti-VAV2 and -EGFR (loading control) antibodies. (C) Parental HSC3 cells and HSC3 mNG-VAV2 cells were serum starved and treated with 4 ng/ml EGF for indicated times at 37°C. Cells were lysed, and VAV2 was immunoprecipitated (IP). Immunoprecipitates and aliquots of lysates (20%) were electrophoresed and probed by western blotting with antibodies to phosphotyrosine (pY20), EGFR and VAV2. Blots in B and C representative of two to four repeats.
Fig. 2.
Fig. 2.
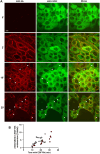
Localization dynamics of endogenous mNG–VAV2 during cell stimulation with EGF–Rh. (A) HSC3 mNG–VAV2 cells were serum starved and incubated with 4 ng/ml EGF–Rh at 37°C for the indicated times. 3D live-cell imaging was performed through 488-nm (green; mNG–VAV2), 561-nm (red; EGF–Rh) and 640-nm (autofluorescence, see Fig. S1A) channels. Fluorescence intensity scales are identical at all time points. Individual confocal sections are shown. Examples of colocalization of mNG–VAV2 and EGF–Rh in endosomes are indicated by arrowheads. ', minute. Scale bar: 10 μm. (B) Quantification of colocalization of mNG–VAV2 with EGF–Rh in endosomes. The fractions of total mNG–VAV2 colocalized with EGF–Rh were calculated from images as shown in A in three independent time-course experiments (indicated by different colored symbols). Each data point represents a single field of view (FOV).
Fig. 3.
Fig. 3.
Internalized EGF–Rh and mNG–VAV2 are predominantly located in early, sorting and recycling endosomes during the first hour of continuous endocytosis. mNG–VAV2 cells were serum starved and pretreated with Trf–A647 and LysotrackerBlue (LT) for 5 min. The cells were then incubated with EGF–Rh (4 ng/ml) and Trf–A647 (5 µg/ml) at 37°C for 20 min (A) or 60 min (B). 3D live-cell imaging was performed through 405-nm (blue, LT), 488-nm (green, mNG-VAV2), 561-nm (red, EGF–Rh) and 640-nm (blue, Trf–A647) channels. Dotted circles indicate examples of EGF–Rh, mNG–VAV2 and Trf–A647 colocalization (without or with LT, presumably, early and sorting endosomes, respectively), whereas unbroken circles show colocalization of EGF–Rh, mNG–VAV2 and LT but not with Tfr–A647 (presumably, late endosomes and lysosomes). Scale bars: 10 µm. (C) Quantification of the fraction of mNG–VAV2 colocalized with EGF–Rh and Trf–A647 (without and with LT; ‘early, sorting and recycling endosomes’) or LT (late endosomes and lysosomes, no Trf–A647) from images as shown in A and B. The data points represent mean±s.e.m. from 5–6 FOVs at each time point. Error bars are not shown if they are smaller than symbols. This experiment is representative of three independent time-course experiments.
Fig. 4.
Fig. 4.
VAV2 is necessary for EGF-directed chemotactic migration and EGF-dependent substrate spreading of HSC3 cells but not for EGFR endocytosis. (A) Lysates of parental HSC3 (Par), mNG–VAV2 and VAV2KO cells were resolved by western blotting (WB) and probed with anti-VAV2 and -GAPDH (loading control) antibodies. Blots representative of three repeats. (B) Parental HSC3 and VAV2KO cells (left) or mNG–VAV2 and VAV2KO cells (right) were plated in the upper chamber of pre-treated Transwell inserts (105 cells/insert). Medium with or without 4 ng/ml EGF was added to the bottom compartment of wells. Cells were incubated for 4 h at 37°C to allow cell migration to the bottom surface of Transwell inserts, fixed and stained with Crystal Violet. Cells that had migrated to the bottom surface of Transwell inserts were imaged. Bar graphs represent mean±s.e.m. numbers of cells per FOV (6 FOVs per insert; n=3 inserts). (C) Combined analysis of multiple migration experiments as per B. Bar graph represents mean±s.e.m. numbers of migrated cells per FOV in each individual Transwell insert normalized to the mean number of migrated cells per FOV in ‘+EGF’ inserts in each independent experiment (total n=6–13 inserts per condition). P-values in B and C were calculated using one-way ANOVA followed by a Tukey's multiple comparison test. (D) mNG–VAV2 and VAV2KO cells were plated onto coverslips for 1 h, fixed and stained with phalloidin–TxR. A z-stack of images was acquired through the 561-nm laser channel. Examples of representative maximum intensity projection images are shown. Scale bars: 10 µm. Quantifications of the total area of individual cell footsteps were performed using maximum intensity projection images as described in the Materials and Methods and are shown in the graph below images. Mean±s.d. are shown. Each data point represents an individual cell. This experiment is representative of two independent experiments. P values were calculated using one-way ANOVA followed by a Tukey's multiple comparison test. (E) Parental HSC3 and VAV2KO cells were incubated with 4 ng/ml EGF–Rh at 37°C for 15 min, and live-cell imaging was performed. Maximum fluorescence intensity projections (MIPs) of z-stack of confocal images are shown. Images are representative of five to ten repeats. Scale bars: 10 µm.
Fig. 5.
Fig. 5.
Inhibition of CME decreases EGF-guided migration of cells. (A) mNG–VAV2 cells were transfected with non-targeting (siNT) and clathrin heavy chain (CHC)-targeting siRNA (siCHC). Cells were incubated with 4 ng/ml EGF–Rh at 37°C for 15 min, and live-cell imaging was performed. Scale bars: 10 µm. Maximum fluorescence intensity projections (MIPs) of z-stack of confocal planes are shown. (B) Parental HSC3, mNG–VAV2 and VAV2KO cells transfected with siNT or siCHC were plated in the upper chamber of pre-treated Transwell inserts (105 cells/insert). Medium with or without 4 ng/ml EGF was added to the bottom compartment of wells. Cells were incubated for 4 h at 37°C to allow cell migration to the bottom surface of Transwell inserts, fixed and stained with Crystal Violet. Cell migrated to the bottom surface of Transwell inserts were imaged and counted. Bar graphs represent mean±s.e.m. numbers of cells per FOV normalized to the mean number in siNT-transfected cells stimulated with EGF in each individual experiment for mNG–VAV2 and parental HSC3 cells. The number of migrated VAV2KO cells were normalized to the mean number of EGF-treated siNT parental HSC3 cells in each experiment. The data are combined from two or three independent experiments for each cell clone (10–11 FOVs per experimental variant). P-values were calculated using one-way ANOVA followed by a Tukey's multiple comparison test. Differences between the numbers of siNT- and siCHC-transfected EGF-untreated cells (parental and mNG-VAV2) were not significant. (C) Example of CHC knockdown efficiency. Lysates of parental HSC3 cells transfected with siNT or siCHC were resolved by SDS-PAGE and probed with CHC and Akt (loading control) antibodies.
Fig. 6.
Fig. 6.
CME is required for sustained VAV2-dependent Rac1 activation by EGFR. (A) Parental HSC3 cells were transfected with non-targeting (siNT) and CHC targeting siRNA (siCHC). The cells were stimulated with 10 ng/ml EGF for indicated times, and GTP-loaded Rac1 (Rac1-GTP) was pulled down from cell lysates with GST–PBD. Pulldowns and aliquots of lysates were resolved by SDS-PAGE and probed with Rac1 and β-actin antibodies (loading control). (B) Quantification of the amount of Rac1-GTP pulled down from six independent experiments as shown in A. The amount of Rac1-GTP (pulldowns) was corrected by the amount of β-actin in corresponding lysates. The amount of corrected Rac1-GTP at time ‘0’ was subtracted from these amounts at other time points in each individual time-course experiment. The resulting values are expressed as a percentage of the maximal Rac1-GTP amount in siNT-transfected cells within each time-course experiment. Mean±s.e.m. (n=6) is presented. P-values for individual time-points were calculated using an unpaired two-tailed Student's t-test against siNT-transfected cells. (C) Example of CHC knockdown efficiency in experiments described in A and B. Lysates of parental HSC3 cells transfected with siNT or siCHC were resolved by SDS-PAGE and probed with CHC and α-actinin (loading control) antibodies. Duplicate lysates are shown. Efficiency of CHC depletion was 70±3.6% (mean±s.e.m; n=6). (D) mNG–VAV2 and VAV2KO cells were stimulated with 10 ng/ml EGF for the indicated times, and GTP-loaded Rac1 (Rac1-GTP) was pulled down from cell lysates with GST–PBD. Pulldowns and aliquots of lysates were resolved by SDS-PAGE and probed with anti-Rac1 and -β-actin antibodies (loading control). (E) Quantification of the amount of Rac1-GTP from three independent experiments exemplified as shown in D. The amount of Rac1-GTP (pulldowns) was corrected by the amount of β-actin in corresponding lysates. The minimum amount of corrected Rac1-GTP detected in each experiment was subtracted from corrected Rac1-GTP amounts at other time-points and variants in the same experiment. The resulting values are expressed as a percentage of the maximum Rac1-GTP amount in siNT-transfected cells in each experiment. Mean±s.e.m. (n=3) is presented. P-values for individual time-points were calculated using unpaired two-tailed Student's t-test.
Fig. 7.
Fig. 7.
mNG–Rac1 is localized in EGF-containing endosomes. HSC3 mNG–Rac1 cells were serum starved and treated with 4 ng/ml EGF–Rh at 37°C for the indicated times. 3D live-cell imaging was performed through 488-nm (green, mNG-Rac1) and 561-nm (red, EGF–Rh) channels. 488-nm channel images were deconvolved using the constrained iterative algorithm of SlideBook. Maximum fluorescence intensity projections (MIPs) of two confocal sections (0 and 2 min – proximal to ventral cell membrane; and 20 and 35 min – through the middle of the z-stack) are shown. Gamma is set to 0.5 in all 488-nm channel images for better visualization of the distribution of the low-intensity mNG fluorescence. Arrows indicate examples of the vesicular puncta of EGF–Rh containing mNG-Rac1. Images on the right are high magnification images of the regions indicated by white rectangles. Images are representative of four repeats. ', minute. Scale bars: 10 μm.

Similar articles

References

    1. Abe, K., Rossman, K. L., Liu, B., Ritola, K. D., Chiag, D., Campbell, S. L., Burridge, K. and Der, C. J. (2000). Vav2 is an activator of Cdc42, Rac1, and RhoA. J. Biol. Chem. 275, 10141-10149. 10.1074/jbc.275.14.10141 - DOI - PubMed
    1. Benard, V., Bohl, B. P. and Bokoch, G. M. (1999). Characterization of Rac and Cdc42 activation in chemoattractant-stimulated human neutrophils using a novel assay for active GTPases. J. Biol. Chem. 274, 13198-13204. 10.1074/jbc.274.19.13198 - DOI - PubMed
    1. Bustelo, X. R. (2014). Vav family exchange factors: an integrated regulatory and functional view. Small GTPases 5, 9. 10.4161/21541248.2014.973757 - DOI - PMC - PubMed
    1. Calora, M. J., Wang, H. and Kazanietz, M. G. (2003). Characterization of the Rac-GAP (Rac-GTPase-activating protein) activity of β2-chimaerin, a ‘non-protein kinase C’ phorbol ester receptor. Biochem. J. 375, 313-321. 10.1042/bj20030727 - DOI - PMC - PubMed
    1. Duan, L., Raja, S. M., Chen, G., Virmani, S., Williams, S. H., Clubb, R. J., Mukhopadhyay, C., Rainey, M. A., Ying, G., Dimri, M.et al. (2011). Negative regulation of EGFR-Vav2 signaling axis by Cbl ubiquitin ligase controls EGF receptor-mediated epithelial cell adherens junction dynamics and cell migration. J. Biol. Chem. 286, 620-633. 10.1074/jbc.M110.188086 - DOI - PMC - PubMed