. 2025 Jan 2;135(1):e177793.
doi: 10.1172/JCI177793.

A single-cell compendium of human cerebrospinal fluid identifies disease-associated immune cell populations

Affiliations

A single-cell compendium of human cerebrospinal fluid identifies disease-associated immune cell populations

Claudia Cantoni et al. J Clin Invest. .

Abstract

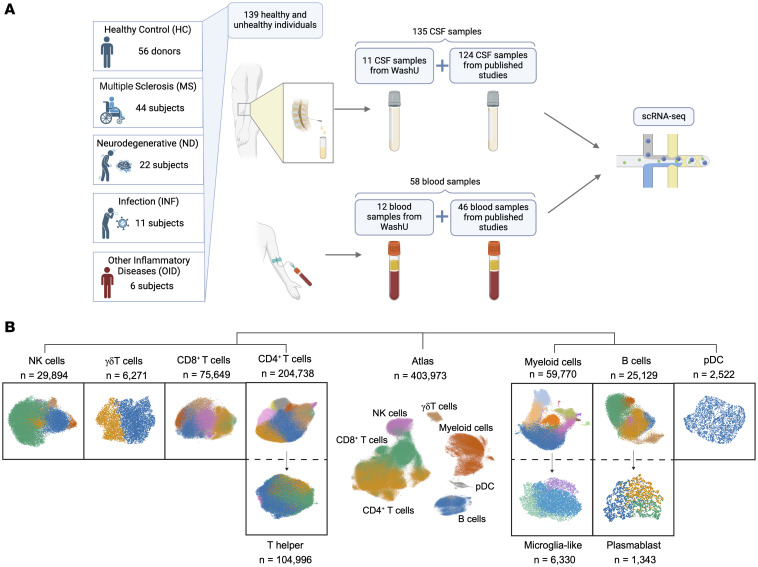
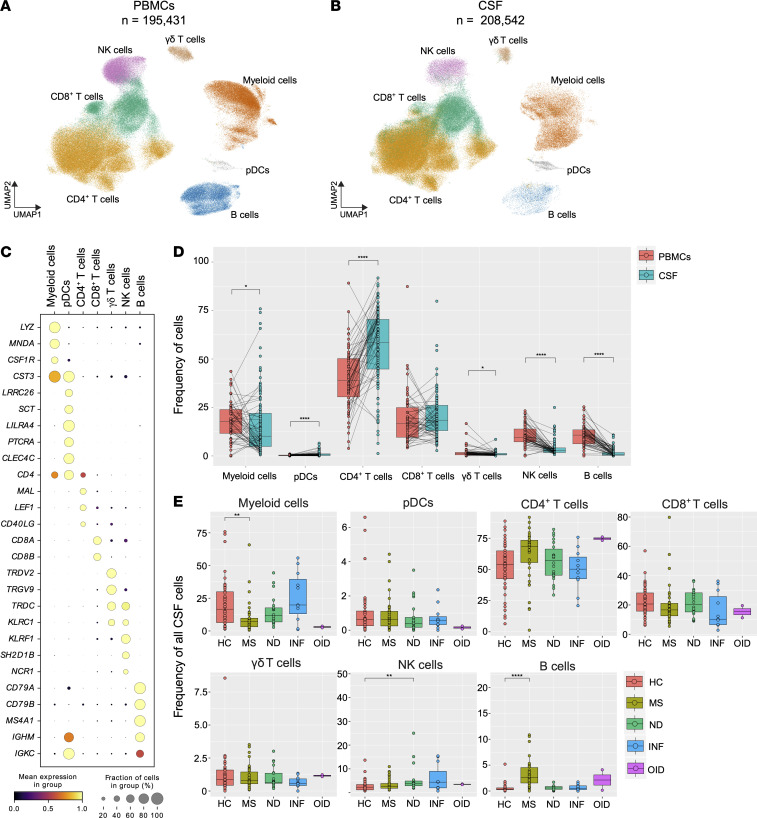
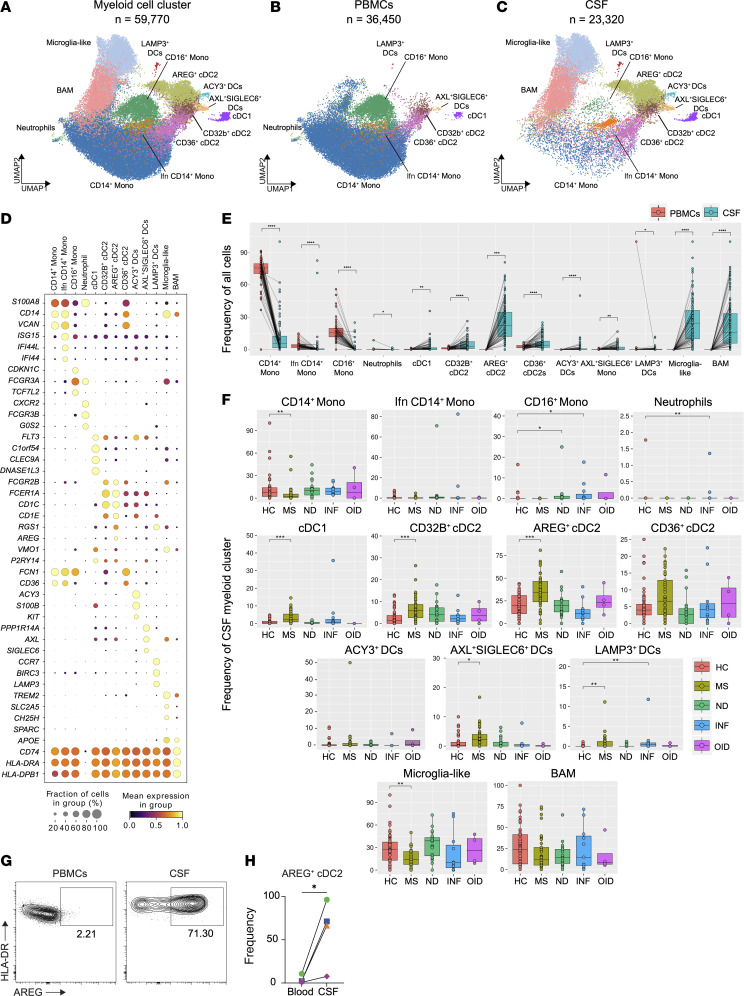
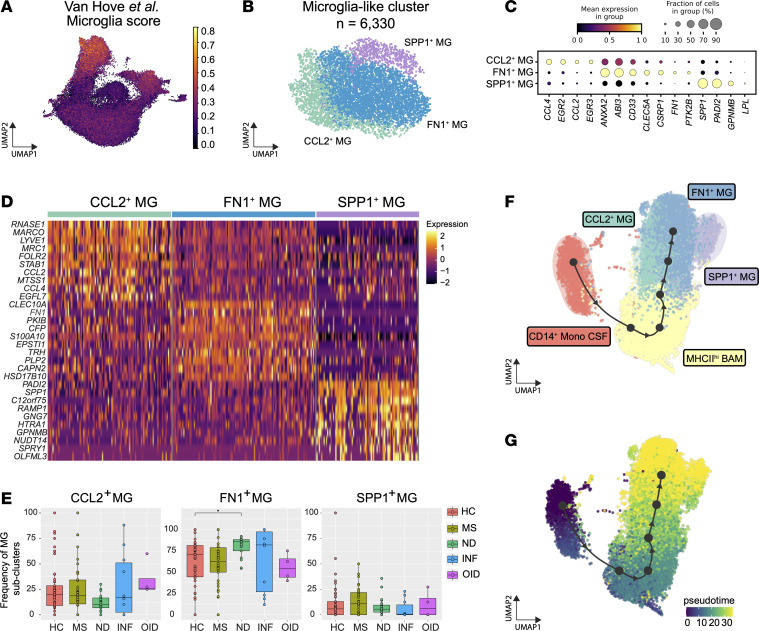
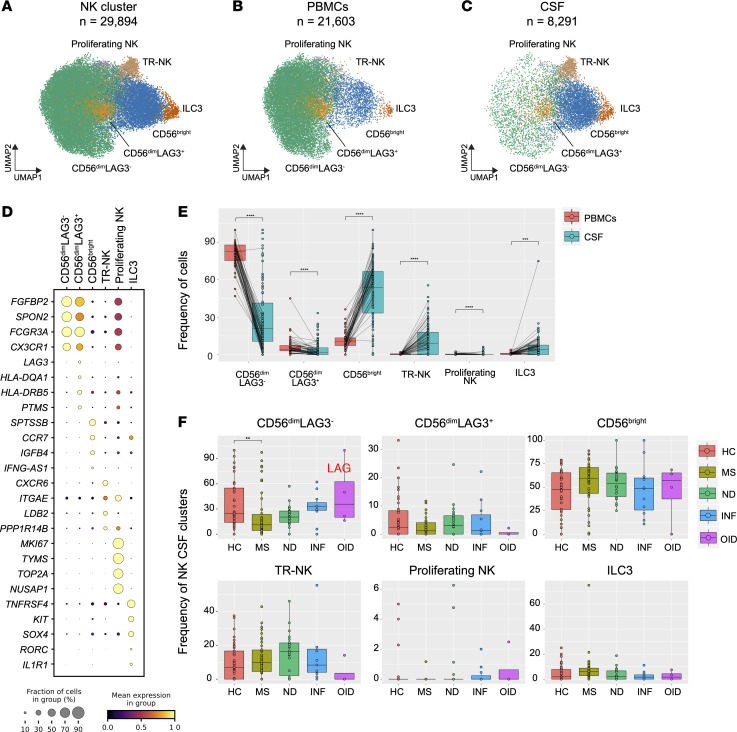
Single-cell transcriptomics applied to cerebrospinal fluid (CSF) for elucidating the pathophysiology of neurologic diseases has produced only a preliminary characterization of CSF immune cells. CSF derives from and borders central nervous system (CNS) tissue, allowing for comprehensive accounting of cell types along with their relative abundance and immunologic profiles relevant to CNS diseases. Using integration techniques applied to publicly available datasets in combination with our own studies, we generated a compendium with 139 subjects encompassing 135 CSF and 58 blood samples. Healthy subjects and individuals across a wide range of diseases, such as multiple sclerosis (MS), Alzheimer's disease, Parkinson's disease, COVID-19, and autoimmune encephalitis, were included. We found differences in lymphocyte and myeloid subset frequencies across different diseases as well as in their distribution between blood and CSF. We identified what we believe to be a new subset of AREG+ dendritic cells exclusive to the CSF that was more abundant in subjects with MS compared with healthy controls. Finally, transcriptional cell states in CSF microglia-like cells and lymphoid subsets were elucidated. Altogether, we have created a reference compendium for single-cell transcriptional profiling encompassing CSF immune cells useful to the scientific community for future studies on neurologic diseases.

Keywords: Adaptive immunity; Immunology; Innate immunity; Neurological disorders; Neuroscience.


Figures

Figure 1
Figure 1. Cluster hierarchy of overall immune cell type composition from PBMCs and CSF.
(A) Schematic representing study design incorporating PBMC and CSF samples (n = 193) from 139 individuals. (B) Dendrogram of UMAP of PBMC and CSF samples colored by cluster and identified by cell type for deeper analysis. Separate objects for subclusters of CD4+ T cells, myeloid cells, and B cells are shown. Total number of cells per object following quality control processing is depicted. See also Supplemental Table 2.
Figure 2
Figure 2. Differences in composition of major PBMC and CSF cell populations in health and disease.
(A and B) UMAP of PBMC (A) and CSF cell (B) atlases color-coded by main cell clusters. (C) Dot plot of marker genes designating each respective cluster. (D) Percentage of total for each major PBMC and CSF cluster. (E) Percentage of total for each CSF cluster across 5 subject groups including 4 disease states. HC, healthy control; MS, multiple sclerosis; ND, neurodegenerative disease; INF, infectious CNS disease; OID, other inflammatory CNS disease. In D and E, whiskers indicate values within 1.5 × interquartile range from either upper or lower hinge. Horizontal bars represent the median value. In D, the test of pairwise comparisons of cell type percentages in PBMCs and CSF was determined by post hoc Dunn’s test with Benjamini-Hochberg adjustment. In E, significance for pairwise comparisons between HC and all other disease groups was determined by post hoc Dunn’s test with Benjamini-Hochberg adjustment. *Adjusted P value (Padj) < 0.05, **Padj < 0.01, ****Padj < 0.0001.
Figure 3
Figure 3. Cell type diversity and statistical comparison of myeloid cells in PBMCs and CSF between 5 main disease groups.
(A) Overall UMAP of myeloid cells in both PBMCs and CSF combined. (B and C) UMAP of myeloid cells in PBMCs (B) and CSF (C). (D) Dot plot of select marker genes for each respective cluster. (E) Percentages of major clusters in both PBMC and CSF compartments. (F) Proportions of each CSF myeloid cell cluster across disease groups. (G) Representative plots from blood and CSF of AREG+ cDC2s identified as HLA-DR+BDCA-2XCR1CLEC9ACD1c+FCER1A+CD32B+AREG+ cells. (H) Quantification of the AREG+ cDC2 cell frequency in blood and CSF from 4 MS subjects. Each line connects blood and CSF from one subject. In E, the test of pairwise comparisons of cell type percentages in PBMCs and CSF was determined by post hoc Dunn’s test with Benjamini-Hochberg adjustment. In F, significance for pairwise comparisons between HC and all other disease groups was determined by post hoc Dunn’s test with Benjamini-Hochberg adjustment. In H, significance was determined by paired 2-tailed t test. *Padj < 0.05, **Padj < 0.01, ***Padj < 0.001, ****Padj < 0.0001.
Figure 4
Figure 4. Cell population diversity and trajectory analysis of CSF microglia-like cells.
(A) UMAP of the myeloid object is shown colored based on the enrichment score of the transcriptional signature obtained from murine microglia (31). (B) UMAP of CSF microglia-like cell subsets. Each subset is designated MG for microglia-like cells. (C) Dot plot of select marker genes for the microglia-like cell subclusters. (D) Heatmap of aggregated and log-normalized gene expression in each microglia-like cell subcluster. Top 10 genes for each subcluster are shown. (E) Proportions of CSF microglia-like cell subclusters across disease groups. (F) UMAP plot representing select CSF myeloid populations inclusive of CD14+ monocytes, BAMs, and microglia-like cells color-coded by subclusters. (G) UMAP plot of the pseudotime trajectory of the object shown in F. In E, significance for pairwise comparisons between HC and all other disease groups was determined by post hoc Dunn’s test with Benjamini-Hochberg adjustment. *Padj < 0.05.
Figure 5
Figure 5. Cell type diversity and statistical comparison of B cells and plasmablasts in PBMCs and CSF between 5 main disease groups.
(A) Overall UMAP of B cells in both tissues combined. (B and C) UMAP of B cells and plasmablasts in PBMCs (B) and CSF (C) colored by the main clusters. (D) Selection of marker genes represented by dot plot for each respective cluster of B cells and plasmablasts. (E) Percentage of major clusters of B cells and plasmablasts in both PBMCs and CSF. (F) Cell proportions in CSF B cell and plasmablast populations across 5 disease groups. (G) UMAP of plasmablast subcluster in both tissues combined. (H and I) UMAP of plasmablast subcluster in PBMCs (H) and CSF (I). (J) Selection of marker genes represented by dot plot for each plasmablast subcluster. (K) Comparison of plasmablast subcluster percentages between PBMCs and CSF. (L) Cell proportions of each CSF plasmablast subcluster across 5 disease groups. In E and K, the test of pairwise comparisons of cell type percentages in PBMCs and CSF was determined by post hoc Dunn’s test with Benjamini-Hochberg adjustment. In F and L, significance for pairwise comparisons between HC and all other disease groups was determined by post hoc Dunn’s test with Benjamini-Hochberg adjustment. *Padj < 0.05, **Padj < 0.01, ****Padj < 0.0001.
Figure 6
Figure 6. Cell type diversity and statistical comparison of CD4+ T cells in PBMCs and CSF between 5 disease groups.
(A) Overall UMAP of CD4+ T cells in both PBMCs and CSF combined. (B and C) UMAP of CD4+ T cells in PBMCs (B) and CSF (C). (D) Dot plot of select marker genes for each respective cluster. (E) Percentages of major clusters in both PBMCs and CSF compartments. (F) Proportion of each CSF CD4+ T cell cluster across disease groups. In E, the test of pairwise comparisons of cell type percentages in PBMCs and CSF was determined by post hoc Dunn’s test with Benjamini-Hochberg adjustment. In F, significance for pairwise comparisons between HC and all other disease groups was determined by post hoc Dunn’s test with Benjamini-Hochberg adjustment. *Padj < 0.05, ****Padj < 0.0001.
Figure 7
Figure 7. Cell type diversity and statistical comparison of Th CD4+ cells in PBMCs and CSF between 5 main disease groups.
(A) Overall UMAP of Th cells in both PBMCs and CSF combined. (B and C) UMAP of Th cells in PBMCs (B) and CSF (C). (D) Dot plot of marker genes for each respective cluster of Th cells. (E) Enrichment score of the transcriptional signatures obtained from human Th subsets of Th1, Th17, Tfh, Th2, and Th22 cells and initially derived from ref. and ref. 47 by Ostkamp et al., displayed on the CD4+ Th cell subcluster UMAP. (F) Percentages of each CD4+ Th cell subcluster in both PBMC and CSF compartments. (G) Proportion of each CSF CD4+ Th cell cluster across disease groups. Statistical significance of the Th Ifn cluster of the INF group is driven by one outlier (Padj = 0.0091). In F, the test of pairwise comparisons of cell type percentages in PBMCs and CSF was determined by post hoc Dunn’s test with Benjamini-Hochberg adjustment. In G, significance for pairwise comparisons between HC and all other disease groups was determined by post hoc Dunn’s test with Benjamini-Hochberg adjustment. *Padj < 0.05, **Padj < 0.01, ****Padj < 0.0001.
Figure 8
Figure 8. Cell type diversity and statistical comparison of CD8+ and γδ T cells in PBMCs and CSF between neurologic disease groups.
(A) Overall UMAP representation of CD8+ T cells in both tissues combined. (B and C) UMAP of CD8+ T cells in PBMCs (B) and CSF (C). (D) Marker genes represented by dot plot for each respective cluster of CD8+ T cells. (E) Percentage of major subclusters of CD8+ T cells in both PBMCs and CSF. (F) Proportions of CSF CD8+ T cell subclusters across 5 subject groups. (G) UMAP of γδ T cell subclusters in both PBMCs and CSF combined. (H and I) UMAP of γδ T cell subclusters in PBMCs (H) and CSF (I). (J) Marker genes represented by dot plot for each γδ T cell subcluster. (K) Comparison of γδ T cell subcluster percentages between PBMCs and CSF. (L) Proportions of each CSF γδ T cell subcluster across 5 subject groups. In E and K, the test of pairwise comparisons of cell type percentages in PBMCs and CSF was determined by post hoc Dunn’s test with Benjamini-Hochberg adjustment. In F and L, significance for pairwise comparisons between HC and all other disease groups was determined by post hoc Dunn’s test with Benjamini-Hochberg adjustment. *Padj < 0.05, ****Padj < 0.0001.
Figure 9
Figure 9. Cell type diversity and statistical comparison of NK cells in PBMCs and CSF between 5 subject groups.
(A) Overall UMAP of NK cells in PBMCs and CSF combined. (B and C) UMAP of NK cells in PBMCs (B) and CSF (C). (D) Dot plot of select marker genes for each respective subcluster. (E) Percentages of major NK subclusters in PBMC and CSF compartments. (F) Proportion of each CSF NK cell subcluster across subject groups. In E, the test of pairwise comparisons of cell type percentages in PBMCs and CSF was determined by post hoc Dunn’s test with Benjamini-Hochberg adjustment. In F, significance for pairwise comparisons between HC and all other disease groups was determined by post hoc Dunn’s test with Benjamini-Hochberg adjustment. **Padj < 0.01, ***Padj < 0.001, ****Padj < 0.0001.

Similar articles

Cited by

References

    1. Compston A, Coles A. Multiple sclerosis. Lancet. 2008;372(9648):1502–1517. doi: 10.1016/S0140-6736(08)61620-7. - DOI - PubMed
    1. Baker RE, et al. Infectious disease in an era of global change. Nat Rev Microbiol. 2022;20(4):193–205. doi: 10.1038/s41579-021-00639-z. - DOI - PMC - PubMed
    1. Wichmann TO, et al. A brief overview of the cerebrospinal fluid system and its implications for brain and spinal cord diseases. Front Hum Neurosci. 2022;15:737217. doi: 10.3389/fnhum.2021.737217. - DOI - PMC - PubMed
    1. Yamada S, Mase M. Cerebrospinal fluid production and absorption and ventricular enlargement mechanisms in hydrocephalus. Neurol Med Chir (Tokyo) 2023;63(4):141–151. doi: 10.2176/jns-nmc.2022-0331. - DOI - PMC - PubMed
    1. Müller-Miny L, et al. Alemtuzumab treatment exemplifies discordant immune effects of blood and cerebrospinal fluid in multiple sclerosis. J Neuroimmunol. 2023;378:578088. doi: 10.1016/j.jneuroim.2023.578088. - DOI - PubMed

MeSH terms