. 2025 Jan 2;135(1):e181630.
doi: 10.1172/JCI181630.

Cardiac fibroblast BAG3 regulates TGFBR2 signaling and fibrosis in dilated cardiomyopathy

Affiliations

Cardiac fibroblast BAG3 regulates TGFBR2 signaling and fibrosis in dilated cardiomyopathy

Bryan Z Wang et al. J Clin Invest. .

Abstract

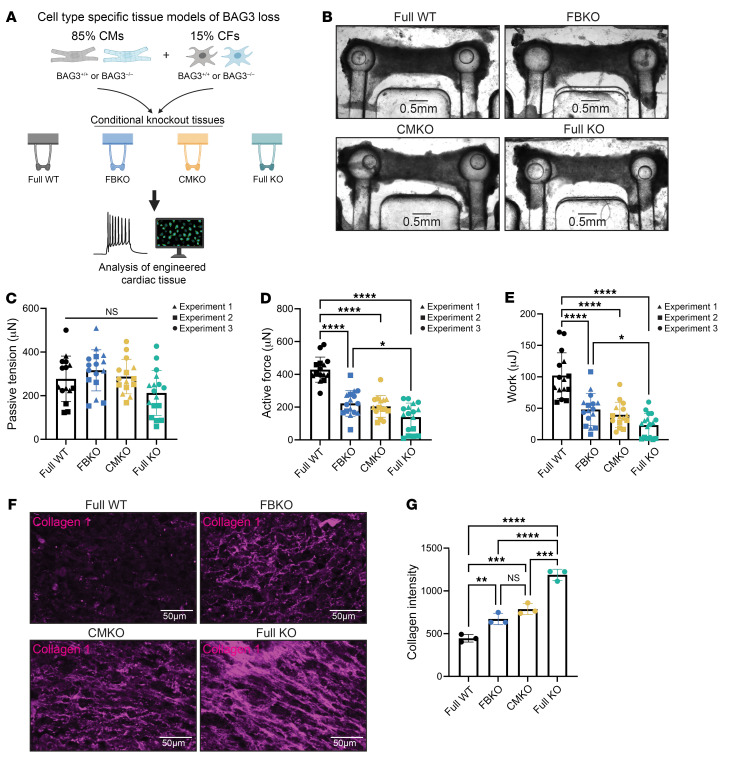
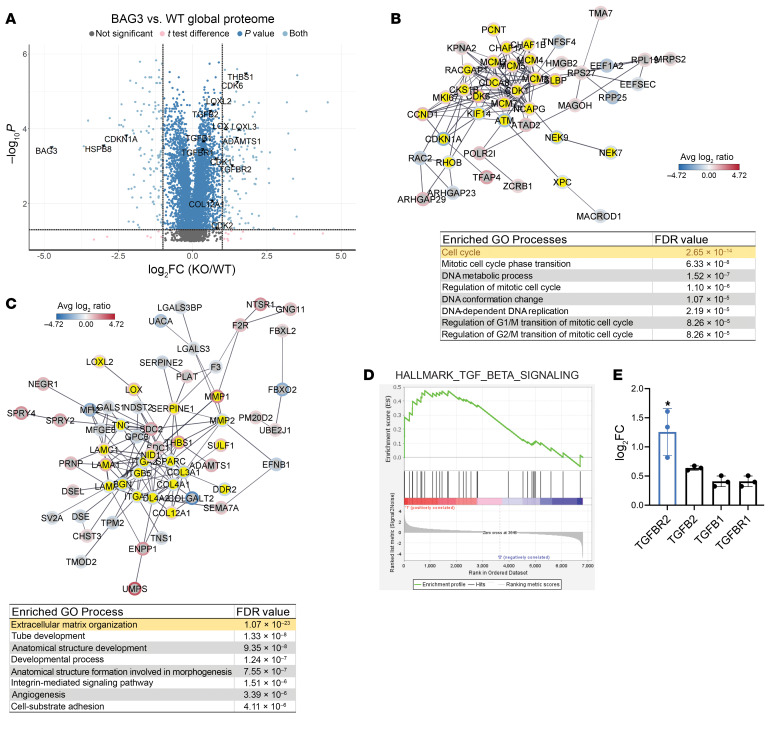
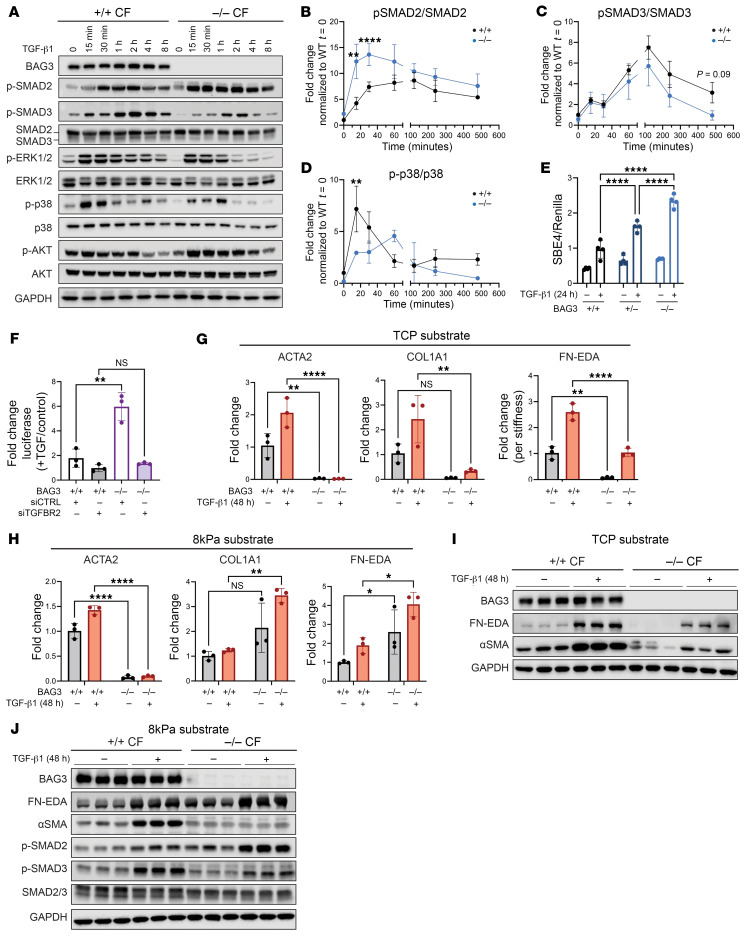
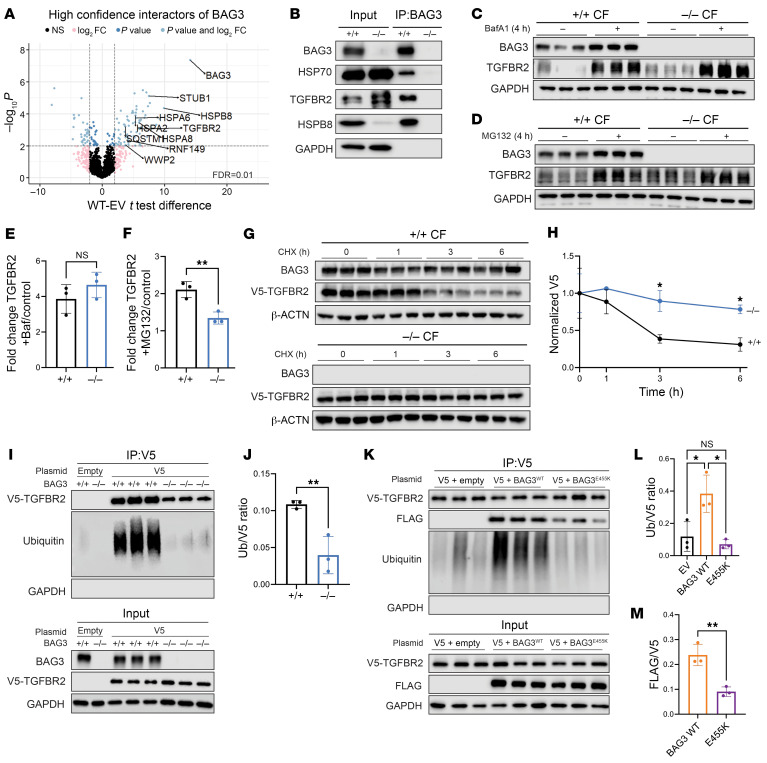
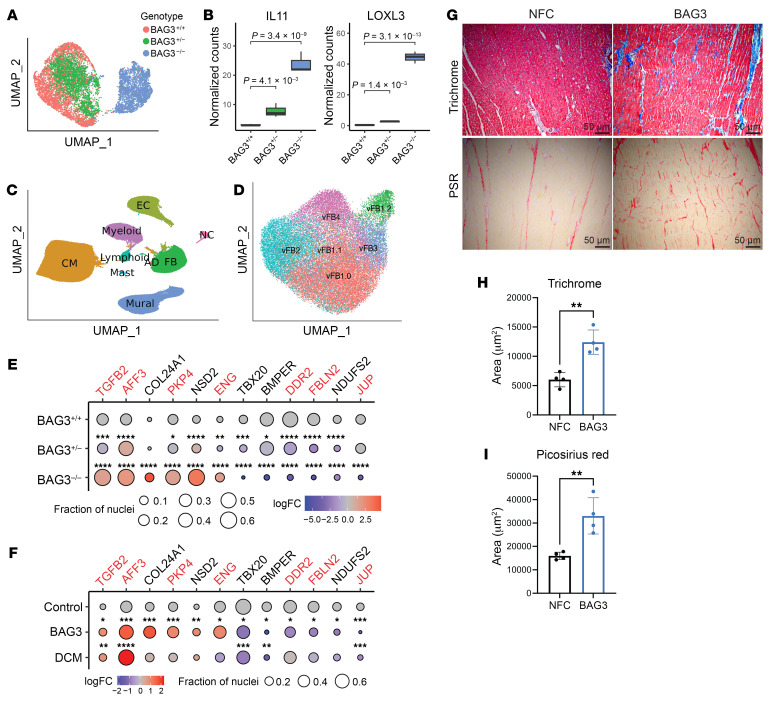
Loss of Bcl2-associated athanogene 3 (BAG3) is associated with dilated cardiomyopathy (DCM). BAG3 regulates sarcomere protein turnover in cardiomyocytes; however, the function of BAG3 in other cardiac cell types is understudied. In this study, we used an isogenic pair of BAG3-knockout and wild-type human induced pluripotent stem cells (hiPSCs) to interrogate the role of BAG3 in hiPSC-derived cardiac fibroblasts (CFs). Analysis of cell type-specific conditional knockout engineered heart tissues revealed an essential contribution of CF BAG3 to contractility and cardiac fibrosis, recapitulating the phenotype of DCM. In BAG3-/- CFs, we observed an increased sensitivity to TGF-β signaling and activation of a fibrogenic response when cultured at physiological stiffness (8 kPa). Mechanistically, we showed that loss of BAG3 increased transforming growth factor-β receptor 2 (TGFBR2) levels by directly binding TGFBR2 and mediating its ubiquitination and proteasomal degradation. To further validate these results, we performed single-nucleus RNA sequencing of cardiac tissue from DCM patients carrying pathogenic BAG3 variants. BAG3 pathogenic variants increased fibrotic gene expression in CFs. Together, these results extend our understanding of the roles of BAG3 in heart disease beyond the cardiomyocyte-centric view and highlight the ability of tissue-engineered hiPSC models to elucidate cell type-specific aspects of cardiac disease.

Keywords: Cardiology; Cardiovascular disease; Fibrosis; Human stem cells.


Figures

Figure 1
Figure 1. Engineered cardiac tissues reveal the contribution of cardiac fibroblast BAG3 to cardiac function.
(A) Schematic of experimental design. (B) Representative bright-field microscopy of engineered cardiac tissues. Scale bars: 0.5 mm. (CE) Measurements of cardiac tissue passive tension (C), contractile force (D), and work (E). (F and G) Immunofluorescence staining of cardiac tissues with collagen I (F) and quantification (G). Scale bars: 50 μm. *P < 0.05, **P < 0.01, ***P < 0.001, ****P < 0.0001 by 1-way ANOVA with post hoc Tukey’s test. Functional data pooled from 3 independent experiments, resulting in n = 15–17 per genotype.
Figure 2
Figure 2. Loss of BAG3 alters CF phenotype.
(A) Differentially expressed proteins in BAG3–/– CFs. (B and C) STRING analysis of protein-protein interactions reveals 2 clusters of cell cycle– and ECM-associated protein networks. (D) Gene set enrichment analysis of TGF-β signaling pathway. (E) Fold change values for the TGF-β ligands and receptors identified by mass spectrometry. *P < 0.05 by 2-tailed Student’s t test with permutation-based FDR correction less than 0.05. n = 3 independent differentiations in mass spectrometry data.
Figure 3
Figure 3. BAG3 loss sensitizes the TGF-β response and promotes the fibrotic response in a substrate-dependent manner.
(AD) Representative Western blot and quantification of the phosphorylation response of the canonical and non-canonical TGF-β signaling pathway following stimulation. (E) TGF-β pathway activity was measured by a SMAD-binding element luciferase reporter. (F) Silencing of TGFBR2 abrogates the hypersensitivity of BAG3–/– reporter response. (G) RT-qPCR of ECM-related genes after 48 hours of TGF-β ligand stimulation following culture on tissue culture plastic (TCP). (H) RT-qPCR of ECM-related genes after 48 hours of TGF-β ligand stimulation following culture on 8 kPa substrate. (I) Western blot of FN-EDA and α-SMA response after 48 hours of TGF-β stimulation following culture on TCP. (J) Western blot of FN-EDA, α-SMA, and SMAD response after 48 hours of TGF-β stimulation following culture on 8 kPa substrate. *P < 0.05, **P < 0.01, ****P < 0.0001 by 2-way ANOVA with post hoc Šidák’s test.
Figure 4
Figure 4. BAG3 binds TGFBR2 and mediates its proteasomal degradation.
(A) Identification of BAG3 binding partners in CFs using affinity purification of FLAG and mass spectrometry (AP-MS). (B) Immunoprecipitation of endogenous BAG3 confirms TGFBR2 interaction. (C) Lysosomal flux of TGFBR2 measured by Western blot. (D) Proteasomal flux of TGFBR2 measured by Western blot. (E) Quantification of C. (F) Quantification of D. (G and H) Cycloheximide (CHX) chase of V5-tagged TGFBR2 (G) and quantification (H). (I and J) Ubiquitination assay of V5-TGFBR2 (I) and quantification (J). (K and L) Rescue of TGFBR2 ubiquitination in BAG3–/– background (K) and quantification (L). (M) BAG3E455K reduces TGFBR2 and BAG3 binding. *P < 0.05, **P < 0.01 by unpaired 2-tailed Student’s t test (E, F, and J), 1-way ANOVA with post hoc Tukey’s test (L and M), or 2-way ANOVA with post hoc Šidák’s test (H). n = 3 independent transfections.
Figure 5
Figure 5. Gene expression changes in BAG3 fibroblasts indicate increased TGF-β signaling.
(A) Uniform manifold approximation and projection (UMAP) visualization of multiplexed snRNA-Seq data of cultured CFs, color-coded based on their respective genotypes. (B) Averaged and normalized expression of fibrosis- and TGF-β–related genes. Median values are denoted by black horizontal bars. The interquartile range is illustrated by the upper and lower boundaries of the box. The highest and lowest values are indicated by the top and bottom ends of the vertical lines. Adjusted P values from edgeR analysis are provided at the top. (C) UMAP of non-failing control and DCM-affected left ventricles, distinguished by their assigned cell types. (D) UMAP of fibroblasts, with color indicating their respective cell states. (E and F) Dot plot illustrating the differentially expressed genes in BAG3+/+, BAG3+/–, and BAG3–/– hiPSC-CFs (E) and human tissue fibroblasts (F). Genes highlighted in red indicate significantly differential expression in the proteomics of BAG3–/– hiPSC-CFs. The size of each dot represents the fraction of nuclei expressing each gene, and colors indicate log2 fold change. Adjusted P values from edgeR analysis are displayed on top of each dot. *P < 0.05, **P < 0.01, ***P < 0.001, ****P < 0.0001. (G) Representative images from staining of explanted BAG3 DCM (n = 4) hearts and non-failing control (NFC) hearts (n = 4) with Masson’s trichrome and Picrosirius red (PSR) staining. Scale bars: 50 μm. (H) Quantification of fibrosis in trichrome images. Each dot represents the average fibrosis present in patient samples from several histological slices. n = 4 for both NFC and BAG3-mutant DCM patients. (I) Quantification of fibrosis in PSR images. n = 4 for both NFC and BAG3-mutant DCM patients. **P < 0.01 by 2-tailed Student’s t test (H and I).

Similar articles

Cited by

References

    1. Homma S, et al. BAG3 deficiency results in fulminant myopathy and early lethality. Am J Pathol. 2006;169(3):761–773. doi: 10.2353/ajpath.2006.060250. - DOI - PMC - PubMed
    1. Norton N, et al. Genome-wide studies of copy number variation and exome sequencing identify rare variants in BAG3 as a cause of dilated cardiomyopathy. Am J Hum Genet. 2011;88(3):273–282. doi: 10.1016/j.ajhg.2011.01.016. - DOI - PMC - PubMed
    1. Domínguez F, et al. Dilated cardiomyopathy due to BLC2-associated athanogene 3 (BAG3) mutations. J Am Coll Cardiol. 2018;72(20):2471–2481. doi: 10.1016/j.jacc.2018.08.2181. - DOI - PMC - PubMed
    1. Feldman AM, et al. Decreased levels of BAG3 in a family with a rare variant and in idiopathic dilated cardiomyopathy. J Cell Physiol. 2014;229(11):1697–1702. doi: 10.1002/jcp.24615. - DOI - PMC - PubMed
    1. Arndt V, et al. Chaperone-assisted selective autophagy is essential for muscle maintenance. Curr Biol. 2010;20(2):143–148. doi: 10.1016/j.cub.2009.11.022. - DOI - PubMed

MeSH terms

Substances