. 2025 Jan 2;135(1):e181895.
doi: 10.1172/JCI181895.

MHC-related protein 1-restricted recognition of cancer via a semi-invariant TCR-α chain

Affiliations

MHC-related protein 1-restricted recognition of cancer via a semi-invariant TCR-α chain

Garry Dolton et al. J Clin Invest. .

Abstract

The T cell antigen presentation platform MR1 consists of 6 allomorphs in humans that differ by no more than 5 amino acids. The principal function of this highly conserved molecule involves presenting microbial metabolites to the abundant mucosal-associated invariant T (MAIT) cell subset. Recent developments suggest that the role of MR1 extends to presenting antigens from cancer cells, a function dependent on the K43 residue in the MR1 antigen binding cleft. Here, we successfully cultured cancer-activated, MR1-restricted T cells from multiple donors and confirmed that they recognized a wide range of cancer types expressing the most common MR1*01 and/or MR1*02 allomorphs (over 95% of the population), while remaining inert to healthy cells including healthy B cells and monocytes. Curiously, in all but one donor these T cells were found to incorporate a conserved TCR-α chain motif, CAXYGGSQGNLIF (where X represents 3-5 amino acids), because of pairing between 10 different TRAV genes and the TRAJ42 gene segment. This semi-invariance in the TCR-α chain is reminiscent of MAIT cells and suggests recognition of a conserved antigen bound to K43.

Keywords: Cancer; Cellular immune response; Immunology; Oncology; T cells.


Figures

Figure 1
Figure 1. Induction of T cells reactive to natural levels of MR1 on the surface of cancer cells.
(A) PBMCs from healthy donors were primed for 2 weeks with C1R cells overexpressing MR1*01. Primed T cells were enriched for reactivity toward WT melanoma,or MR-KO (–/–) melanoma cells overexpressing MR1*01, using TNF capture antibody and magnetic beads. The captured T cells were expanded for 2 weeks with irradiated PBMCs and PHA before analysis. (B) Three donors primed for 2 weeks with C1R cells overexpressing MR1*01 then tested against C1R and melanoma MM909.24 cells, indicated on the x-axis. Intracellular cytokine staining (ICS) was performed with CD107a and TNF antibodies. (C) The primed lines from B were coincubated with WT melanoma MM909.24 or MR1-KO melanoma MM909.24 overexpressing MR1*01, then reactive T cells captured based on TNF secretion and magnetic sorting. T cells enriched with the melanoma overexpressing MR1*01 (pink) preferred the overexpressed cell line (red box), whereas the T cells enriched with WT melanoma (yellow) gave similar MR1-dependent reactivity for both the WT and MR1 overexpressing melanoma (red box). ICS was performed with CD107a and TNF antibodies.
Figure 2
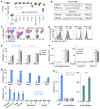
Figure 2. Characterization of the MC.27.759S T cell receptor.
(A) MC.27.759S and MC.7.G5 T cell clone killing assay of various cancer cells (MR1 allotype indicated). A549 (lung) MR1 KO (–/–) by CRISPR/Cas9, with a transgene for scβ2M-MR1*01. Flow cytometry–based killing assay at a 1:2 T cell–to–cancer cell ratio for 24 hours. Quadruplicate conditions with error bars depicting SD. (B) TCR-α and -β chains of MC.27.759S and MC.7.G5. Germline amino acid residues of variable (V) and joining (J) regions are underlined and inserted amino acids not underlined. (C) CD8 phenotyping of MC.27.759S and MC.7.G5 T cell clones with CD8-α and CD8-β–specific antibodies. MAIT and CD8+ T cell line used as a controls for CD8-αα or CD8-αβ expression. (D) CD161 phenotyping of MC.27.759S and MC.7.G5 T cell clones, using MAIT and CD3/CD28-amplified T cells as in C. The MFI of CD161 staining is shown. (E) CD69 assays for 24 hours of MC.27.759S and MC.7.G5 TCR-transduced Jurkat cells expressing no CD8, CD8-αα or CD8-αβ, versus cancer cells. Untransduced values have been subtracted. Triplicate conditions with errors bars depicting SD. (F) CD69 assays for 24 hours of A-F7 (MAIT) TCR-transduced Jurkat cells expressing no CD8, CD8-αα or CD8-αβ versus M. smeg–infected A549 cells or 100 μg of 5-A-RU. Untransduced values have been subtracted. Triplicate conditions with errors bars depicting SD. (G) CD69 assays (24 hours) of MC.27.759S TCR-transduced Jurkat cells against MR1*01/*01 or *01/*02 cancer cells and healthy cells. Duplicate for monocytes from donors 1 and 2 due to the low number of cells available, or triplicate conditions with errors bars showing SD. (H) CD69 assay (24 hours) with MC.27.759S or JMA (positive control for MR1 on healthy cells) TCR-transduced Jurkat cells versus melanoma and inactivated or activated B cells. Triplicate conditions with errors bars showing SD. Cancer cells include melanoma (FM74, FM72, MEL624, MEL526, and FM86), Ewing sarcoma (RD-ES and ES-5838), Leukemia/CML (K-562), cervical (SiHa), breast (MDA-MB-231), kidney (ACHN) and pancreatic (MIA PaCa-2) cancers.
Figure 3
Figure 3. Phenotypic and clonotypic analysis of MR1-restricted cancer-reactive T cells.
(A) CD8- and CD4-coreceptor phenotyping of MR1-reactive T cell lines from donors 0–6 and ME216. T cells from ME216 were preenriched with CD8 beads and therefore would not be CD4+ or CD4/CD8 double negative. (B) CD161 staining index (fold increase of CD161 staining relative to fluorescence minus 1 control) of 6 MR1-reactive T cell lines. MC.7.G5 and MC.27.759S clones included, as well as a MAIT and CD8+ T cell line. (C) TRAV and TRAJ gene usage of MR1-reactive T cells from 6 healthy donors and AML patient ME216. Circos plots show TRAV (V) genes on the left and TRAJ (J) genes on the right, with the size of the outer arcs corresponding to the relative frequency of the TRAV or TRAJ genes. The ribbons between the arcs represent TRAV-TRAJ pairings. (D) CDR3 logo plot for TCRs containing TRAJ42 with CDR3s of 17 amino acids in length from this figure and Supplemental Figure 5, giving the CAXYGGSQGNLIF motif (where X represents 5 amino acids). (E) TRAJ42 (preserved tyrosine with and without asparagine) summary of TCRs for donors in this figure and from the VDJdb database.
Figure 4
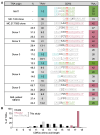
Figure 4. TCR-α chain usage and CDR3s of MR1-restricted cancer-activated T cells.
(A) TRAV, TRAJ, and CDR3s of TCRs from cancer-reactive lines. Canonical MAIT T cell α chain CDR3 shown for comparison. The donors that MC.27.759S and MC.7.G5 T cell clones came from, and donors 1–5 are healthy donors. TRAV and TRAJ amino acids are underlined. (B) CDR3 amino acid length of antigen-defined TCRs from the VDJdb database, and TRAJ42 or other TRAJ genes from donors in Figure 3.
Figure 5
Figure 5. Testing MR1-restricted cancer-reactive TCRs.
(A) Functionally paired TCRs from donors 1 and 2, named K8T-1 and K8T-2, respectively. (B) Left, CD69 assay (24 hours) of K8T-1 or K8T-2 TCR-transduced Jurkat cells with A549 WT and MR1-KO (–/–) cell lines. Duplicate conditions. Right, CD69 assay (24 hours) of K8T-1 and K8T-2 TCR-transduced Jurkat cells with MR1*01 cancer lines, including leukemia/CML (K-562), melanoma (FM74, FM72), and kidney (ACHN) cancers. Triplicate conditions with error bars depicting SD. (C) CD69 assay (24 hours) with MC.7.G5, MC.27.759S, and K8T-2 TCR-transduced Jurkat cells with various MR1*01 WT and B2M–/– (CRISPR/Cas9) Ewing sarcoma cell lines. Triplicate conditions with error bars depicting SD. (D) CD69 assay (4 hours) of MC.7.G5, MC.27.759S, K8T-1, K8T-2, DGB129, AC1A4, and TC5A87 TCR-transduced Jurkat cells with A549 cells, including WT, MR1–/– and MR1–/– with transgene for expression of scβ2M-MR1*01 WT. CD69 values of untransduced Jurkat cells have been subtracted. Triplicate conditions with error bars depicting SD. (E) CD69 assay (24 hours) of TCRs in D versus A549 MR1–/– cells, also with reexpression of scβ2M-MR1*01 WT or K43A. CD69 values of untransduced Jurkat cells has been subtracted. Data normalized to activation with scβ2M-MR1*01 WT. Triplicate conditions with error bars depicting SD. The K8T-2 TCR was performed in a separate assay with quadruplicate conditions, error bars show SD. (F) CD69 assay (24 hours) of MC.7.G5, MC.27.759S, K8T-1 and K8T-2 TCR-transduced Jurkat cells with A549 cell ± MR1 ± 10 μg of Ac-6-FP. (G) CD69 assay (24 hours) of MC.7.G5, MC.27.759S, K8T-1, and K8T-2 TCRs in Jurkat cells with C1R cells ± 10 μg of 5-A-RU. MAIT TCR A-F7 used as a positive control for 5-A-RU recognition. PMA (UT Jurkat cells) or CD3/CD28 (TCR transduced) as a positive control for CD69 upregulation.
Figure 6
Figure 6. MR1-restricted TCRs do not react to healthy cells and are cancer specific.
(A) CD69 assay (24 hours) of MC.27.759S and MC.7.G5 TCR-transduced Jurkat cells with cancer cell lines MEL526 (melanoma, MR1*01/*02) and MCF-7 (breast, MR1*01/*02), and purified (CD14+) monocytes (M). MR1T TCR JMA in Jurkat cells used as a positive control for monocyte recognition. Duplicate conditions. (B) CD69 assay (24 hours) of MC.27.759S and MC.7.G5 TCR-transduced Jurkat cells with cancer cell lines ACHN (kidney, MR1*01) and FM74 (melanoma, MR1*01), and purified (CD19+) B cells. CD19-chimeric antigen receptor (CAR) expressed in Jurkat cells were used as a positive control for B cell recognition. Duplicate conditions. (C) CD69 assay (24 hours) of K8T-1 and K8T-2 TCR-transduced Jurkat cells cancer cell line K-562 (leukemia/CML, MR1*01), and purified monocytes (CD14+) and B cells (CD19+). JMA TCR and CD19-CAR in Jurkat cells were used as positive controls for healthy cell recognition. Duplicate conditions. (D) Repeated CD69 assay (24 hours, conditions in triplicate with error bars depicting SD) using the above TCRs and CD19-CAR with monocytes (M) and B cells (B) from 3 healthy donors and cancer cell line FM72 (melanoma, MR1*01).
Figure 7
Figure 7. Cancer reactivity requires TCR replacement.
(A) WT or TCR-KO E6.1 Jurkat cells with MC.7.G5 or K8T-2 TCRs stained with TRBV25 or TRBV28 antibodies, respectively. Conditions in triplicate, error bars depict SD. (B) WT or TCR-KO E6.1 Jurkat cells with MC.7.G5, MC.27.759S, K8T-1, or K8T-2 TCRs in a CD69 assay (24 hours) with C1R WT or overexpressed MR1*01. Performed over 3 assays: MC.7.G5, MC.27.759S, and K8T-1/K8T-2. Conditions in triplicate, error bars depict SD. Statistics for WT and TCR-KO Jurkat cells versus C1R + MR1*01. Individual P values for a Shapiro-Wilk normality and paired 2-tailed t test. Collective P value for a Wilcoxon signed-rank test. (C) Purified CD8+ T cells from 2 healthy donors (216T and 192D) transduced with MC.7.G5 TCR, comparing KI with TCR replacement. Staining with rCD2 (TCR comarker) and TRBV25 for MC.7.G5 TCR expression. (D) Donors 216T and 192D CD8+ T cells, either untransduced, MC.7.G5 TCR KI or TCR replaced in an overnight activation assays with cancer cells, followed by TNF ELISA. MC.7.G5 clone, included for comparison. Duplicate conditions. (E) Donor 216T CD8+ T cells, either untransduced, MC.7.G5 TCR KI or TCR replaced in an overnight activation assay with cancer cells, followed by Granzyme B ELISA. Triplicate conditions, error bars depict SD. (F) Donor 216T CD8+ T cells, either untransduced, MC.7.G5 TCR KI or TCR replaced in an overnight activation assay versus MR1*01 or MR1*01/*02 cancer cells, followed by TNF ELISA. Triplicate conditions, with error bars depicting SD. P value for a multivariate permutation test for paired comparison. (G) Donor 216T CD8+ T cells, either untransduced, MC.7.G5 TCR KI or TCR replaced in an overnight flow cytometry–based killing assay at a 1:1 ratio with cancer cells FM72, or PBMCs from 3 healthy donors. CD14 and CD19 antibodies used to identify monocytes (M) and B cells (B) during analysis. MC.7.G5 clone data repeated (*) on each graph for comparison. Cancer cells include melanoma (FM72, MEL624, MEL526, FM3, FM88, and FM74), kidney (ACHN), pancreatic (BxPC-3 and MIA PaCa-2), leukemia/CML (K-562), breast (MCF-7), ovarian (A2780), and cervical (SiHa) cancers.

References

    1. Zhang N, Bevan MJ. CD8(+) T cells: foot soldiers of the immune system. Immunity. 2011;35(2):161–168. doi: 10.1016/j.immuni.2011.07.010. - DOI - PMC - PubMed
    1. Gao GF, et al. Crystal structure of the complex between human CD8alpha(alpha) and HLA-A2. Nature. 1997;387(6633):630–634. doi: 10.1038/42523. - DOI - PubMed
    1. Purbhoo MA, et al. The human CD8 coreceptor effects cytotoxic T cell activation and antigen sensitivity primarily by mediating complete phosphorylation of the T cell receptor zeta chain. J Biol Chem. 2001;276(35):32786–32792. doi: 10.1074/jbc.M102498200. - DOI - PubMed
    1. Van Rhijn I, et al. Lipid and small-molecule display by CD1 and MR1. Nat Rev Immunol. 2015;15(10):643–654. doi: 10.1038/nri3889. - DOI - PMC - PubMed
    1. Attaf M, et al. The T cell antigen receptor: the Swiss army knife of the immune system. Clin Exp Immunol. 2015;181(1):1–18. doi: 10.1111/cei.12622. - DOI - PMC - PubMed

MeSH terms

Substances