. 2025 Jan 2;135(1):e184656.
doi: 10.1172/JCI184656.

APP lysine 612 lactylation ameliorates amyloid pathology and memory decline in Alzheimer's disease

Affiliations

APP lysine 612 lactylation ameliorates amyloid pathology and memory decline in Alzheimer's disease

Qiuyun Tian et al. J Clin Invest. .

Abstract

Posttranslational modification (PTM) of the amyloid precursor protein (APP) plays a critical role in Alzheimer's disease (AD). Recent evidence reveals that lactylation modification, as a novel PTM, is implicated in the occurrence and development of AD. However, whether and how APP lactylation contributes to both the pathogenesis and cognitive function in AD remains unknown. Here, we observed a reduction in APP lactylation in AD patients and AD model mice and cells. Proteomic mass spectrometry analysis further identified lysine 612 (APP-K612la) as a crucial site for APP lactylation, influencing APP amyloidogenic processing. A lactyl-mimicking mutant (APPK612T) reduced amyloid-β peptide (Aβ) generation and slowed down cognitive deficits in vivo. Mechanistically, APPK612T appeared to facilitate APP trafficking and metabolism. However, lactylated APP entering the endosome inhibited its binding to BACE1, suppressing subsequent cleavage. Instead, it promoted protein interaction between APP and CD2-associated protein (CD2AP), thereby accelerating the endosomal-lysosomal degradation pathway of APP. In the APP23/PS45 double-transgenic mouse model of AD, APP-Kla was susceptible to L-lactate regulation, which reduced Aβ pathology and repaired spatial learning and memory deficits. Thus, these findings suggest that targeting APP lactylation may be a promising therapeutic strategy for AD in humans.

Keywords: Aging; Alzheimer disease; Neurodegeneration; Neuroscience.


Conflict of interest statement

Conflict of interest: The authors have declared that no conflict of interest exists.

Figures

Figure 1
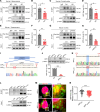
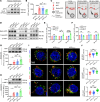
Figure 1. Reduced expression level of APP lactylation modification in AD.
(AD) Hippocampus (A and B) and frontal cortex (C and D) tissue lysates were immunoprecipitated with APP antibody, followed by immunoblot analysis with Pan-Kla antibody to detect APP-Kla expression levels in patients with AD and age-matched people in the control group (n = 6 in each group). (EH) Hippocampus (E and F) and cortex (G and H) tissue lysates were immunoprecipitated with APP antibody, followed by immunoblot analysis with Pan-Kla antibody to detect APP-Kla expression levels in WT and APP23/PS45 mice at the age of 6 months (n = 5 in each group). (I) Genomic DNA sequences of APP locus in APPKO HEK293 cells. (J) The relative protein levels of APP were assessed by Western blot in APPKO cells and HEK293 cells (n = 3 in each group). (K) Sequencing map of the APPWT and APPswe695 mutation site. (L) Cell lysates were immunoprecipitated with APP antibody, followed by immunoblot analysis with Pan-Kla antibody to detect APP-Kla expression levels in APPWT and APPswe695 groups (n = 3 in each group). (M and N) Representative confocal fluorescence images of APP costained with Pan-Kla in APPWT and APPswe695 groups (M), as well as the colocalization of APP with Pan-Kla in multiple confocal images quantified by calculating the Manders’ overlap coefficient (N) (n > 60 cells in each group; scale bars: 5 μm (left) and 1.25 μm (right)). Data were presented as mean ± SEM, *P < 0.05, **P < 0.01, ***P < 0.001 by 2-tailed unpaired Student’s t test (BD, F, G, J, and N).
Figure 2
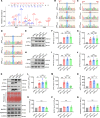
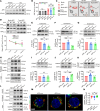
Figure 2. APP-K612la reduced APP amyloidogenic processing in vitro
(A) LC-MS/MS spectra of the lactylated peptides of APP-K612. (BD) Sequencing map of the APP lactylation/delactylation in K354 (B), K363 (C), and K612 (D) mimic lysine mutation site. Blue-shaded lines and red-shaded boxes represent lysine mutation sites. (EG) The relative protein levels of APP (E and F) and CTF-β (E and G) were assessed by Western blot in APPKO cells transfected with APPswe695, APPK354Q, and APPK354T mutant plasmids (n = 4 in each group). (HJ) The relative protein levels of APP (H and I) and CTF-β (H and J) were assessed by Western blot in APPKO cells transfected with APPswe695, APPK363Q, and APPK363T mutant plasmids (n = 4 in each group). (KQ) The relative protein levels of APP (K and L), CTF-β (K and M), sAPP-β (K and N), ADAM10 (K and O), BACE1 (K and P), and PS1 (K and Q) were assessed by Western blot in APPKO cells transfected with APPswe695, APPK612Q, and APPK612T mutant plasmids (n = 4–6 in each group). Data were presented as mean ± SEM, *P < 0.05, and ***P < 0.001. 1-way ANOVA, followed by Tukey’s multiple comparisons test (F, G, I, J, and LQ).
Figure 3
Figure 3. APP-K612la reduced Aβ generation in vivo.
(A) Brain stereotactic injection of mouse bilateral hippocampal CA1 region with virus and immunofluorescence signaling in brain slices (Scale bar: 1,000 μm). (B and C) Representative confocal fluorescence images of Aβ (B), as well as the number of Aβ plaques (C) in the hippocampal region of WT and PS45 mice injected with APPswe695, APPK612Q, and APPK612T viruses at the age of 5 months (Scale bar: 500 μm [up] and 200 μm [down], n=3–4 in each group). (DG) The relative protein levels of CTF-β (D and E), Aβ40 (D and F) and Aβ42 (D and G) were assessed by Western blot (n = 4 in each group). (H and I) Generation of Aβ40 (H) and Aβ42 (I) as measured by ELISA (n = 5 in each group). Data were presented as mean ± SEM, *P < 0.05, **P < 0.01, ***P < 0.001. 1-way ANOVA, followed by Tukey’s multiple comparisons test (C and EI).
Figure 4
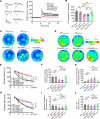
Figure 4. APP-K612la ameliorated synaptic and memory impairments in vivo.
(A and B) Hippocampal CA1 LTP recorded from mouse brain slices (A) and the bar graphs of the average percentage changes in the fEPSP slope 55–60 minutes after TBS delivery (B) (n = 7–11 slices from 3–4 mice in each group). (C) Average heatmap during memory retrieval in the Barnes maze test. (D) Average heatmap during memory retrieval in the Morris water maze test. (E) The latency to the escape hole during spatial learning in the Barnes maze paradigm (n = 9–11 in each group). (F and G) Correct number of finding the escape hole (F) and the latency to finding the escape hole (G) during memory retrieval in the Barnes maze test (n = 9–11 in each group). (H) The latency for finding the hidden island during spatial learning in the Morris water maze test (n = 16–18 in each group). (I and J) Number of entries to the island zone (I) and the time in the hidden platform quadrant zone during spatial learning (J) in the Morris water maze test (n = 16–18 in each group). Data were presented as mean ± SEM, *P < 0.05, **P < 0.01, ***P < 0.001. 1-way ANOVA, followed by Tukey’s multiple comparisons test (B, F, G, I, and J) or 2-way ANOVA (E and H).
Figure 5
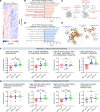
Figure 5. APP-K612la regulated transcription associated with APP metabolism in hippocampus.
(A) Significant DEGs were identified by RNA-seq analysis of hippocampal tissues of AAV-APPswe695, APPK612T microinjected mice (log2 FC = 1.2, P < 0.05, n = 6 in each group). (B and C) Top GO terms and GO enrichment map associated with upregulated DEGs in A. (D and E) Top GO terms and GO enrichment map associated with downregulated DEGs in A. (F) Enrichment scores for related endosomal-to-lysosomal transport in each group of hippocampal transcripts were assessed using GSVA (n = 6 in each group). (G) Enrichment scores for relevant APP metabolism in each group of hippocampal transcripts were assessed using GSVA (n = 6 in each group). Data were presented as mean ± SEM, *P < 0.05, **P < 0.01, ***P < 0.001. 1-way ANOVA, followed by Tukey’s multiple comparisons test (F and G).
Figure 6
Figure 6. APP-K612la enhanced APP trafficking from the plasma membrane to the endosomes and lysosomes.
(A and B) The relative protein levels of APP in the plasma membrane were assessed by Western blot in APPKO cells transfected with APPswe695, APPK612Q, and APPK612T mutant plasmids (n = 6 in each group). (C) Schematic representation of APP endocytosis assay using surface protein biotinylation. The biotinylated surface was chased for 10 minutes or 30 minutes, and then surface biotin was removed with non–cell-permeable GSH to detect endocytosed biotinylated proteins. (DF) Biotinylation experiments were performed in APPKO cells transfected with APPswe695, APPK612Q, and APPK612T mutant plasmids, and the relative endocytosed protein levels of biotin-APP and total-APP were assessed by Western blot (n = 4 per group). (G) The relative protein levels of APP in endosomes were assessed by Western blot in APPKO cells transfected with APPswe695, APPK612Q, and APPK612T mutant plasmids (n = 6 in each group). (H) The relative protein levels of APP in lysosomes were assessed by Western blot in APPKO cells transfected with APPswe695, APPK612Q, and APPK612T mutant plasmids (n = 4 in each group). (I and J) Representative confocal fluorescence images of APP costained with EEA1, RAB7, and LAMP1 in APPswe695, APPK612Q, and APPK612T groups (I), as well as the colocalization of APP with EEA1, RAB7, and LAMP1 in multiple confocal images quantified by calculating the Manders’ overlap coefficient (J) (n > 30 cells in each group; scale bars: 5 μm.). Data were presented as mean ± SEM, *P < 0.05, **P < 0.01, ***P < 0.001. 1-way ANOVA, followed by Tukey’s multiple comparisons test (B, EH, and J).
Figure 7
Figure 7. APP-K612la promoted the endosomal-lysosomal degradation process via CD2AP.
(A and B) The relative protein levels of APP treated with chloroquine (CQ, 50 nM) for 24 hours were assessed by Western blot in APPKO cells transfected with APPswe695, APPK612Q, and APPK612T mutant plasmids (n = 4 in each group). (C) Schematic representation of APP degradation assay using surface protein biotinylation. (D) Degradation of surface biotinylated APP (Biotin-APP, 0 minutes) chased for 60 minutes and 120 minutes in cells (n = 5 in each group). (EG) The relative protein levels of CTF-β (E), sAPP-β (F), and PS1 (G) in endosomes were assessed by Western blot (n = 3–5 in each group). (H) Interactions among APPswe695, APPK612Q, and APPK612T group APP and BACE1 proteins were detected by coimmunoprecipitation in endosomal protein lysates (n = 3 per group). (I) The relative protein levels of CD2AP were assessed by Western blot in cells (n = 4 in each group). (J) The relative protein levels of CD2AP in endosomes were assessed by Western blot in cells (n = 4 in each group). (K) Overexpression of CD2AP plasmid cotransfected with APPswe695, APPK612Q, and APPK612T mutant plasmids in APPKO cells, and the relative protein levels of APP in endosomes were assessed by Western blotting (n = 4 per group). (L) Interactions among APPswe695, APPK612Q, and APPK612T group APP and CD2AP proteins were detected by coimmunoprecipitation in endosomal protein lysates (n = 3 per group). (M and N) Representative confocal fluorescence images of APP costained with CD2AP in APPswe695, APPK612Q, and APPK612T groups (M), as well as the colocalization of APP with CD2AP in multiple confocal images quantified by calculating the Manders’ overlap coefficient (N) (n > 30 cells in each group; scale bar: 5 μm.). Data were presented as mean ± SEM, *P < 0.05, **P < 0.01, ***P < 0.001. 1-way ANOVA, followed by Tukey’s multiple comparisons test (B, EG, IK, and N) or 2-way ANOVA (D).
Figure 8
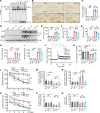
Figure 8. L-lactate enhancement of APP-Kla reduced Aβ pathology and cognitive impairment in AD model mice.
(A) Hippocampus tissue lysates were immunoprecipitated using an APP antibody, followed by immunoblot analysis with a Pan-Kla antibody to detect APP-Kla expression in WT and APP23/PS45 mice treated with L-lactate or O-4CIN at the age of 6 months (n = 6 in each group). (B and C) Representative IHC staining images and quantitative statistics of hippocampal senile plaques in mice (scale bar: 500μm, n > 30 slices from 6 mice in each group). (DG) The relative protein levels of CTF-β (E), Aβ40 (F), and Aβ42 (G) were assessed by Western blot (n = 4 in each group). (H and I) Generation of Aβ40 (H) and Aβ42 (I) as measured by ELISA (n = 4–5 in each group). (J and K) Hippocampal CA1 LTP recorded from mice brain slices (J) and the bar graphs of the average percentage changes in the fEPSP slope 55–60 min after TBS delivery (K) (n = 6–8 slices from 3–4 mice in each group). (L) The latency to the escape hole during spatial learning in the Barnes maze paradigm (n = 9–15 in each group). (M and N) The correct number of finding the escape hole (M) and latency to finding the escape hole (N) during memory retrieval in the Barnes maze test (n = 9–15 in each group). (O) The latency for finding the hidden island during spatial learning in the Morris water maze test (n = 9–15 in each group). (P and Q) The number of finding hidden platform quadrant zone during spatial learning (P) and time for entries to the island zone (Q) in the Morris water maze test (n = 9–15 in each group). Data were presented as mean ± SEM, *P < 0.05, **P < 0.01, and ***P < 0.001 by 2-way ANOVA, followed by Tukey’s multiple comparisons test (C, EG, H, I, and KQ).
Figure 9
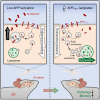
Figure 9. Schematic illustrates that lactylation of APPK612 ameliorates amyloid pathology and memory decline in AD.
APP lactylation expression was reduced in AD, and upregulation of APP by the APPK612T mimetic variant ameliorates amyloid pathology and memory decline by promoting APP endosomal-lysosomal degradation.

References

    1. Bloom GS. Amyloid-β and tau: the trigger and bullet in Alzheimer disease pathogenesis. JAMA Neurol. 2014;71(4):505–508. doi: 10.1001/jamaneurol.2013.5847. - DOI - PubMed
    1. Hardy J, Selkoe DJ. The amyloid hypothesis of Alzheimer’s disease: progress and problems on the road to therapeutics. Science. 2002;297(5580):353–356. doi: 10.1126/science.1072994. - DOI - PubMed
    1. Selkoe DJ, Hardy J. The amyloid hypothesis of Alzheimer’s disease at 25 years. EMBO Mol Med. 2016;8(6):595–608. doi: 10.15252/emmm.201606210. - DOI - PMC - PubMed
    1. Zhang X, Song W. The role of APP and BACE1 trafficking in APP processing and amyloid-β generation. Alzheimers Res Ther. 2013;5(5):46. doi: 10.1186/alzrt211. - DOI - PMC - PubMed
    1. Manucat-Tan NB, et al. Cellular trafficking of amyloid precursor protein in amyloidogenesis physiological and pathological significance. Mol Neurobiol. 2019;56(2):812–830. doi: 10.1007/s12035-018-1106-9. - DOI - PubMed

MeSH terms