. 2025 Jan 2;135(1):e183274.
doi: 10.1172/JCI183274.

T helper 2 cell-directed immunotherapy eliminates precancerous skin lesions

Affiliations

T helper 2 cell-directed immunotherapy eliminates precancerous skin lesions

Tomonori Oka et al. J Clin Invest. .

Abstract

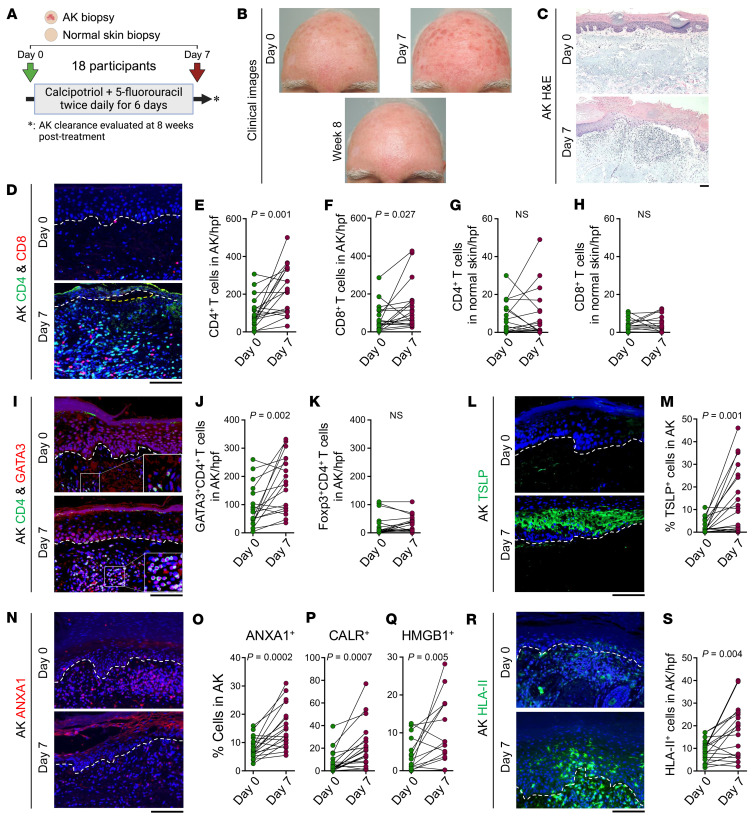
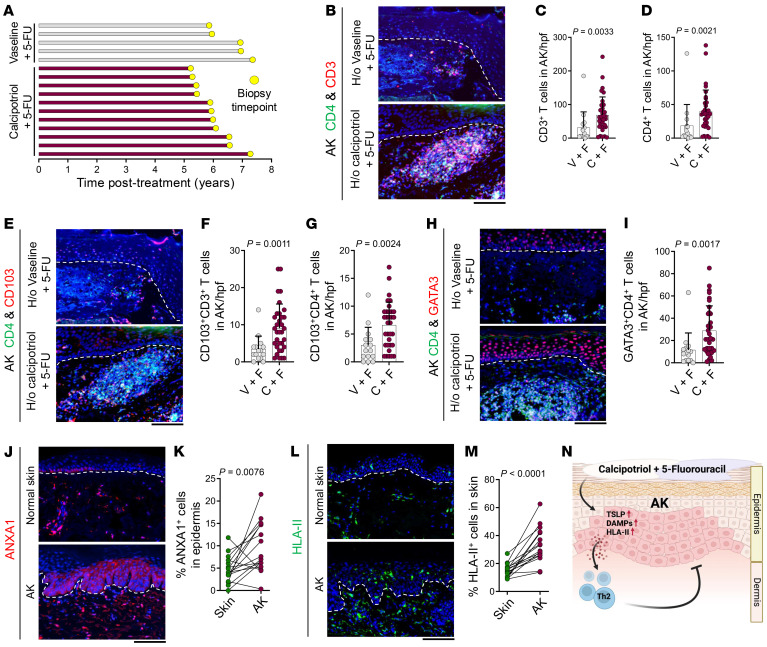
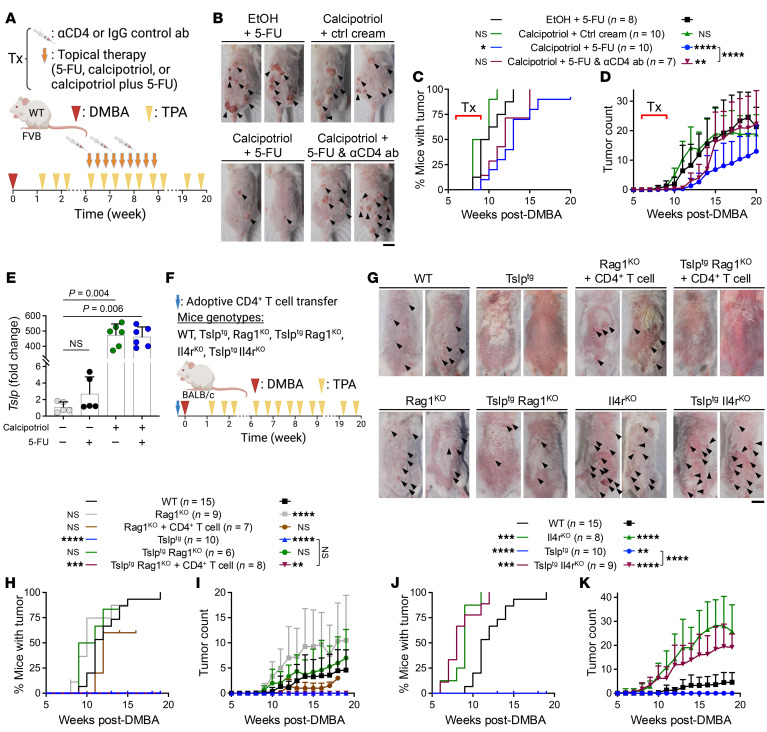
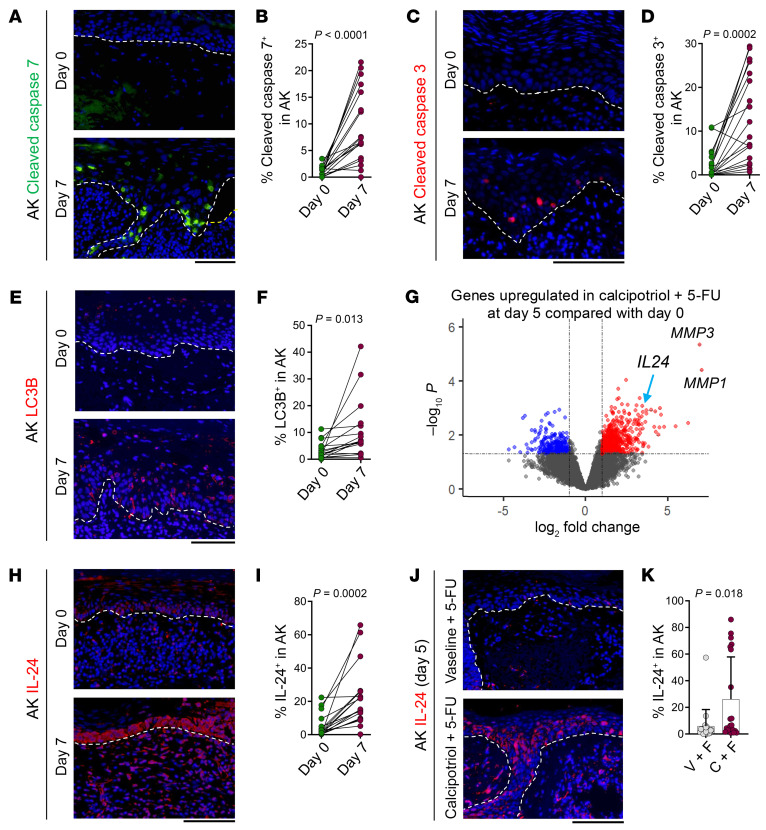
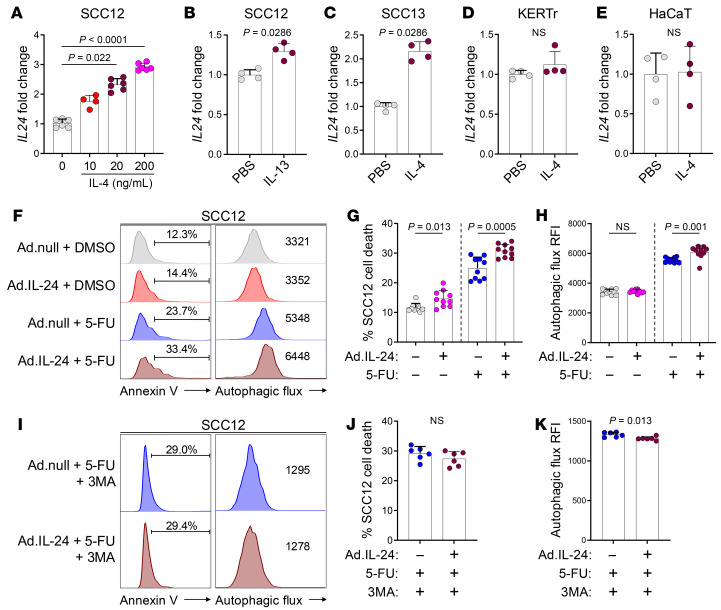
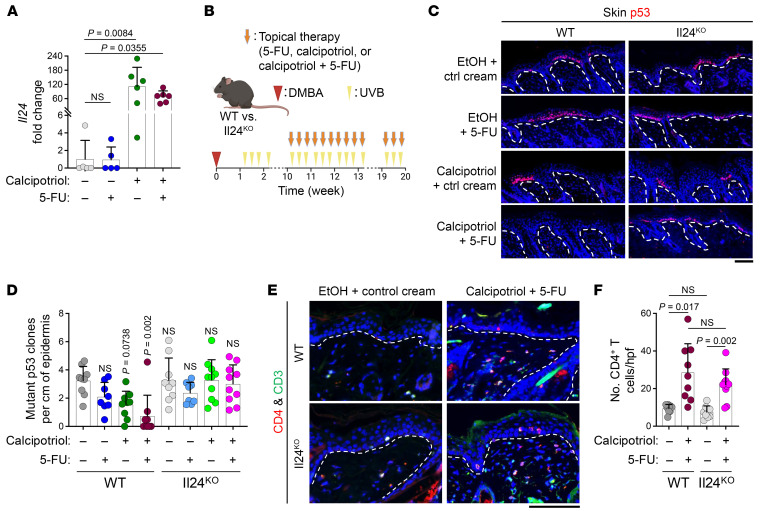
The continuous rise in skin cancer incidence highlights an imperative for improved skin cancer prevention. Topical calcipotriol-plus-5-fluorouracil (calcipotriol-plus-5-FU) immunotherapy effectively eliminates precancerous skin lesions and prevents squamous cell carcinoma (SCC) in patients. However, its mechanism of action remains unclear. Herein, we demonstrate that calcipotriol-plus-5-FU immunotherapy induces T helper type 2 (Th2) immunity, eliminating premalignant keratinocytes in humans. CD4+ Th2 cells were required and were sufficient downstream of thymic stromal lymphopoietin cytokine induction by calcipotriol to suppress skin cancer development. Th2-associated cytokines induced IL-24 expression in cancer cells, resulting in toxic autophagy and anoikis followed by apoptosis. Calcipotriol-plus-5-FU immunotherapy was dependent on IL-24 to suppress skin carcinogenesis in vivo. Collectively, our findings establish a critical role for Th2 immunity in cancer immunoprevention and highlight the Th2/IL-24 axis as an innovative target for skin cancer prevention and therapy.

Keywords: Dermatology; Immunotherapy; Oncology; Skin cancer; T cells.


Conflict of interest statement

Conflict of interest: LAC and SD are coinventors on a filed patent for the use of calcipotriol-plus–5-fluorouracil for the treatment of precancerous skin lesions (PCT/US2015/049434). PBF is a cofounder, president, CEO, and holds equity interest in InterLeukin Combinatorial Therapies (ILCT). Virginia Commonwealth University also has equity interest in ILCT. LE was the PI of a sponsored research agreement with ILCT, which was managed by Virginia Commonwealth University.

Figures

Figure 1
Figure 1. Calcipotriol-plus–5-FU immunotherapy induces robust Th2 immunity in AKs associated with TSLP and DAMP upregulation in keratinocytes.
(A) Schematic diagram of calcipotriol-plus–5-FU immunotherapy open-label trial. (B) Representative clinical photographs of skin treated with calcipotriol-plus–5-FU. Photographs were taken before (day 0), and after treatment (day 7 and week 8). (C) Representative H&E-stained AKs before (day 0) and after (day 7) calcipotriol-plus–5-FU treatment. (D) Representative images of CD4/CD8-stained AKs before (day 0) and after (day 7) calcipotriol-plus–5-FU treatment. Note that CD4+ and CD8+ cells are CD3+ T cells. (EH) Quantification of CD4+ T cells in AKs (E), CD8+ T cells in AKs (F), CD4+ T cells in normal skin (G), and CD8+ T cells in normal skin (H) before (day 0) and after (day 7) calcipotriol-plus–5-FU treatment. (I) Representative images of CD4/GATA3-stained AKs before (day 0) and after (day 7) calcipotriol-plus–5-FU treatment. Note that GATA3+CD4+ cells are CD3+ T cells. (J and K) Quantification of GATA3+CD4+ T cells (J) and Foxp3+CD4+ T cells (K) in AKs before (day 0) and after (day 7) calcipotriol-plus–5-FU treatment. (L) Representative images of TSLP-stained AKs before (day 0) and after (day 7) calcipotriol-plus–5-FU treatment. (M) Quantification of TSLP+ cells as percentage DAPI+ keratinocytes in AKs before (day 0) and after (day 7) calcipotriol-plus–5-FU treatment. (N) Representative images of ANXA1-stained AKs before (day 0) and after (day 7) calcipotriol-plus–5-FU treatment. (OQ) Quantification of ANXA1+ cells (O), CALR+ cells (P), and HMGB1+ cells (Q) as percent DAPI+ keratinocytes in AKs before (day 0) and after (day 7) calcipotriol-plus–5-FU treatment. (R) Representative images of HLA-II–stained AKs before (day 0) and after (day 7) calcipotriol-plus–5-FU treatment. (S) Quantification of HLA-II+ cells as percentage DAPI+ cells in AKs. Each dot represents an AK or normal skin sample. n = 18 participants at each time point; paired t test. Dashed lines mark the epidermal basement membrane in immunofluorescence images. Scale bars: 100 μm.
Figure 2
Figure 2. T cell immunity induced by calcipotriol-plus–5-FU immunotherapy persists over 5 years.
(A) Time from Vaseline-plus–5-FU versus calcipotriol-plus–5-FU treatment to biopsy for each participant in the follow-up clinical study. (B) Representative images of CD4/CD3-stained AKs from participants who had a history of (H/o) Vaseline-plus–5-FU versus calcipotriol-plus–5-FU treatment. (C and D) Quantification of CD3+ T cells (C) and CD4+ T cells (D) in AKs from participants who had a history of Vaseline-plus–5-FU versus calcipotriol-plus–5-FU treatment. Each dot represents cell counts from a high power field (hpf) image. 3 hpf images are included per sample (n = 5 participants in Vaseline-plus–5-FU group, n = 11 participants in calcipotriol-plus–5-FU group, Mann-Whitney U test). (E) Representative images of CD4/CD103-stained AKs from participants who had a history of Vaseline-plus–5-FU versus calcipotriol-plus–5-FU treatment. (F and G) Quantification of CD103+CD3+ T cells (F) and CD103+CD4+ T cells (G) in AKs from participants who had a history of Vaseline-plus–5-FU versus calcipotriol-plus–5-FU treatment. Each dot represents cell counts from an hpf image. 3 hpf images are included per sample (n = 5 participants in Vaseline-plus–5-FU group, n = 11 participants in calcipotriol-plus–5-FU group, Mann-Whitney U test). (H) Representative images of CD4/GATA3-stained AKs from participants who had a history of Vaseline-plus–5-FU versus calcipotriol-plus–5-FU treatment. (I) Quantification of GATA3+CD4+ T cells in AKs from participants who had a history of Vaseline-plus–5-FU versus calcipotriol-plus–5-FU treatment. Each dot represents cell counts from an hpf image. 3 hpf images are included per sample (n = 5 participants in Vaseline-plus–5-FU group, n = 11 participants in calcipotriol-plus–5-FU group, Mann-Whitney U test). (J) Representative images of ANXA1-stained AKs and normal skin. (K) Quantification of ANXA1+ cells in the epidermis of AKs and normal skin. (n = 16 participants for AK and normal skin samples, paired t test). (L) Representative images of HLA-II-stained AKs and normal skin. (M) Quantification of HLA-II+ cells in AKs and normal skin. (n = 16 participants for AK and normal skin samples, paired t test). (N) Schematic diagram depicting the mechanism by which calcipotriol-plus–5-FU immunotherapy induces Th2 immunity against AKs. Bar graphs show mean + SD. Dashed lines mark the epidermal basement membrane in immunofluorescence images. Scale bars: 100 μm.
Figure 3
Figure 3. Calcipotriol-plus–5-FU immunotherapy prevents skin cancer development in a Th2 cell–dependent manner.
(A) Schematic diagram of a 3-week topical therapy and CD4+ T cell depletion during the skin cancer development in WT mice on the FVB background undergoing DMBA/TPA skin carcinogenesis protocol. (B) Representative photographs of mouse back skin treated with EtOH-plus–5-FU, calcipotriol-plus–control cream, calcipotriol-plus–5-FU, and calcipotriol-plus–5-FU combined with anti-CD4 (α-CD4) antibody at week 20 after DMBA. Black arrows point to skin tumors. (C and D) Time to skin tumor onset (C, log-rank test) and the number of tumors per mouse over time (D, 2-way ANOVA with Dunnett’s multiple comparison test) in WT mice treated (Tx) with EtOH-plus–5-FU, calcipotriol-plus–control cream, calcipotriol-plus–5-FU, and calcipotriol-plus–5-FU combined with α-CD4 antibody. All groups are compared with EtOH-plus–5-FU group unless otherwise indicated. (E) Quantification of Tslp mRNA expression in murine skin treated with control vehicle, 5-FU, calcipotriol, or calcipotriol-plus–5-FU for 3 consecutive days. A day after last treatment, mRNA was isolated from the treated skin for analysis. Each dot represents a mouse (n = 5 in control vehicle and 5-FU groups, n = 6 in calcipotriol and calcipotriol-plus–5-FU groups, Kruskal-Wallis test with Dunn’s multiple comparison test). (F) Schematic diagram of adoptive T cell transfer and DMBA/TPA skin carcinogenesis in mice on the BALB/c background with different genotypes. (G) Representative photographs of mouse back skin at week 19 after DMBA. Black arrows point to skin tumors. (H and I) Time to tumor onset (H, log-rank test) and number of tumors per mouse over time (I, 2-way ANOVA with Dunnett’s multiple comparison test) in DMBA/TPA-treated WT, Rag1KO, Rag1KO + CD4+ T cell, Tslptg, Tslptg Rag1KO, and Tslptg Rag1KO + CD4+ T cell groups. All groups are compared with the WT group. (J and K) Time to tumor onset (J, log-rank test) and number of tumors per mouse over time (K, 2-way ANOVA with Dunnett’s multiple comparison test) in DMBA/TPA-treated WT, Il4rKO, Tslptg, and Tslptg Il4rKO mice. All groups are compared with the WT group unless otherwise indicated. Please note that WT and Tslptg groups are common in HK. Bar graphs show mean + SD. Scale bars: 1 cm. ****P < 0.0001, ***P < 0.001, **P < 0.01, *P < 0.05.
Figure 4
Figure 4. Calcipotriol-plus–5-FU treatment causes toxic autophagy and apoptosis associated with IL-24 induction in AK keratinocytes.
(A) Representative images of cleaved caspase 7–stained AKs before (day 0) and after (day 7) calcipotriol-plus–5-FU treatment. (B) Quantification of cleaved caspase 7+ cells per total DAPI+ keratinocytes in AK before (day 0) and after (day 7) calcipotriol-plus–5-FU treatment. Each dot represents an AK sample (n = 18 participants at each time point, paired t test). (C) Representative images of cleaved caspase 3-stained AKs before (day 0) and after (day 7) calcipotriol-plus–5-FU treatment. (D) Quantification of cleaved caspase 3+ cells per total DAPI+ keratinocytes in AK before (day 0) and after (day 7) calcipotriol-plus–5-FU treatment. Each dot represents an AK sample (n = 18 participants at each time point, paired t test). (E) Representative images of LC3B-stained AKs before (day 0) and after (day 7) calcipotriol-plus–5-FU treatment. (F) Quantification of LC3B+ cells per total DAPI+ keratinocytes in AK before (day 0) and after (day 7) calcipotriol-plus–5-FU treatment. Each dot represents an AK sample (n = 18 participants at each time point, paired t test). (G) Volcano plot showing significantly upregulated (red dots) and downregulated (blue dots) genes in AKs collected from randomized clinical trial participants after calcipotriol-plus–5-FU treatment (day 5, n = 3) compared with before calcipotriol-plus–5-FU treatment (day 0, n = 3). Genes of interest are indicated with their symbol. (H) Representative images of IL-24–stained AKs before (day 0) and after (day 7) calcipotriol-plus–5-FU treatment. (I) Quantification of IL-24+ cells per total DAPI+ keratinocytes in AK before (day 0) and after (day 7) calcipotriol-plus–5-FU treatment. Each dot represents an AK sample (n = 18 participants at each time point, paired t test). (J) Representative images of IL-24–stained AKs treated with Vaseline-plus–5-FU versus calcipotriol-plus–5-FU (day 5). (K) Quantification of IL-24+ cells per total DAPI+ keratinocytes in AK treated with Vaseline-plus–5-FU (V + F) and calcipotriol-plus–5-FU (C and F). Each dot represents an AK sample (n = 20 participants for both treatment groups, Mann-Whitney U test). Bar graphs show mean + SD. Dashed lines mark the epidermal basement membrane in immunofluorescence images. Scale bars: 100 μm.
Figure 5
Figure 5. IL-24 is induced by Th2-associated cytokines in cancer cells, and its overexpression causes toxic autophagy in the cells.
(A) Quantification of IL24 mRNA expression in SCC12 cells treated with IL-4 for 4 hours. Each dot represents a biological replicate (0, 20, 200 ng/mL: n = 6, 10 ng/mL: n = 4, Kruskal-Wallis test with Dunn’s multiple comparison test). (B) Quantification of IL24 mRNA expression in SCC12 cells treated with 20 ng/mL of IL-13 for 4 hours. Each dot represents a biological replicate (n = 4 in each group, Mann-Whitney U test). (C) Quantification of IL24 mRNA expression in SCC13 cells treated with 20 ng/mL of IL-4 for 4 hours. Each dot represents a biological replicate (n = 4 in each group, Mann-Whitney U test). (D and E) Quantification of IL24 mRNA expression in KERTr (D) and HaCaT (E) normal keratinocytes treated with 20 ng/mL of IL-4 for 4 hours. Each dot represents a biological replicate (n = 4 in each group, Mann-Whitney U test). (FH) Representative flow cytometry histogram of annexin V and autophagic flux (F), and quantification of percentage cell death (G) and RFI of autophagic flux (H) in SCC12 cells infected with adenovirus vector overexpressing IL-24 (Ad.IL-24) and treated with 5-FU compared with control vector (Ad.null) and DMSO (n = 10 in each group, Mann-Whitney U test). (IK) Representative flow cytometry histogram of annexin V and autophagic flux (I), and quantification of percentage cell death (J) and RFI of autophagic flux (K) in SCC12 cells infected with Ad.IL-24 and treated with 5-FU in the presence of 3MA compared with Ad.null (n = 6 in each group, Mann-Whitney U test). Bar graphs show mean + SD.
Figure 6
Figure 6. Calcipotriol-plus–5-FU immunotherapy–mediated skin cancer protection is IL-24–dependent.
(A) Quantification of Il24 mRNA expression in murine skin treated with control vehicle, 5-FU, calcipotriol, or calcipotriol-plus–5-FU for 3 consecutive days. 1 day after the last treatment, mRNA was isolated from the treated skin. Each dot represents a mouse (n = 5 in the control and 5-FU groups, n = 6 in calcipotriol and calcipotriol-plus–5-FU groups, Kruskal-Wallis test with Dunn’s multiple comparison test). (B) Schematic diagram of a 10-week topical therapy during skin cancer development in mice on the C57BL/6 background exposed to DMBA/UVB skin carcinogenesis protocol. (C) Representative images of p53-stained back skin of WT and Il24KO mice treated with EtOH-plus–control cream, EtOH-plus–5-FU, calcipotriol-plus–control cream, or calcipotriol-plus–5-FU at week 20 after DMBA. Note that mutant p53 clones in the epidermis are marked by increased p53 protein levels in the mutant cells. (D) Quantification of mutant p53 clones per cm of the epidermis in the back skin of WT and Il24KO mice treated with EtOH-plus–control cream, EtOH-plus–5-FU, calcipotriol-plus–control cream, or calcipotriol-plus–5-FU at week 20 after DMBA. Each dot represents a mouse (WT EtOH-plus–control cream: n = 9, WT EtOH-plus–5-FU: n = 8, WT calcipotriol-plus–control cream: n = 9, WT calcipotriol-plus–5-FU: n = 9, Il24KO EtOH-plus–control cream: n = 9, Il24KO EtOH-plus–5-FU: n = 8, Il24KO calcipotriol-plus–control cream: n = 10, Il24KO calcipotriol-plus–5-FU: n = 10, Kruskal-Wallis test with Dunn’s multiple comparison test). (E) Representative images of CD4/CD3-stained back skin of WT and Il24KO mice treated with EtOH-plus–control cream versus calcipotriol-plus–5-FU at week 20 after DMBA. (F) Quantification of CD4+ T cells in the back skin of WT and Il24KO mice treated with control vehicle versus calcipotriol-plus–5-FU at week 20 after DMBA. Each dot represents a mouse (WT EtOH-plus–control cream: n = 9, WT calcipotriol-plus–5-FU: n = 9, Il24KO EtOH-plus–control cream: n = 9, Il24KO calcipotriol-plus–5-FU: n = 10, Kruskal-Wallis test with Dunn’s multiple comparison test). Bar graphs show mean + SD. Dashed lines mark the epidermal basement membrane in immunofluorescence images. Scale bars: 100 μm.

Comment in

  • Type 2 immunity to the rescue: enhancing antitumor immunity for skin cancer prevention

Similar articles

References

    1. Guy GP, Jr , et al. Prevalence and costs of skin cancer treatment in the U.S., 2002-2006 and 2007-2011. Am J Prev Med. 2015;48(2):183–187. doi: 10.1016/j.amepre.2014.08.036. - DOI - PMC - PubMed
    1. Bottomley MJ, et al. The role of the immune system in cutaneous squamous cell carcinoma. Int J Mol Sci. 2019;20(8):2009. doi: 10.3390/ijms20082009. - DOI - PMC - PubMed
    1. Cohen JL. Actinic keratosis treatment as a key component of preventive strategies for nonmelanoma skin cancer. J Clin Aesthet Dermatol. 2010;3(6):39–44. - PMC - PubMed
    1. Sotiriou E, et al. Photodynamic therapy vs. imiquimod 5% cream as skin cancer preventive strategies in patients with field changes: a randomized intraindividual comparison study. J Eur Acad Dermatol Venereol. 2015;29(2):325–329. doi: 10.1111/jdv.12538. - DOI - PubMed
    1. Ceilley RI, Jorizzo JL. Current issues in the management of actinic keratosis. J Am Acad Dermatol. 2013;68(1 suppl 1):S28–S38. doi: 10.1016/j.jaad.2012.09.051. - DOI - PubMed

MeSH terms