. 2025 Jan 2;135(1):e182768.
doi: 10.1172/JCI182768.

Whole-exome sequencing association study reveals genetic effects on tumor microenvironment components in nasopharyngeal carcinoma

Affiliations

Whole-exome sequencing association study reveals genetic effects on tumor microenvironment components in nasopharyngeal carcinoma

Yanni Zeng et al. J Clin Invest. .

Abstract

Nasopharyngeal carcinoma (NPC) presents a substantial clinical challenge due to the limited understanding of its genetic underpinnings. Here we conduct the largest scale whole-exome sequencing association study of NPC to date, encompassing 6,969 NPC cases and 7,100 controls. We unveil 3 germline genetic variants linked to NPC susceptibility: a common rs2276868 in RPL14, a rare rs5361 in SELE, and a common rs1050462 in HLA-B. We also underscore the critical impact of rare genetic variants on NPC heritability and introduce a refined composite polygenic risk score (rcPRS), which outperforms existing models in predicting NPC risk. Importantly, we reveal that the polygenic risk for NPC is mediated by EBV infection status. Utilizing a comprehensive multiomics approach that integrates both bulk-transcriptomic (n = 356) and single-cell RNA sequencing (n = 56) data with experimental validations, we demonstrate that the RPL14 variant modulates the EBV life cycle and NPC pathogenesis. Furthermore, our data indicate that the SELE variant contributes to modifying endothelial cell function, thereby facilitating NPC progression. Collectively, our study provides crucial insights into the intricate genetic architecture of NPC, spotlighting the vital interplay between genetic variations and tumor microenvironment components, including EBV and endothelial cells, in predisposing to NPC. This study opens new avenues for advancements in personalized risk assessments, early diagnosis, and targeted therapies for NPC.

Keywords: Cancer; Genetic variation; Genetics; Oncology.


Figures

Figure 1
Figure 1. Study overview.
A 2-stage association study design was applied to investigate the genetic factors associated with NPC. In the discovery stage, a total of 5,022 samples, including the GD-SYSUCC cohort from Guangdong in China and the SG cohort from Singapore, were genotyped using WES and analyzed to identify independent variants, genes, and pathways associated with NPC. The associations were subsequently validated in the replication stage, which included 9,047 samples from the GD-ZS cohort from Guangdong and the HK cohort from Hong Kong. Bioinformatic analyses and functional experiments were conducted to explore the clinical application and the biological functions of the identified loci.
Figure 2
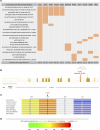
Figure 2. The sentinel genes from significant pathways associated with NPC and functional implication of SELE variants.
(A). Sentinel genes for NPC-associated pathways. Genes indicated on top are highlighted in orange if they are part of a specific pathway. The listed genes are those belonging to at least 2 NPC-associated pathways and exhibiting a gene-based association P value below 0.01. (B) Locations of the rare variants associated with NPC at significance level of P < 1 × 10⁻⁴ within the genic regions of SELE. Gray arrows denote noncoding variants, blue arrows represent synonymous coding variants, and the red arrow indicates nonsynonymous coding variant predicted as “deleterious”. The rs5361 minor allele introduces a missense mutation at position 149, resulting in an aa substitution from S to R. The index SNV rs3917410 showed the most significant P value in the association tests in the discovery stage. (C) Comparative analysis of aa sequences across multiple species at position 149 and adjacent regions in SELE using the NCBI Multiple Sequence Alignment Viewer. (D) PolyPhen-2 prediction of SELE-S149R mutation. The variant is predicted as “probably damaging” with a score of 0.997, indicating a high likelihood of functional impact (sensitivity: 0.41; specificity: 0.98). The score ranges from 0 (benign) to 1 (damaging).
Figure 3
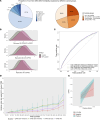
Figure 3. Contribution of common and rare variants to NPC susceptibility.
(A). Fractional representation of NPC heritability attributable to non-HLA WES-SNVs, categorized by MAF and LD. For each variant, MAF was calculated using the discovery samples, and LD score represented the aggregated R2 with adjacent variants spanning a 200 kb window. (B) Density plots illustrating the PRS incorporating the identified loci and previously known GWAS loci (rcPRS) for cases and controls in both the discovery and replication cohorts. (C) Receiver operating characteristic curves comparing the rcPRS and previously reported GWAS PRS (gPRS) for NPC across different cohorts. (D) Relative odds ratio comparing the rcPRS or gPRS bins and the 5% lowest quantile group in different cohorts. Stratification of individuals based on their NPC PRSs, either rcPRSs or gPRSs, revealed a more pronounced rising trend in the relative disease risk with the escalating rcPRS compared with the gPRS. (E) Correlation of rcPRS with disease status in individuals categorized by their EBV VCA-IgA status.
Figure 4
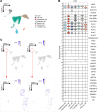
Figure 4. Expression patterns of identified and known NPC-associated genes across diverse cell types in NPC tumor tissues.
Single-cell transcriptomic analyses of 223,593 cells derived from NPC tumor tissues (n = 56). (A) UMAP plot of 223,593 single cells grouped into 7 major cell clusters as indicated in the right panel. (B) Violin plot illustrating normalized expression of NPC-associated genes across the major cell clusters indicated at the bottom. All epithelial cells captured in NPC tumor were malignant (see Methods). (C) The expression of the marker gene (VWF) for endothelial cells, alongside the identified NPC-associated gene SELE; top panel: initial UMAP plot, bottom panel: renormalized UMAP emphasizing cells highlighted by the red circles in the initial UMAP plot. Each dot represents 1 cell, and color heatmap from white to purple represents expression level from low to high.
Figure 5
Figure 5. rs2276868 regulates the expression of RPL14.
(A) Single-cell transcriptome analysis shows the mRNA expression of RPL14 in 15,623 malignant epithelial cells from 35 NPC samples grouped according to their rs2276868 genotypes (CC, CT, or TT). (B) Relative luciferase activity changes in 293T cells transfected with plasmids containing rs2276868-[C], -[T], or control vectors. (C) Pearson’s correlation analysis indicates the relationship between RPL14 and NKRF expression (measured as TPM) in transcriptome data of NPC patients from 2 cohorts, Bei-cohort (n = 93) and Zhang-cohort (n = 113). (D) RT-qPCR illustrates the mRNA expression of RPL14 in NPC cells transfected with NKRF siRNAs or control siRNA. (E and F) Relative luciferase activity in 293T cells cotransfected with the rs2276868-[C] or -[T] plasmids and NKRF siRNA (E) or NKRF overexpression vectors (F). Corresponding statistics are presented at the right. (G) Pearson’s correlation analysis indicates the relationship between NKRF and RPL14 expression in bulk RNA-Seq data are different for NPC patients with different genotypes. rs2276868-[CC/CT] patients have a stronger correlation than rs2276868-[TT] patients. (H) Schematic diagram indicates primer pairs used for PCR amplification of RPL14 fragments. (I and J) ChIP assay in S26 cells transfected with Flag-NKRF and control vectors. ChIP PCR (I) and qPCR (J) analyze the binding of NKRF on rs2276868 at RPL14 promoter in cells. P1-3 denotes primer pairs targeting genomic regions shown in H. Between-group comparisons: t test for 2 groups, 1-way ANOVA followed by Šidák’s post hoc test (comparisons among all groups) or Dunnett’s post hoc test (comparisons with the control group) for 2 or more group comparisons. *P < 0.05; **P < 0.01; ***P < 0.001; ****P<0.0001.
Figure 6
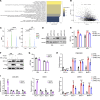
Figure 6. RPL14 inhibits EBV infection and lytic cycle activation in NPC cells.
(A) The top 20 pathways significantly associated with RPL14 expression in malignant epithelial cells from NPC tumor. (B) Correlation analysis between RPL14 expression and EBV-activity scores within malignant epithelial cells (dots). (C) Single-cell transcriptome analysis showing LMP1 and LMP2 expression in NPC samples with rs2276868-[CC], -[CT], or -[TT] genotypes. (D) Western blot assessment of the knockdown efficiency of RPL14 siRNAs or control siRNA in S26 and HK-1 cells. Actin was used as a loading control. (E) Flow cytometry quantification of GFP intensity for the EBV infection efficiency in the NPC cells described in D. (F) Western blot assay showing RPL14 protein expression in S26 and HK-1 cells infected with lentivirus stably expressing RPL14. Actin served as a loading control. (G) Flow cytometry assessment of EBV infection efficiency in the cells described in F, which was then infected with EBV. (H and I) RT-qPCR analysis of EBV lytic gene expression in CNE2-EBV and C666-1 cells transfected with RPL14 siRNAs or control siRNA (H) or infected with lentivirus stably expressing RPL14 vector or control vector (I). Between-group comparisons: t test for 2 groups, 1-way ANOVA followed by Šidák’s post hoc test (comparisons among all groups) or Dunnett’s post hoc test (comparisons with the control group) for comparisons among more than 2 groups. *P < 0.05; **P < 0.01; ***P < 0.001; ****P < 0.0001.
Figure 7
Figure 7. Tumor-suppressive function of RPL14 in NPC.
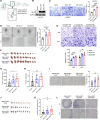
(A) Western blot analysis showing RPL14 protein levels in NPC cells infected with RPL14 overexpressing lentivirus. Actin serves as the loading control. (B) Cell growth curves of the cells described in A. (C) Colony formation assay for the cells described in A. Corresponding statistical analysis is shown below. (D) Transwell migration assay evaluating the migration ability of the cells described in A. Scale bar: 50 μm. The statistical analysis is presented on the right. (EH) Tumor growth evaluation in a nude mouse model with subcutaneous injection of CNE2-EBV cells described in A. Tumor volumes were measured every 3 days. Visual presentation of tumor after sacrifice (F) and weight (G) were presented. IF detection of Ki-67 expression (H) in the tumors described in F, and the corresponding statistical analysis is shown on the right. Scale bar: 50 μm. (I) Transcriptomic analysis showcasing mRNA levels of RPL14 in NPC (n = 87) versus control samples (n = 10). (J) Kaplan-Meier survival curve and Cox’s regression analyses linking RPL14 expression to overall survival (OS) of NPC patients in the Chen et al. cohort (n = 150). RPL14 expression levels were adjusted using EPCAM expression to account for the epithelial cell proportion in tumor tissue and subsequently scaled to a mean of 0 and a variance of 1. P(Cox) and HR(Cox) represent the P value and hazard ratio for the effect of RPL14 expression on OS in the Cox-regression model, adjusting age and sex. 95%CI: 95% confidence interval. P(log-rank): P value from the log-rank test comparing 2 groups with high (red) versus low (blue) RPL14 expression, determined by the median in the Kaplan-Meier analysis. Statistical method for between-group comparisons: t test. *P < 0.05; **P < 0.01; ***P < 0.001; ****P < 0.0001.
Figure 8
Figure 8. SELE-S149R mutation in endothelial cells promotes the tumorigenesis and metastasis of NPC cells.
(A) Structure prediction of E-selectin paired with glycomimetic antagonist ligand 2-acetamido-2-deoxy-beta-d-glucopyranose (PDB code 4C16). The spatial proximity between Ser149 and the ligand is highlighted. Both the Ser149 side chain and the ligand are shown as sticks, with the distances between the OG atom of Ser149 and the C8 or O7 atoms of the ligand specified. (B) Western blot examination of SELE protein level in HUVEC cells infected with lentivirus overexpressing SELE-WT, S149R mutant, or control vectors. (C) Transwell migration assay evaluating the migration ability of the cells described in B, with statistical analysis presented to the right. Scale bar: 100 μm. (D) Tube-formation assay with cells described in B. The statistical analysis is presented on the right. Scale bars: 100 μm. (E) Transwell migration assay assessing the migration ability of NPC cell lines (S26 and HK-1) cocultured with HUVEC cells from B (S26/HK-1: HUVEC = 10:1). The statistics are presented at the bottom. Scale bars: 200 μm. (FH) Tumor growth evaluation in xenograft model with subcutaneous injection of S26 cells described in E. Tumor volumes (G) are measured; visual presentation (F) and weight (H) of tumor after sacrifice are presented. (I) Representative image for IHC staining of CD34 in tumors presented in F. The statistics are presented on the right. Scale bars: 100 μm. (JL) Tumor lymphatic metastasis of S26 cells described in E. Lymph nodes are visualized (J) and measured (K), with H&E staining conducted to assess metastasis in these lymph nodes, of which representative image is shown (L). Scale bar: 100 μm. One-way ANOVA followed by Šidák’s post hoc test was applied to comparisons among all groups or Dunnett’s post hoc test was applied to comparisons with the control group for comparisons among more than 2 groups. *P < 0.05; **P < 0.01; ***P < 0.001; ****P<0.0001.

References

    1. Chen Y-P, et al. Gemcitabine and cisplatin induction chemotherapy in nasopharyngeal carcinoma. N Engl J Med. 2019;381(12):1124–1135. doi: 10.1056/NEJMoa1905287. - DOI - PubMed
    1. Wei KR, et al. Nasopharyngeal carcinoma incidence and mortality in China, 2013. Chin J Cancer. 2017;36(1):90. doi: 10.1186/s40880-017-0257-9. - DOI - PMC - PubMed
    1. Chen C, et al. Multiple risk factors of nasopharyngeal carcinoma: Epstein-Barr virus, malarial infection, cigarette smoking and familial tendency. Anticancer Res. 1990;10(2b):547–553. - PubMed
    1. Lu S-J, et al. Linkage of a nasopharyngeal carcinoma susceptibility locus to the HLA region. Nature. 1990;346(6283):470–471. doi: 10.1038/346470a0. - DOI - PubMed
    1. Bei JX, et al. A genome-wide association study of nasopharyngeal carcinoma identifies three new susceptibility loci. Nat Genet. 2010;42(7):599–603. doi: 10.1038/ng.601. - DOI - PubMed

MeSH terms