. 2025 Jan 2;135(1):e174981.
doi: 10.1172/JCI174981.

Human intraepithelial mast cell differentiation and effector function are directed by TGF-β signaling

Affiliations

Human intraepithelial mast cell differentiation and effector function are directed by TGF-β signaling

Tahereh Derakhshan et al. J Clin Invest. .

Abstract

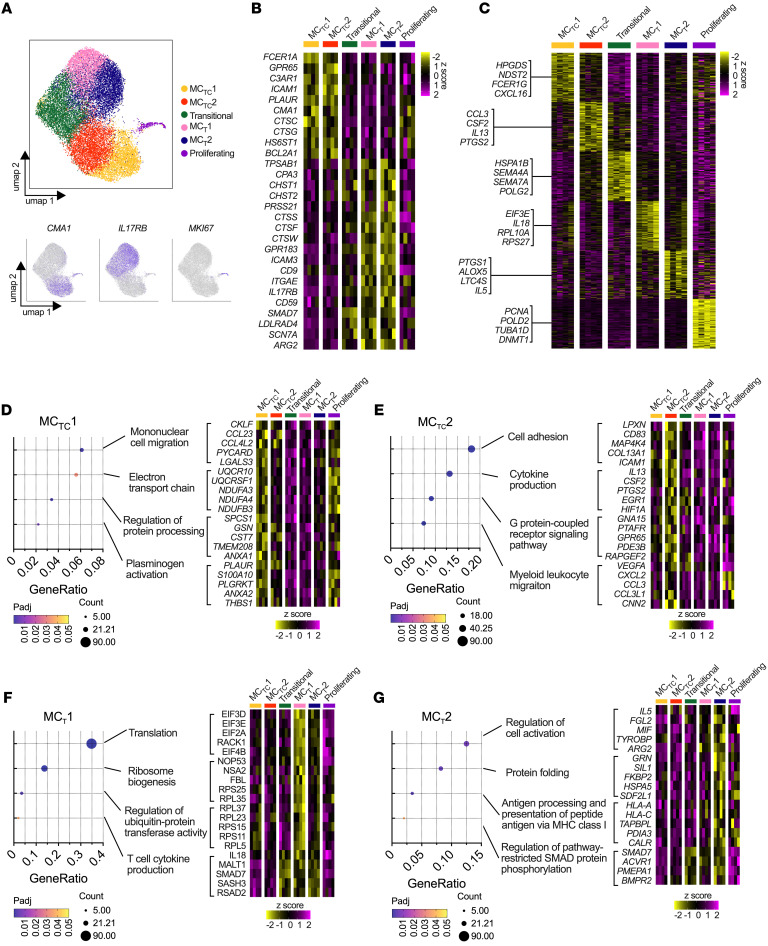
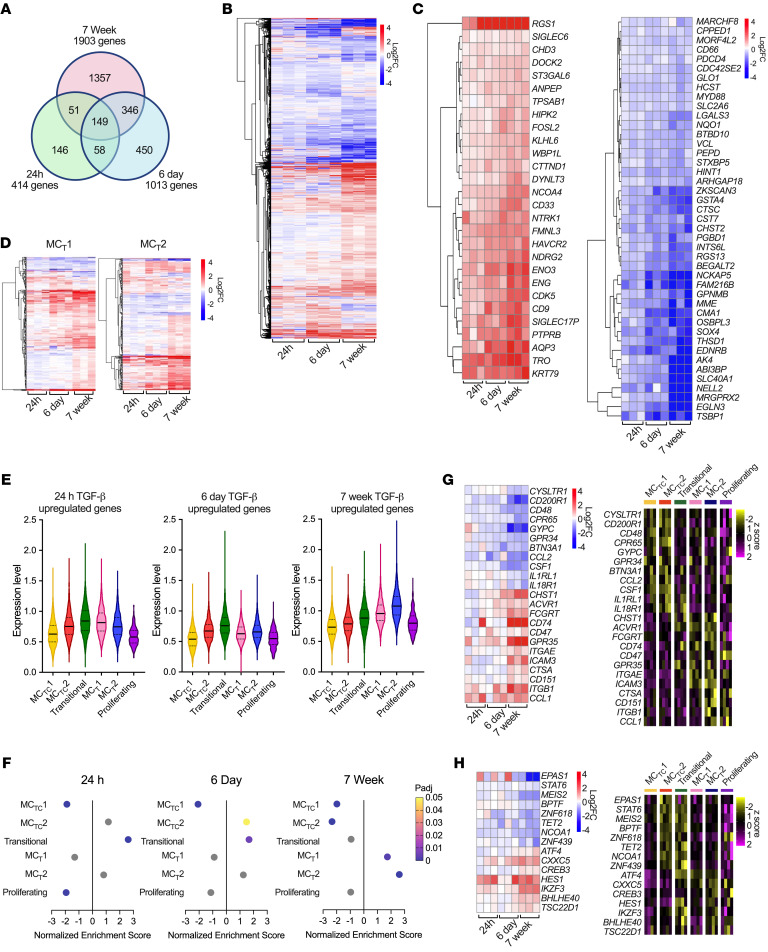
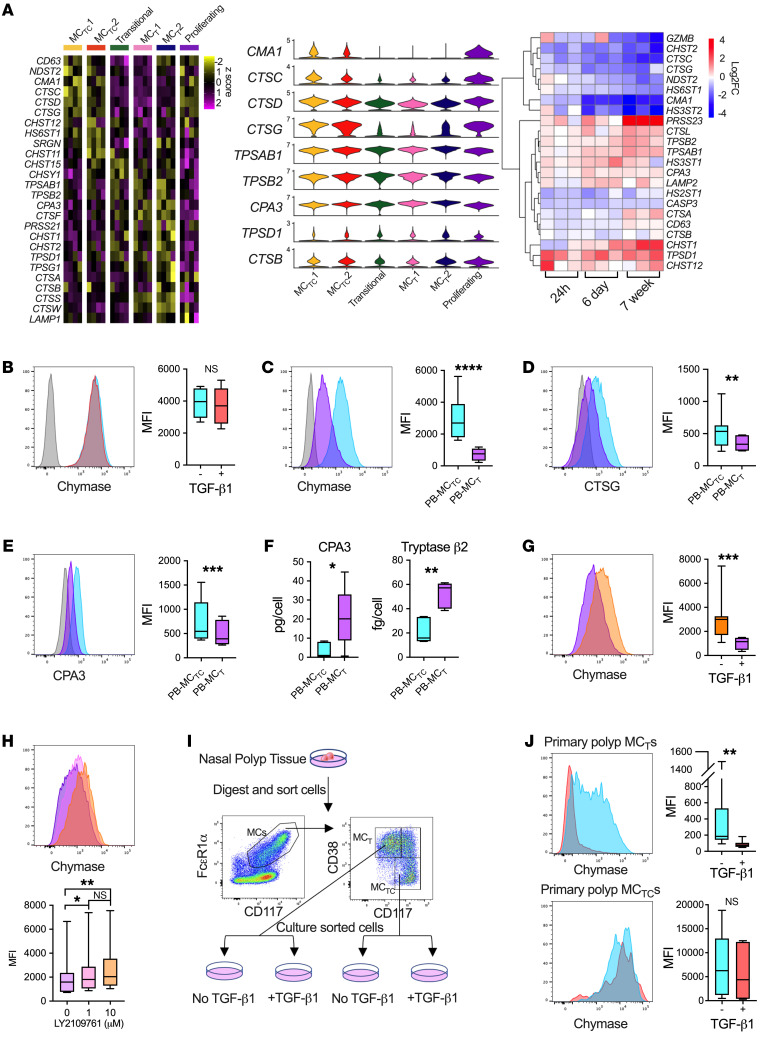
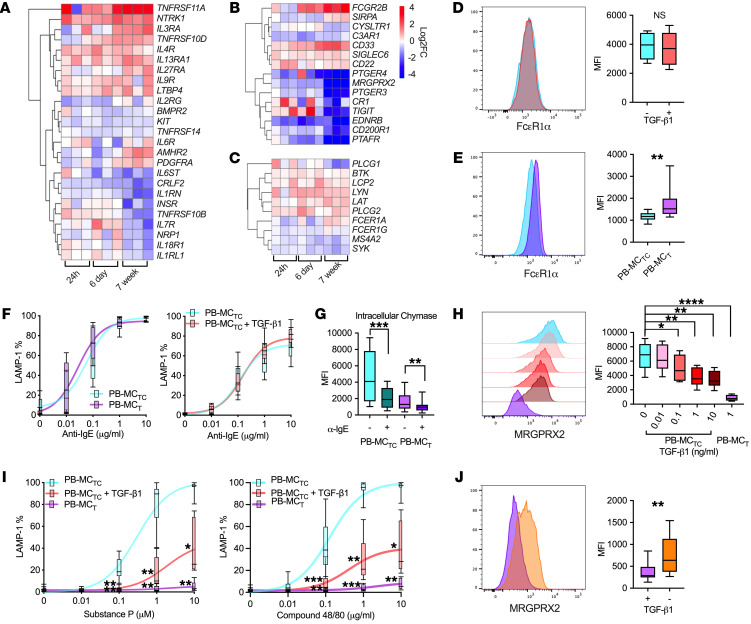
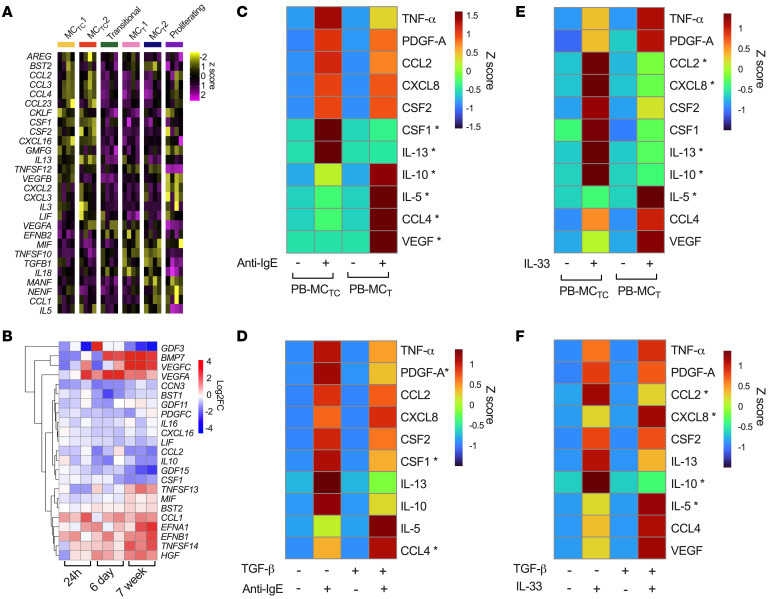
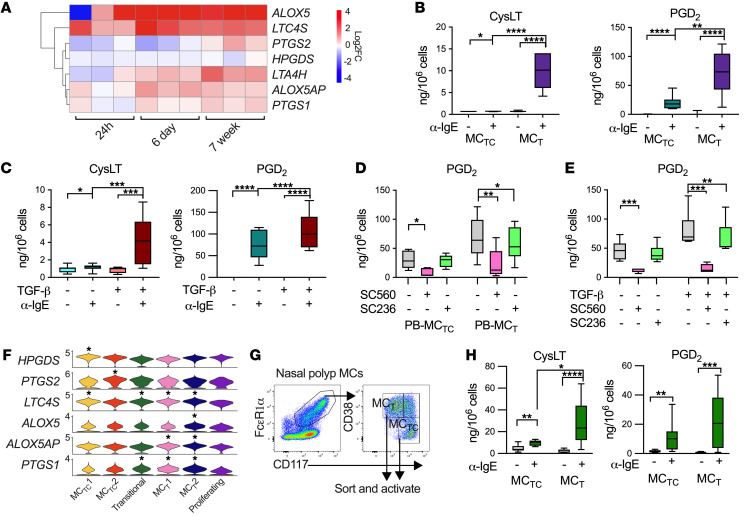
Mast cells (MCs) expressing a distinctive protease phenotype (MCTs) selectively expand within the epithelium of human mucosal tissues during type 2 (T2) inflammation. While MCTs are phenotypically distinct from subepithelial MCs (MCTCs), signals driving human MCT differentiation and this subset's contribution to inflammation remain unexplored. Here, we have identified TGF-β as a key driver of the MCT transcriptome in nasal polyps. We found that short-term TGF-β signaling alters MC cell surface receptor expression and partially recapitulated the in vivo MCT transcriptome, while TGF-β signaling during MC differentiation upregulated a larger number of MCT-associated transcripts. TGF-β inhibited the hallmark MCTC proteases chymase and cathepsin G at both the transcript and protein level, allowing selective in vitro differentiation of MCTs for functional study. We identified discrete differences in effector phenotype between in vitro-derived MCTs and MCTCs, with MCTs exhibiting enhanced proinflammatory lipid mediator generation and a distinct cytokine, chemokine, and growth factor production profile in response to both innate and adaptive stimuli, recapitulating functional features of their tissue-associated counterpart MC subsets. Thus, our findings support a role for TGF-β in promoting human MCT differentiation and identified a discrete contribution of this cell type to T2 inflammation.

Keywords: Allergy; Asthma; Immunology; Mast cells.


Conflict of interest statement

Conflict of interest: The authors have declared that no conflict of interest exists.

Figures

Figure 1
Figure 1. Phenotypic heterogeneity of MCs is marked by expression of distinct transcriptional cassettes.
(A) Uniform manifold approximation and projection (UMAP) depiction of 6 MC clusters identified through scRNA-Seq analysis of MCs sorted from 4 AERD patients (top), with expression patterns for select subset-associated transcripts (bottom). (B) Row-normalized heatmap of common genes expressed by MCTC and MCT clusters (FDR < 0.05, log2FoldChange > 0.5, DESeq2) (C) Row-normalized heatmap of top differentially expressed genes across clusters (FDR < 0.05, log2FoldChange > 0.5, DESeq2), with representative cluster-enriched genes highlighted. (DG) Enrichment of biological processes in (D) MCTC1, (E) MCTC2, and (F) MCT1, and (G) MCT2 clusters with row-normalized heatmaps showing expression of select process-associated genes. Heatmap columns indicate average cluster expression for each of n = 4 individuals; scale bars denote z score.
Figure 2
Figure 2. TGF-β signaling during MC development elicits an MCT-like transcriptional phenotype.
(A) Venn diagram showing common versus timepoint-specific differentially expressed in PB-MC treated with TGF-β1 for 24 hours (green) and 6 days (blue) or PB-MCs differentiated in TGF-β1 for 7 weeks (pink) (FDR < 0.05, DESeq2). (B and C) Heatmap of (B) all differentially expressed genes and (C) transcripts showing gradients of upregulation (left) or downregulation (right) following TGF-β1 treatment (FDR < 0.05, DESeq2); color indicates log2fold change versus untreated samples. (D) Heatmap of differentially expressed genes associated with MCT1 (left) and MCT2 (right) clusters. (E) Violin plots showing per-cell expression as a percentage of all transcripts for timepoint-specific TGF-β1 target genes in PB-MCs treated with TGF-β1 for 24 hours, 6 days, or differentiated in TGF-β1 across AERD MC clusters (Padj matrix shown in Supplemental Figure 6A). (F) GSEA for 7-week, 6-day, and 24-hour TGF-β in vitro signatures across AERD MC clusters, showing normalized enrichment score and adjusted P values. Gray color indicates statistically insignificant positive or negative enrichment. (G and H) Heatmap of (G) selected differentially expressed genes and (H) transcription factors both restricted to PB-MCs differentiated in TGF-β1 across time points (left) and differentially expressed across AERD MC clusters (right). Heatmaps show log2FoldChange versus untreated for each donor (bulk) or donor-averaged expression values (scRNA-Seq); scale bars show log2FoldChange versus untreated (bulk) or z score (scRNA-Seq).
Figure 3
Figure 3. TGF-β signaling directs the MCT protease phenotype during early development.
(A) Differentially expressed genes encoding granule components in vivo (left), with violin plots for select proteases (center), and in vitro gene expression for PB-MC stimulated with TGF-β1 for 24 hours, 6 days, or differentiated in TGF-β1 (right). Columns indicate donor-averaged cluster expression (scRNA-Seq) or log2FoldChange versus untreated for each donor (bulk); scale bars denote z score (scRNA-Seq) or log2FoldChange (bulk), FDR < 0.05, log2FoldChange > 0.5 for scRNA-Seq and FDR < 0.05 for bulk (DESeq2). (B) Chymase expression and quantification in PB-MCs treated with (red) or without (blue) TGF-β1 for 6 days versus isotype control (gray). n = 6 individual donors (t test). (CE) Expression and quantification of (C) chymase, (D) CTSG, and (E) CPA3 in PB-MCs differentiated with (purple) or without (blue) TGF-β1 versus isotype control (gray). n = 7–8 individual donors. **P < 0.01; ***P < 0.001; ****P < 0.0001 (t test). (F) One-week CPA3 and tryptase β2 release in PB-MCT versus PB-MCTC supernatants. n = 6 and 5 individual donors, respectively. *P < 0.05; **P < 0.01 (Mann-Whitney). (G) Chymase expression and quantification for PB-MCs differentiated in TGF-β1 and subsequently cultured with (purple) or without (orange) TGF-β1 for 2 weeks. n = 8 individual donors. ***P < 0.001 (t test). (H) Chymase expression and quantification for PB-MCT cocultured with EpCs for 2 weeks supplemented with SCF (100 ng/mL), IL-6 (50 ng/mL), and the indicated concentration of LY2109761. n = 8. *Padj < 0.05, **Padj < 0.01 (ANOVA) (I) Gating strategy to isolate nasal polyp MCTs and MCTCs. (J) Chymase expression and quantification for primary nasal polyp MCTs (top) or MCTCs (bottom) maintained in culture media with (red) or without (blue) TGF-β1 for 2 weeks. n = 6–7 for nasal polyp MCs. **P < 0.01 (t test). Box-and-whisker plots show median, interquartile range, and minimum/maximum values observed.
Figure 4
Figure 4. TGF-β selectively regulates MC expression of activating receptors.
(AC) Heatmaps of select differentially expressed transcripts encoding (A) cytokine, chemokine, and growth factor receptors, (B) activating and inhibitory receptors, and (C) FcɛR1 signaling pathway components following PB-MC stimulation with TGF-β1 for 24 hours or 6 days or differentiation of MCs in TGF-β1 for 7 weeks. Heatmaps show log2FoldChange expression of genes versus unstimulated cells at each time point. Columns indicate individual donors, FDR < 0.05 (DESeq2). (D) Representative flow plot and quantification of FcɛR1α expression by PB-MCTCs treated with (red) or without (blue) TGF-β1 for 6 days. n = 12 (t test). (E) Expression and quantification of FcɛR1α in PB-MCTs (purple) versus PB-MCTCs (blue). n = 8. **P < 0.01 (t test). (F) Degranulation of PB-MCTCs treated with or without TGF-β1 for 6 days (left) or PB-MCTs (right) at 1 hour after activation with anti-IgE. n = 5 individual donors (ANOVA). (G) Intracellular chymase content of PB-MCTC (light blue) and PB-MCT (purple) at baseline and following degranulation with anti-IgE. n = 7 individual donors. **Padj < 0.01; ***Padj < 0.001 (ANOVA). (H) MRGPRX2 expression and quantification for PB-MCTCs following 6-day treatment with (red gradient) or without (blue) TGF-β1 and PB-MCTs (purple). n = 8 individual donors. **Padj < 0.01; ***Padj < 0.001; ****Padj < 0.0001 (ANOVA). (I) Degranulation of PB-MCTCs treated with (red) or without (blue) TGF-β1 for 6 days, and PB-MCTs (purple) following 1 hour stimulation with MRGPRX2 ligands compound 48/80 (left) and substance P (right). n = 5–6 individual donors. **Padj < 0.01; ***Padj < 0.001; ****Padj < 0.0001 (ANOVA). (J) Representative flow plot and quantification of MRGPRX2 expression by PB-MCTs maintained in culture media with (purple) or without (orange) TGF-β1 for 2 weeks. n = 8 individual donors. **P < 0.01 (t test). Box-and-whisker plots show median, interquartile range, and minimum/maximum values observed.
Figure 5
Figure 5. TGF-β selectively reshapes MC proinflammatory cytokine, chemokine, and growth factor production following IgE crosslinking.
(A) Row-normalized heatmap of differentially expressed genes associated with cytokine, chemokine, and growth factors across nasal polyp MC clusters. Columns show averaged expression by donor; scale bar denotes z score. FDR < 0.05, log2FoldChange > 0.5 (DESeq2). (B) Heatmap showing differentially expressed transcripts in TGF-β1–stimulated cells. Columns show individual donors; scale bars indicate log2FoldChange versus unstimulated controls. FDR < 0.05 (DESeq2) (C and D) Row-normalized average data of n = 6 individual donors showing protein secretion of cytokines, chemokines, and growth factors at 6 hours following anti-IgE activation by (C) PB-MCTCs versus PB-MCTs and (D) PB-MCTCs cultured with or without TGF-β1 for 6 days. (E and F) Row-normalized average data of n = 6 individual donors showing release of cytokines, chemokines, and growth factors at 6 hours after IL-33 stimulus by (E) PB-MCTCs versus PB-MCTs and (F) PB-MCTCs cultured with or without TGF-β1 for 6 days. Scale bars denote z score. *Padj < 0.05 between activated PB-MCT and PB-MCTC (ANOVA).
Figure 6
Figure 6. TGF-β enhances MC lipid mediator production.
(A) Heatmap showing genes associated with eicosanoid biosynthesis differentially regulated by TGF-β1. n = 3 individual donors. FDR < 0.05, log2FoldChange > 0.5 (DESeq2). Scale bar indicates log2FoldChange versus unstimulated control samples. (B) CysLTs (left) and PGD2 (right) production by PB-MCTCs versus PB-MCTs and activated with anti-IgE for 1 hour. n = 8–9 individual donors. *Padj < 0.05; **Padj < 0.01; ****Padj < 0.0001 (ANOVA). (C) CysLTs (left) and PGD2 (right) production by PB-MCTCs treated with or without TGF-β1 for 6 days and activated with anti-IgE for 1 hour. n = 15 individual donors. * Padj < 0.05; *** Padj < 0.001; ****Padj < 0.0001 (ANOVA). (D and E) Effects of selective inhibitors for COX-1 (SC560) and COX-2 (SC236) on PGD2 production by (D) PB-MCTCs versus PB-MCTs or (E) PB-MCTCs treated with TGF-β1 for 6 days prior to activation with anti-IgE. n = 6 individual donors. * Padj < 0.05; ** Padj < 0.01; *** Padj < 0.001 (ANOVA). (F) Violin plots of differentially expressed genes associated with CysLTs and PGD2 biosynthesis across polyp MC clusters, FDR< 0.05, log2FoldChange > 0.5 (DESeq2). (G) Gating strategy to isolate nasal polyp MCT and MCTCs (left). (H) Eicosanoid production following activation with anti-IgE for 1 hour (right). n = 9 individual donors. * Padj < 0.05; **Padj < 0.01; *** Padj < 0.001; ****Padj < 0.0001 (ANOVA). Box-and-whisker plots show median, interquartile range, and minimum/maximum values observed.

Comment in

  • TGF-β drives differentiation of intraepithelial mast cells in inflamed airway mucosa

Similar articles

Cited by

References

    1. Gurish MF, Austen KF. Developmental origin and functional specialization of mast cell subsets. Immunity. 2012;37(1):25–33. doi: 10.1016/j.immuni.2012.07.003. - DOI - PubMed
    1. Metcalfe DD, et al. Mast cells. Physiol Rev. 1997;77(4):1033–1079. doi: 10.1152/physrev.1997.77.4.1033. - DOI - PubMed
    1. Dwyer DF, et al. Human airway mast cells proliferate and acquire distinct inflammation-driven phenotypes during type 2 inflammation. Sci Immunol. 2021;6(56):eabb7221. doi: 10.1126/sciimmunol.abb7221. - DOI - PMC - PubMed
    1. Takabayashi T, et al. Glandular mast cells with distinct phenotype are highly elevated in chronic rhinosinusitis with nasal polyps. J Allergy Clin Immunol. 2012;130(2):410–20. doi: 10.1016/j.jaci.2012.02.046. - DOI - PMC - PubMed
    1. Abonia JP, et al. Involvement of mast cells in eosinophilic esophagitis. J Allergy Clin Immunol. 2010;126(1):140–149. doi: 10.1016/j.jaci.2010.04.009. - DOI - PMC - PubMed

MeSH terms