. 2025 Jan 2;135(1):e163587.
doi: 10.1172/JCI163587.

ATRX silences Cartpt expression in osteoblastic cells during skeletal development

Affiliations

ATRX silences Cartpt expression in osteoblastic cells during skeletal development

Yi-Ting Chen et al. J Clin Invest. .

Abstract

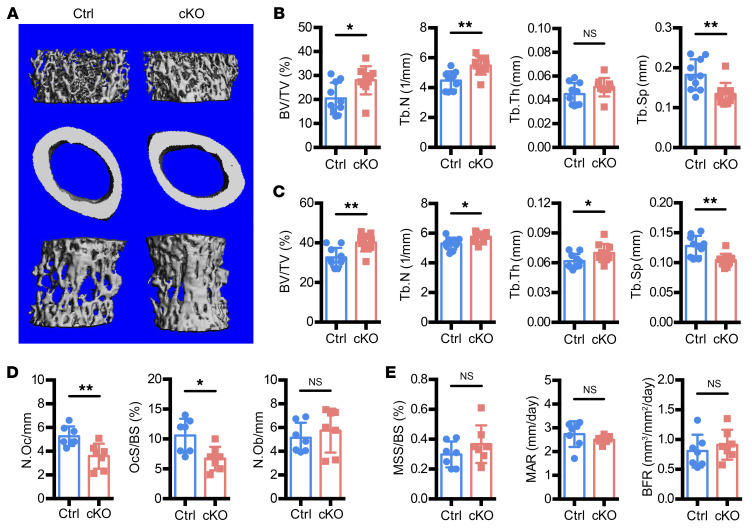
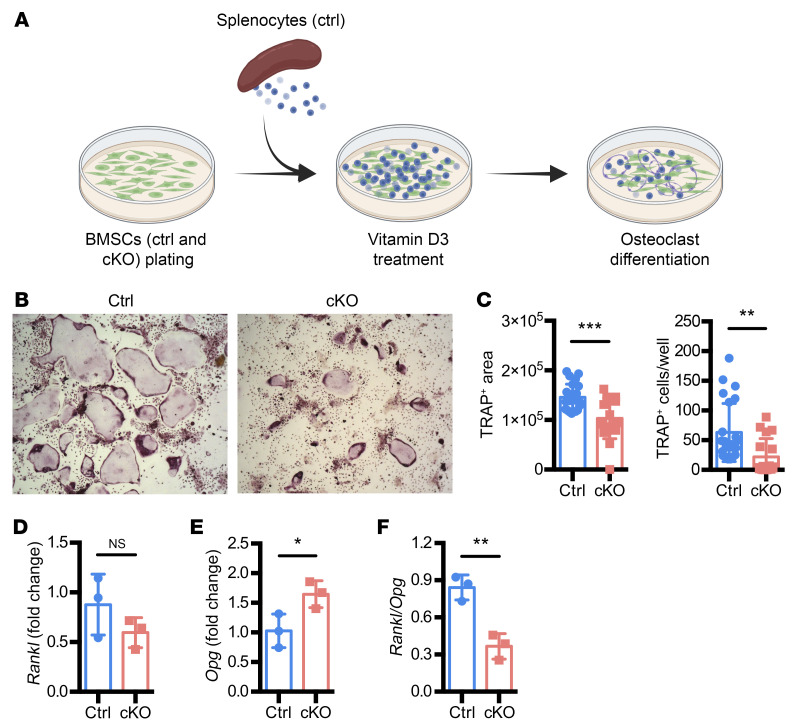
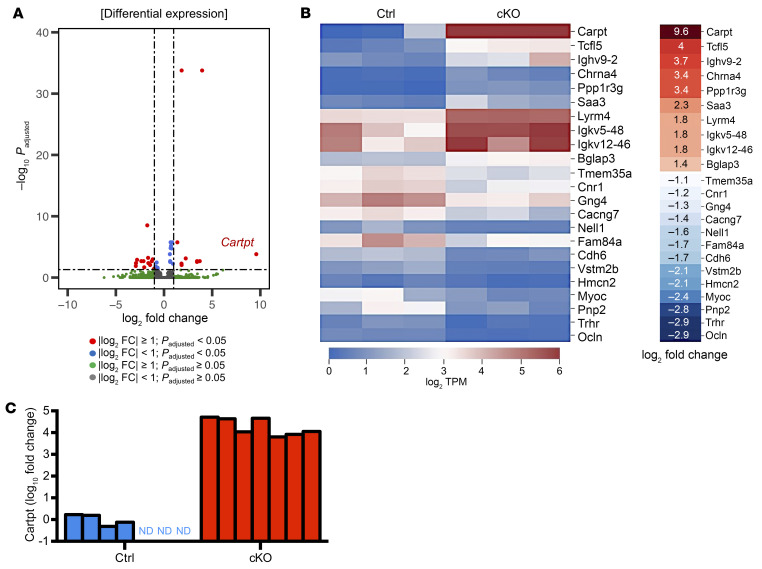
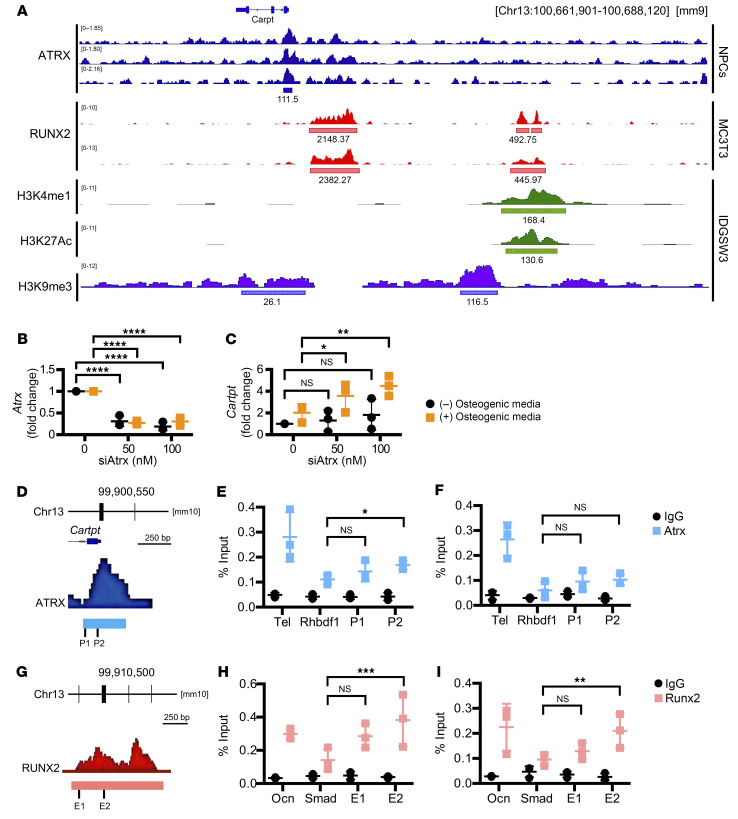
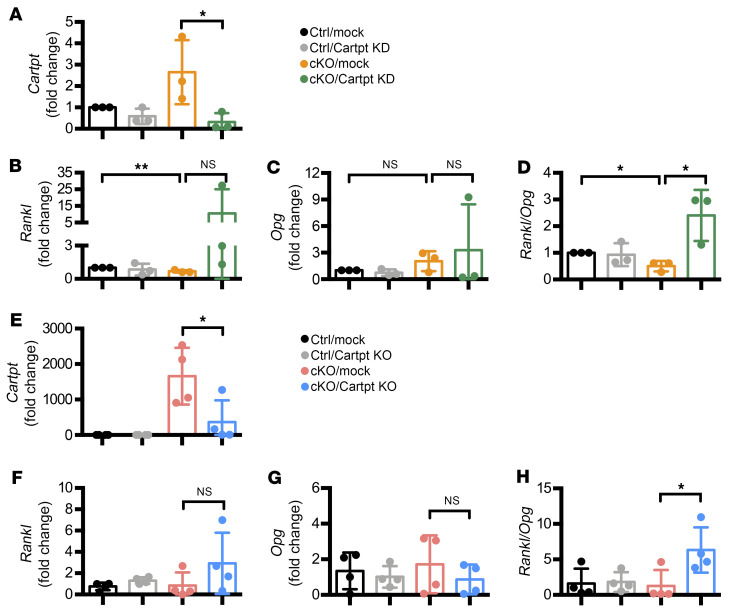
ATP-dependent chromatin remodeling protein ATRX is an essential regulator involved in maintenance of DNA structure and chromatin state and regulation of gene expression during development. ATRX was originally identified as the monogenic cause of X-linked α-thalassemia mental retardation (ATR-X) syndrome. Affected individuals display a variety of developmental abnormalities and skeletal deformities. Studies from others investigated the role of ATRX in skeletal development by tissue-specific Atrx knockout. However, the impact of ATRX during early skeletal development has not been examined. Using preosteoblast-specific Atrx conditional knockout mice, we observed increased trabecular bone mass and decreased osteoclast number in bone. In vitro coculture of Atrx conditional knockout bone marrow stromal cells (BMSCs) with WT splenocytes showed impaired osteoclast differentiation. Additionally, Atrx deletion was associated with decreased receptor activator of nuclear factor κ-B ligand (Rankl)/ osteoprotegerin (Opg) expression ratio in BMSCs. Notably, Atrx-deficient osteolineage cells expressed high levels of the neuropeptide cocaine- and amphetamine-regulated transcript prepropeptide (Cartpt). Mechanistically, ATRX suppresses Cartpt transcription by binding to the promoter, which is otherwise poised for Cartpt expression by RUNX2 binding to the distal enhancer. Finally, Cartpt silencing in Atrx conditional knockout BMSCs rescued the molecular phenotype by increasing the Rankl/Opg expression ratio. Together, our data show a potent repressor function of ATRX in restricting Cartpt expression during skeletal development.

Keywords: Bone biology; Bone development.


Conflict of interest statement

Conflict of interest: The authors have declared that no conflict of interest exists.

Figures

Figure 1
Figure 1. Deletion of Atrx in preosteoblasts causes increased trabecular bone mass.
(A) Representative micro-CT images of control (Ctrl) and Atrx-cKO (cKO) mice at 8 weeks old. Top, trabecular bone at the distal femurs; middle, cortical bone at the midshaft femurs; bottom, trabecular bone at the fourth lumbar vertebrae. (B and C) Parameters of trabecular (BV/TV, Tb.N, Tb.Th, Tb.Sp) and cortical microarchitecture (Ct.Th) were analyzed in (B) femurs and (C) vertebrae of 8-week-old male mice. (D) Histomorphometric analysis of femurs in control and Atrx-cKO mice. (E) Dynamic histomorphometry analysis by calcein/alizarin red double labeling. BFR/BS, bone formation rate in control and Atrx-cKO mice. n = 7 per group. Data are represented as means with ± SD. Student’s t test. *P < 0.05; **P < 0.01.
Figure 2
Figure 2. Atrx deletion in preosteoblast decreases osteoclast differentiation that is associated with reduced Rankl/Opg expression ratio in BMSCs.
(A) Schematic illustration of in vitro osteoclast differentiation assay. Ctrl, cells isolated from 8-week-old Atrxfl/y control mice; cKO, cells isolated from 8-week-old Atrx-cKO mice. (B and C) TRAP staining of multinucleated cells. Representative microscopic view of the cells after TRAP staining (B); quantification of TRAP-positive area and TRAP-positive cell number per well (C). Original magnification, ×5. n = 4 for Atrxfl/y control; n = 3 for Atrx-cKO. Six technical replicates were included in the quantification. (DF) RT-qPCR results of Rankl (D), Opg (E), and Rankl/Opg ratio (F) in BMSCs from control and Atrx-cKO mice. n = 3 per group. Data are presented as means with ± SD. Student’s t test. *P < 0.05; **P < 0.01; ***P < 0.005.
Figure 3
Figure 3. RNA-Seq analysis reveals Cartpt upregulation in Atrx-cKO mice.
(A) Volcano plot of all DEGs identified from the DEG analysis with the thresholds of log2-fold change (FC) = 1 and Padjust value < 0.05. Cartpt showed high levels of expression with log2-FC = 9.6 and Padjust value < 0.0005. n = 3 per group. (B) Heatmap of all upregulated and downregulated DEGs color coded by log2 TPM and ranked by the log2 FC between the Atrx-cKO and control group. n = 3 per group. (C) RT-qPCR confirmation of RNA-Seq results for Cartpt. n = 7 per group. ND, not detected.
Figure 4
Figure 4. Cartpt is highly expressed in the osteoblastic lineage cells of Atrx-cKO mice.
(A and B) (A) Images of CART peptides IHC staining in femurs at 8 weeks of age. High-magnification images are shown in white boxes on the bottom right. Scale bars: 100 μm. (B) IF stains for GFP-Cre fusion protein (green) and CART peptides (red) at 8 weeks of age in the control and Atrx-cKO. High-magnification image of CART-positive cells in Atrx-cKO is shown in white boxes on the bottom right. Scale bars: 50 μm. CART, CART peptides. (C) ELISA of serum CART peptides at 8 weeks of age. n = 8 for control; n = 7 for Atrx-cKO. (D) RT-qPCR results of Cartpt expression in hypothalamus. n = 6 per group. (E) CART peptides IHC staining in hypothalamus at 8 weeks of age. Scale bars: 100 μm. Data are represented as means with ± SD. Student’s t test. **P < 0.01. Representative images of n = 3 per group are shown.
Figure 5
Figure 5. ATRX and RUNX2 bind to the regulatory regions of Cartpt.
(A) Genome browser representations of published ATRX, RUNX2, H3K4me1, H3K27Ac, and H3K9me3 ChIP-Seqs near Cartpt. ATRX, ATRX ChIP-Seq in mouse NPCs. RUNX2, RUNX2 ChIP-Seq in differentiated MC3T3 cells. H3K4me1/H3K27Ac/H3K9me3, H3K4me1, H3K27Ac, and H3K9me3 ChIP-Seqs in IDGSW3 cells. Data represented as read density in reads normalized to 108. Blue, pink, and green boxes indicate peak regions. The peak score under each color box was based on peak calling analysis. (B and C) RT-qPCR results of Atrx (B) and Cartpt (C) expression in MC3T3 cells transfected with 100 nM siControl (shown as 0 nM) or siAtrx (shown as 50 nM and 100 nM). Black, cells at the undifferentiated state; orange, cell differentiating for 3 days in osteogenic media. n = 3 per group. Data are presented as means with ± SD. Two-way ANOVA. *P < 0.05; **P < 0.01; ****P < 0.001. (DF) ATRX ChIP-qPCR in MC3T3 cells. Primer design at the edge (P1) or peak (P2) of the ATRX binding near the Cartpt promoter region (D). ATRX ChIP-qPCR in MC3T3 cells at undifferentiated (E) and differentiated (F) (cell differentiating for 5 days) state. Tel, positive control of ATRX bindings at telomere; Rhbdf1, negative control of ATRX bindings at the Rhbdf1 intron region. n = 3 per group. (GI) RUNX2 ChIP-qPCR in MC3T3 cells. Primer design at the edge (E1) or peak (E2) of the RUNX2 binding 10 kbp upstream of the Cartpt promoter (G). RUNX2 ChIP-qPCR in MC3T3 cells at undifferentiated (H) and differentiated (I) (cell differentiating for 5 days) state. Ocn, positive control of RUNX2 bindings at the Ocn promoter; Smad, negative control of RUNX2 bindings at the Smad4 intron region. n = 3 per group. Data are represented as means with ± SD. Two-way ANOVA. *P < 0.05; **P < 0.01; ***P < 0.005.
Figure 6
Figure 6. Cartpt loss increases Rankl/Opg ratio in Atrx-cKO BMSCs.
(AD) RT-qPCR results of Cartpt (A), Rankl (B), Opg (C), and Rankl/Opg ratio (D) in BMSCs isolated from control (Ctrl) and Atrx-cKO (cKO) mice. The cells were transfected with 10 nM siControl (mock) or 10 nM siCartpt (Cartpt KD). After overnight incubation, the cells were cultured in the osteogenic media for 3 days. n = 3 per group. (EH) RT-qPCR results of Cartpt (E), Rankl (F), Opg (G), and Rankl/Opg (H) expression ratio in BMSCs isolated from Ctrl and cKO mice. The cells were transfected with 1 μg of the pegRNA plasmid (mock or Cartpt KO) and 0.5 μg of pCMV-PE2-GFP. The transfected cells were treated with osteogenic media for 3 days. n = 4 per group. Data are represented as means with ± SD. One-way ANOVA. *P < 0.05; **P < 0.01.

References

    1. Teng YC, et al. ATRX promotes heterochromatin formation to protect cells from G-quadruplex DNA-mediated stress. Nat Commun. 2021;12(1):3887. doi: 10.1038/s41467-021-24206-5. - DOI - PMC - PubMed
    1. Levy MA, et al. ATRX promotes gene expression by facilitating transcriptional elongation through guanine-rich coding regions. Hum Mol Genet. 2014;24(7):1824–1835. doi: 10.1093/hmg/ddu596. - DOI - PubMed
    1. Ratnakumar K, et al. ATRX-mediated chromatin association of histone variant macroH2A1 regulates α-globin expression. Genes Dev. 2012;26(5):433–438. doi: 10.1101/gad.179416.111. - DOI - PMC - PubMed
    1. Dyer MA, et al. ATRX and DAXX: mechanisms and mutations. Cold Spring Harb Perspect Med. 2017;7(3):a026567. doi: 10.1101/cshperspect.a026567. - DOI - PMC - PubMed
    1. Watson LA, et al. Emerging roles of ATRX in cancer. Epigenomics. 2015;7(8):1365–1378. doi: 10.2217/epi.15.82. - DOI - PubMed

MeSH terms