. 2025 Jan 1;152(1):dev204438.
doi: 10.1242/dev.204438. Epub 2025 Jan 9.

Spinal cord elongation enables proportional regulation of the zebrafish posterior body

Affiliations

Spinal cord elongation enables proportional regulation of the zebrafish posterior body

Dillan Saunders et al. Development. .

Abstract

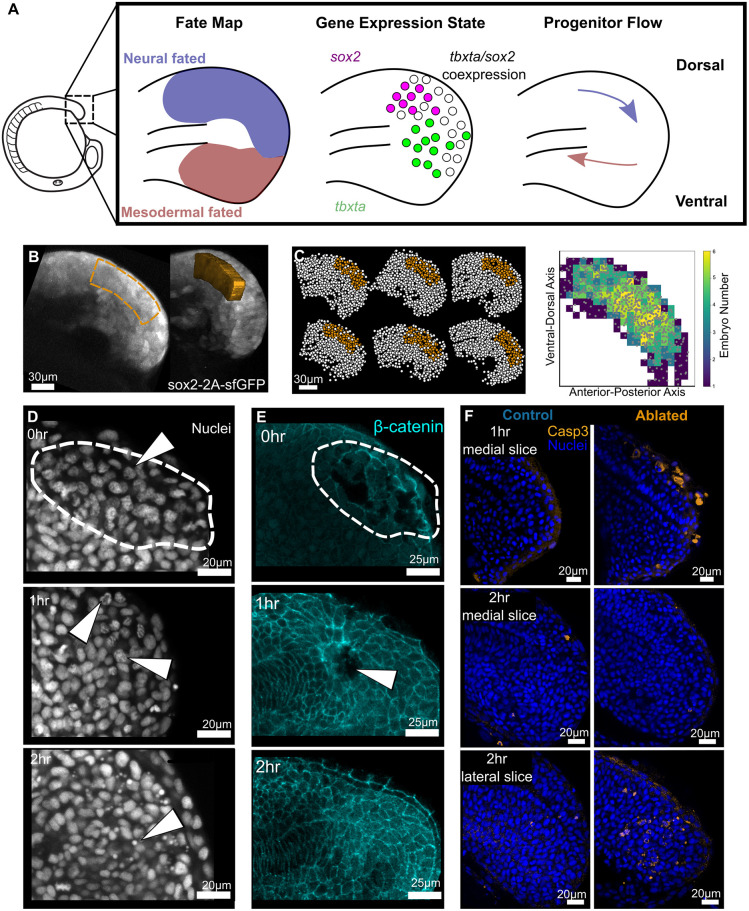
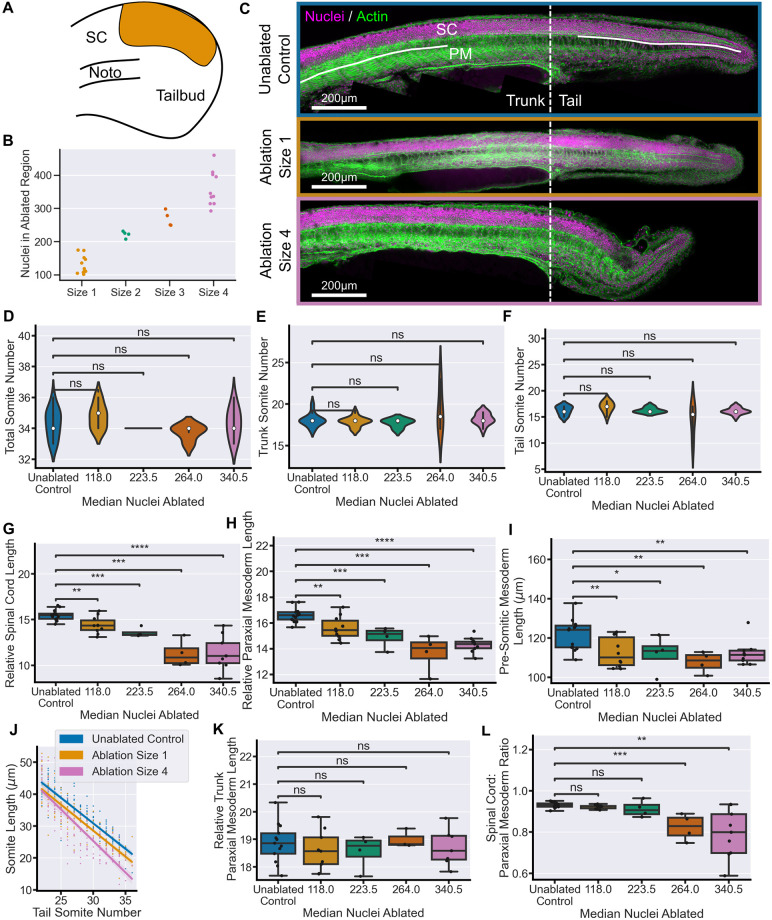
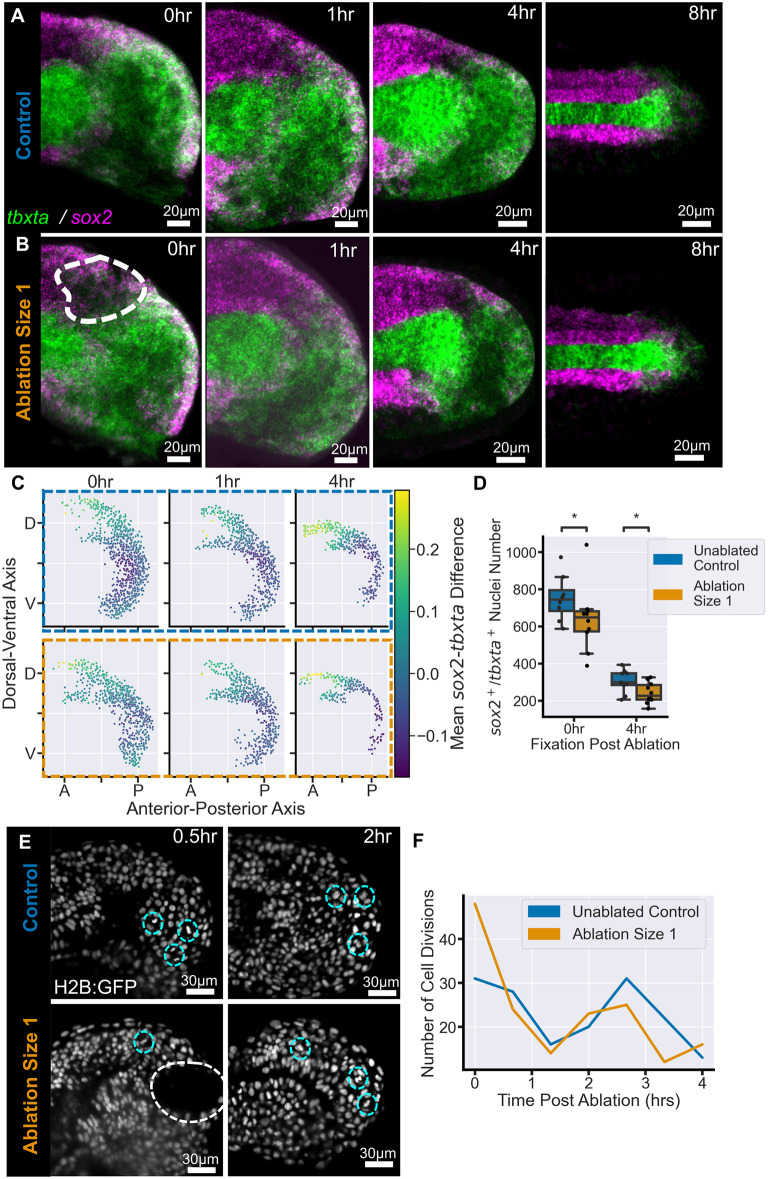
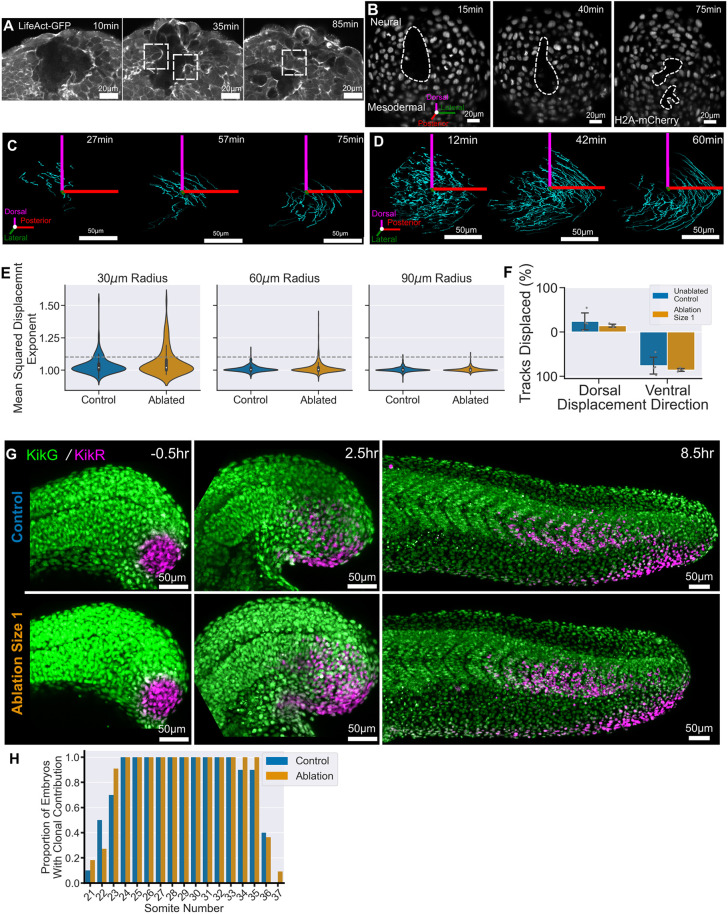
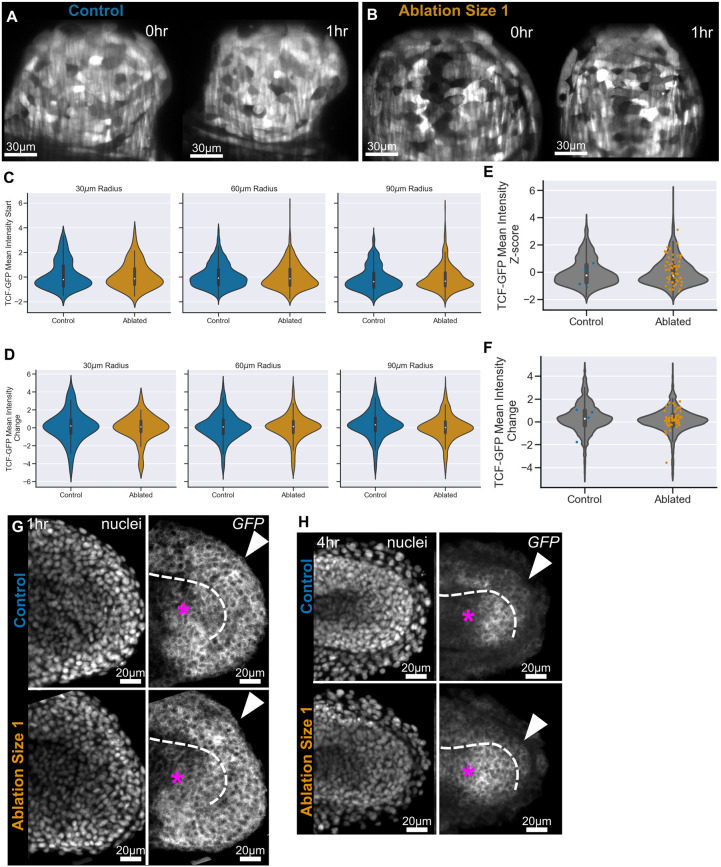
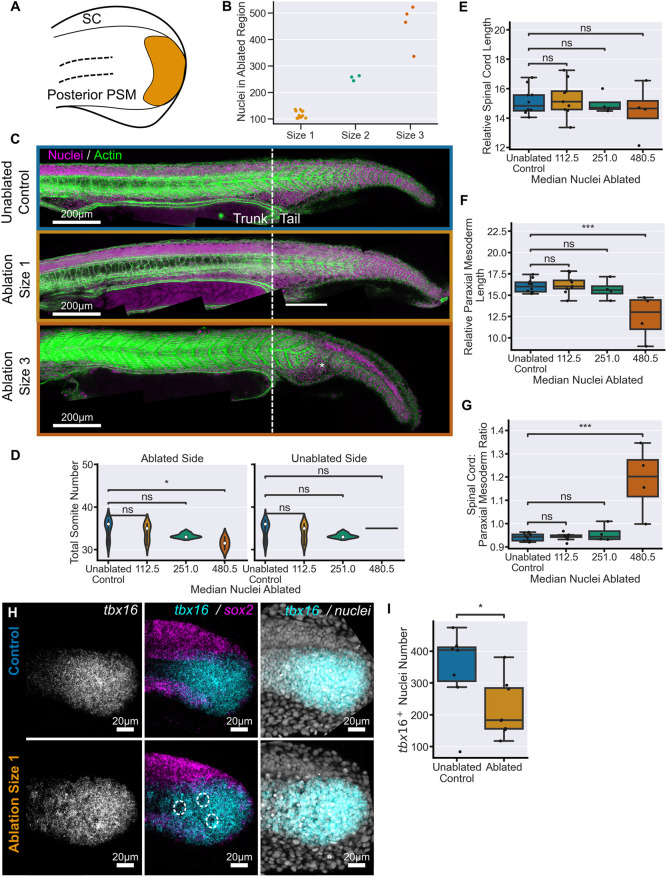
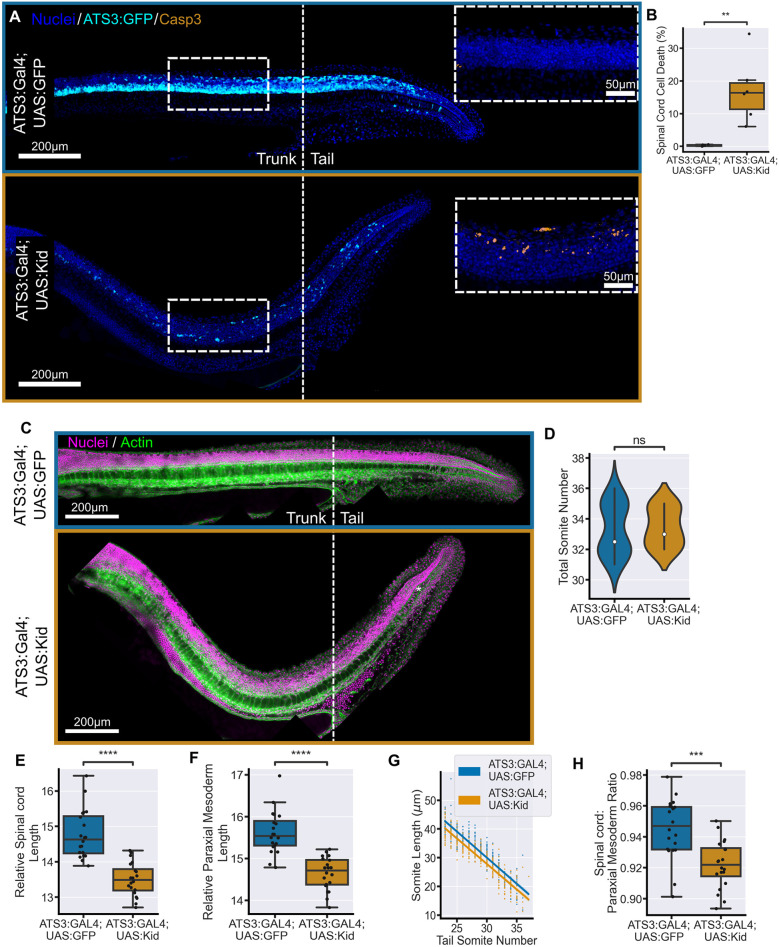
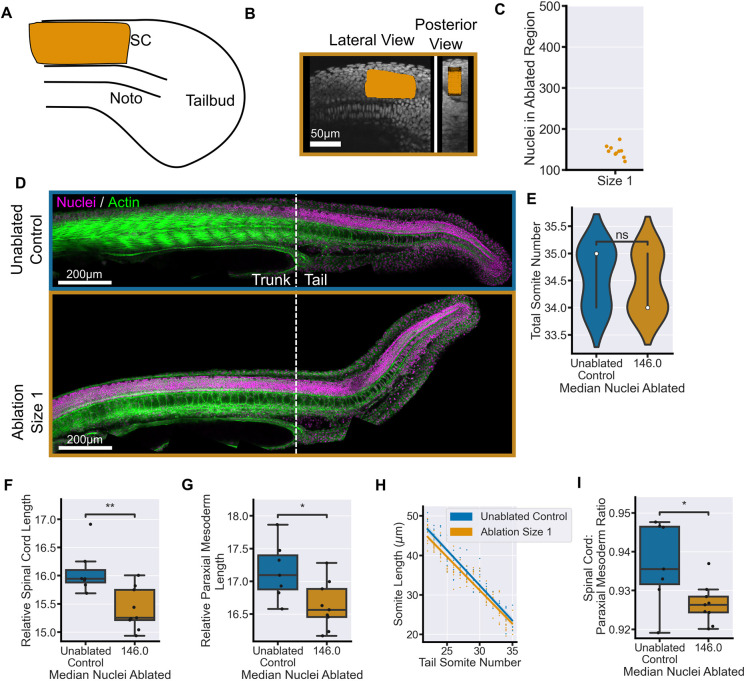
Early embryos display a remarkable ability to regulate tissue patterning in response to changes in tissue size. However, it is not clear whether this ability continues into post-gastrulation stages. Here, we performed targeted removal of dorsal progenitors in the zebrafish tailbud using multiphoton ablation. This led to a proportional reduction in the length of the spinal cord and paraxial mesoderm in the tail, revealing a capacity for the regulation of tissue morphogenesis during tail formation. Following analysis of cell proliferation, gene expression, signalling and cell movements, we found no evidence of cell fate switching from mesoderm to neural fate to compensate for neural progenitor loss. Furthermore, tail paraxial mesoderm length is not reduced upon direct removal of an equivalent number of mesoderm progenitors, ruling out the hypothesis that neuromesodermal competent cells enable proportional regulation. Instead, reduction in cell number across the spinal cord reduces both spinal cord and paraxial mesoderm length. We conclude that spinal cord elongation is a driver of paraxial mesoderm elongation in the zebrafish tail and that this can explain proportional regulation upon neural progenitor reduction.

Keywords: Mechanics; Morphogenesis; Neuromesodermal progenitors; Robustness; Zebrafish.


Conflict of interest statement

Competing interests The authors declare no competing or financial interests.

Figures

Fig. 1.
Fig. 1.
Two-photon ablation causes localised cell death in the dorsal progenitor region. (A) Diagram showing the zebrafish embryo at the 14-somite stage with an inset panel showing the general fate map, heterogeneous gene expression states, and predominant movement of progenitors in the dorsal and ventral regions of the tailbud. (B) Lateral and oblique views of a typical 3D ablation region of interest located in the dorsal progenitor region as indicated by Sox2:GFP expression. (C) Result of segmentation and registration of tailbud nuclei, with ablated region in orange. The precision of the ablation location between embryos is displayed in the heatmap (n=6) and shows a high level of precision for user-selected ROIs. (D) Representative images of DAPI-stained nuclei fixed at successive time points post-ablation. Nuclei in the ablated region (dashed line), become progressively more irregular and then condense as they undergo pyknosis (arrowheads). (E) Representative images of embryos fixed at successive time points post-ablation with cell membranes marked by β-catenin. Cell membrane integrity is initially disrupted in the ablated region and gradually heals over time. 0 h: ablated, n=3; control, n=4. 1 h: ablated, n=5; control, n=5. 2 h: ablated, n=7; control, n=6. (F) Apoptotic cells marked by activated Caspase 3 are seen after 1 h in the region of ablation. By 2 h post-ablation, remaining apoptotic cells and debris are localised laterally as the apoptotic debris flows out of the tailbud. 1 h: ablated, n=4; control, n=4. 2 h: ablated, n=6; control, n=6.
Fig. 2.
Fig. 2.
Dorsal progenitor ablation results in a proportional reduction of tail tissue elongation. (A) Schematic showing an example of dorsal progenitor ablation (orange area) in the 14-somite stage tailbud. (B) Number of nuclei in the ablation ROI prior to ablation at different ROI sizes. (C) Representative examples of embryos at 30 hpf stained for nuclei and actin. The morphology of the tail is comparable between size 1 ablations and unablated controls, whereas size 4 ablations cause a clear defect in tail formation. Solid lines indicate the regions measured in G and K. (D-F) Total somite counts (D), as well as trunk (E), tail somite number (F), are comparable between control embryos and all ablation conditions. (G,H) Spinal cord length (G) and paraxial mesoderm length (H), measured from the 22nd somite, relative to total somite number, both show a significant decrease in all ablated conditions compared to controls. (I) Pre-somitic mesoderm length shows a significant decrease in all ablated conditions compared to controls. (J) Average somite length is consistently decreased in size 1 ablation compared to controls. In size 4 ablations, there is a more notable decrease in the most posterior somites. (K) Trunk paraxial mesoderm length (2nd to 10th somites), relative to total somite number, shows no significant difference between any ablated condition and controls. (L) Spinal cord length relative to mesoderm length from the 22nd somite shows that ablations of size 1 and 2 maintain a ratio of tail tissues comparable to control embryos while size 3 and size 4 embryos have a significantly lower ratio. Unablated control, n=13; size 1, n=10; size 2, n=4; size 3, n=4; size 4, n=9. Conditions were compared using Mann–Whitney-Wilcoxon test. *P≤0.05; **P≤0.01; ***P≤0.001; ****P≤0.0001. Noto, notochord; ns, not significant; PM, paraxial mesoderm; SC, spinal cord. Relative length has units of µm/somite.
Fig. 3.
Fig. 3.
Dorsal progenitor ablation does not affect the gene expression pattern or cell division levels in the tailbud. (A,B) Mean (average) projection through the midline of representative images of the sox2/tbxta expression pattern in control (A) and ablated (B), embryos over time. (B) Initial disruption of the pattern can be seen in ablated embryos at 0 h post-ablation (white dashed outline). By 4 h, and up to 8 h, post-ablation the gene expression pattern is comparable to control embryos. (C) Average map of the sox2+/tbxta+ cells from tailbuds at each time point in control and ablated embryos. The axes show the distribution of these cells in the dorsal-ventral and anterior-posterior axes and the average level of sox2 versus tbxta expression within 11 µm of each point. There is no significant change in the average maps between control and ablated embryos. (D) Number of sox2/tbxta double-positive nuclei in each tailbud. Ablation causes a significant drop in the number of nuclei at 0 h post-ablation compared to controls. A significant reduction remains at 4 h post-ablation compared to controls. 0 h: ablated, n=10; control, n=8. 1 h: ablated, n=11, control, n=9. 4 h: ablated, n=10; control, n=9. 8 h: ablated, n=3; control, n=3. (E) Long-term lightsheet imaging of an ablated embryo (white dashed circle) and a stage-matched control allows manual identification of dividing cells (cyan dashed circles). (F) There is no clear difference between the number of divisions in ablated and control embryos over 4 h. Ablated, n=1; control, n=1. Conditions were compared using Mann–Whitney-Wilcoxon test. *P≤0.05.
Fig. 4.
Fig. 4.
Dorsal progenitor ablation does not perturb global cell movements. (A) Representative images of ablation healing visualised using Lifeact:GFP. Cells increase actin levels at the at the ablation edge and move into the ablated region to re-establish cell contacts (boxes). (B) Representative images of ablation healing using H2A:mCherry to mark nuclei; these nuclei were identified and tracked over 1 h. Ablated, n=4; control, n=4. (C,D) Cell tracks in a single embryo (in this case an ablated embryo) can be split into more consistent (C) and less consistent (D) movement. (E) The exponent of the mean squared displacement for each track across all embryos gives a measure of the consistency of motion. Tracks are grouped according to their starting distance relative to the ablation centre or equivalent control point. There are a greater number of tracks with a more consistent motion in ablated embryos, in particular close to the ablation, compared with control embryos (above the grey dashed line). (F) The displacement of each track in the dorsal-ventral axis relative to its starting position. The vast majority of tracks are displaced in the mesodermal direction in both control and ablated embryos. Ablated, n=4; control, n=4. (G) Representative examples of tracing the fate of a group of ventral and lateral progenitor cells using the photoconvertible Kikume protein in control and ablated embryos. Ventral progenitors were photoconverted and half were subsequently ablated before being grown to the end of somitogenesis. In both control and ablated embryos, there is no movement of the ventral progenitors into the spinal cord. Control: n=10; ablated n=11. (H) The proportion of embryos shown in G with some contribution of labelled cells to each posterior somite was calculated. Both control and ablated embryos show similar ventral progenitor contribution to the posterior somites.
Fig. 5.
Fig. 5.
Global cell flow and Wnt signalling transduction are robust to dorsal progenitor ablation. (A,B) Representative images of TCF-GFP highlighting the level of Wnt signalling transduction in control (A) and ablated (B) embryos. (C) TCF-GFP intensity, z-score normalised for each embryo, at the start of each track for tracks at different distances from the ablation/reference point. Tracks close to the ablation have comparable levels of TCF-GFP to control embryos. (D) Mean TCF-GFP intensity change over the track show both increase and decrease in Wnt transduction with ablated embryos having a similar distribution to control embryos. (E,F) TCF-GFP starting intensity (E) and TCF-GFP mean intensity change (F) for all tracks within 60 µm of the ablation (grey) overlaid with the intensity of the directional tracks (coloured) shows that directional tracks do not have a bias in Wnt transduction. Ablated, n=2; control, n=2. (G,H) Mean (average) projections through the midline of representative images of control and ablated TCF-GFP embryos at 1 h (G) and 4 h (H) post-ablation. Embryos were stained for GFP transcript to pick up any rapid changes to transcription from the TCF-GFP transgene. (G) Transduction of Wnt signalling through the transgene is widespread in the posterior wall (arrowheads) and notochord progenitors (asterisks) in both control and ablated embryos at 1 h post-ablation. (H) Transduction of Wnt signalling through the transgene is comparable between control and ablated embryos in the posterior wall (arrowheads) but appears to be elevated in the notochord progenitors (asterisks).
Fig. 6.
Fig. 6.
Direct removal of mesoderm progenitors does not affect tissue elongation. (A) Schematic showing the location of an example mesodermal-fated lateral progenitor ablation (orange area) in the 14-somite-stage tailbud. (B) Number of nuclei in the ablation ROI prior to ablation at different ROI sizes. (C) Representative examples of embryos at 30 hpf stained for nuclei and actin. The morphology of the tail is comparable between size 1 ablations and unablated controls, whereas size 3 ablations cause a clear defect in somite formation (asterisk). (D) Total somite count for both sides of the bilateral paraxial mesoderm. Size 1 and size 2 ablations have comparable numbers of somites on both sides to control embryos. In size 3 ablations, there is a loss of somites on the ablated side but the contralateral side remains unaffected compared to controls. (E,F) Spinal cord length (E) and paraxial mesoderm length (F), measured from 22nd somite, relative to total somite number, both show no significant decrease in size 1 and 2 ablations compared to controls. Size 3 ablations do have a significant difference in paraxial mesoderm length only. (G) Spinal cord length relative to mesoderm length from the 22nd somite shows that ablations of size 1 and 2 maintain a ratio of tail tissues comparable to control embryos while size 3 embryos have a significantly higher ratio. Control, n=10, size 1, n= 9; size 2, n=4; size 3, n=4. (H) Lateral maximum projections of representative embryos stained for sox2 and tbx16 mRNA from control and mesoderm progenitor ablations at 4 h post-ablation. The tbx16 domain is comparable between control and ablated embryos; however, the cell debris creates noticeable holes in the pattern (dashed circles). (I) Nuclei from the control and ablated tailbuds shown in H were segmented in three dimensions and the number of tbx16+ nuclei were counted. At 4 h post-ablation, there is still a significant decrease in tbx16 nuclear number in ablated embryos compared to controls. Control, n=7; ablated, n=8. Conditions were compared using Mann–Whitney-Wilcoxon test. *P≤0.05; ***P≤0.001. ns, not significant; PSM, pre-somitic mesoderm; SC, spinal cord. Relative length has units of µm/somite.
Fig. 7.
Fig. 7.
Genetic ablation of spinal cord cells along the body axis results in a reduction in tail tissue elongation. (A) Representative images of ATS3:GAL4; UAS:GFP embryos and ATS3:GAL4;UAS:GFP;UAS:Kid embryos. Embryos were immunostained for GFP and activated Caspase 3. There is a clear reduction in GFP signal in embryos that have the UAS:Kid construct compared to those that do not. Insets show a clear increase in activated Caspase 3 in the spinal cord of UAS:Kid embryos. (B) Quantification of the relative number of Caspase 3-positive cells in a given region of the spinal cord in embryos with and without UAS:Kid shows that Kid toxin causes apoptosis in 16% of the spinal cord. (C) Representative examples of embryos at 30 hpf stained for nuclei and actin. ATS3:Kid embryos have a notable dorsal bend in the body axis compared to controls. The notochord is often kinked in the tail (asterisk). (D) Total somite counts shows no significant difference between ATS3:Kid and ATS3:GFP embryos. (E,F) Spinal cord length (E) and paraxial mesoderm length (F), measured from the 22nd somite, relative to total somite number, both show a significant decrease in ATS3:Kid embryos compared to ATS3:GFP controls. (G) The decrease in paraxial mesoderm length is consistent across all the tail somites. (H) Spinal cord length relative to mesoderm length from the 22nd somite shows that spinal cord elongation is more affected than paraxial mesoderm elongation in ATS3:Kid embryos. ATS3:Kid, n=20; ATS3:GFP, n=20. Conditions were compared using Mann–Whitney-Wilcoxon test. **P≤0.01; ***P≤0.001; ****P≤0.0001. ns, not significant. Relative length has units µm/somite.
Fig. 8.
Fig. 8.
Ablation of tail spinal cord cells leads to a reduction in tail tissue elongation. (A,B) Schematic (A) and representative images (B) of the location of the spinal cord ablations (orange area) at the 14-somite stage. The ablations were performed in the spinal cord at the embryonic midline anterior to the notochord progenitors. (C) Number of nuclei in the ablation ROI prior to ablation showing a comparable number of nuclei ablated to other ‘size 1’ ablations. (D) Representative examples of embryos at 30 hpf stained for nuclei and actin. There is dorsal bending of the anterior part of the tail following spinal cord ablation. (E) Total somite counts are comparable between control and ablated embryos. (F,G) Spinal cord length (F) and paraxial mesoderm length (G) measured from the 22nd somite and relative to total somite number, both show a significant decrease in length in ablated embryos compared to controls. (H) Average somite length is prominently decreased in the anterior somites of ablated embryos compared to controls. (I) Spinal cord length relative to mesoderm length from the 22nd somite shows that there is a significantly greater reduction in spinal cord length compared to paraxial mesoderm length. Control, n=9; ablated, n=9. Conditions were compared using Mann–Whitney-Wilcoxon test. *P≤0.05; **P≤0.01; ns, not significant. Noto, notochord; SC, spinal cord. Relative length has units of µm/somite.

Similar articles

References

    1. Almuedo-Castillo, M., Bläßle, A., Mörsdorf, D., Marcon, L., Soh, G. H., Rogers, K. W., Schier, A. F. and Müller, P. (2018). Scale-invariant patterning by size-dependent inhibition of Nodal signalling. Nat. Cell Biol. 20, 1032-1042. 10.1038/s41556-018-0155-7 - DOI - PMC - PubMed
    1. Asakawa, K., Abe, G. and Kawakami, K. (2013). Cellular dissection of the spinal cord motor column by BAC transgenesis and gene trapping in zebrafish. Front. Neural Circuits 7, 100. 10.3389/fncir.2013.00100 - DOI - PMC - PubMed
    1. Attardi, A., Fulton, T., Florescu, M., Shah, G., Muresan, L., Lenz, M. O., Lancaster, C., Huisken, J., Van Oudenaarden, A. and Steventon, B. (2018). Neuromesodermal progenitors are a conserved source of spinal cord with divergent growth dynamics. Development 145, dev166728. 10.1242/dev.166728 - DOI - PMC - PubMed
    1. Behrndt, M., Salbreux, G., Campinho, P., Hauschild, R., Oswald, F., Roensch, J., Grill, S. W. and Heisenberg, C.-P. (2012). Forces driving epithelial spreading in Zebrafish gastrulation. Science 338, 257-260. 10.1126/science.1224143 - DOI - PubMed
    1. Beltman, J. B., Marée, A. F. M. and De Boer, R. J. (2009). Analysing immune cell migration. Nat. Rev. Immunol. 9, 789-798. 10.1038/nri2638 - DOI - PubMed

Substances

Grants and funding

LinkOut - more resources