MICAL2 Promotes Pancreatic Cancer Growth and Metastasis
- PMID: 39745352
- PMCID: PMC11907191
- DOI: 10.1158/0008-5472.CAN-24-0744
MICAL2 Promotes Pancreatic Cancer Growth and Metastasis
Abstract
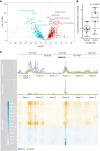
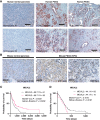
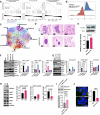
Pancreatic ductal adenocarcinoma (PDAC) remains one of the deadliest solid cancers; thus, identifying more effective therapies is a major unmet need. In this study, we characterized the super-enhancer (SE) landscape of human PDAC to identify drivers of the disease that might be targetable. This analysis revealed MICAL2 as an SE-associated gene in human PDAC, which encodes the flavin monooxygenase enzyme that induces actin depolymerization and indirectly promotes serum response factor transcription by modulating the availability of serum response factor coactivators such as myocardin-related transcription factors (MRTF-A and MRTF-B). MICAL2 was overexpressed in PDAC, and high-MICAL2 expression correlated with poor patient prognosis. Transcriptional analysis revealed that MICAL2 upregulates KRAS and epithelial-mesenchymal transition signaling pathways, contributing to tumor growth and metastasis. In loss- and gain-of-function experiments in human and mouse PDAC cells, MICAL2 promoted both ERK1/2 and AKT activation. Consistent with its role in actin depolymerization and KRAS signaling, loss of MICAL2 also inhibited macropinocytosis. MICAL2, MRTF-A, and MRTF-B influenced PDAC cell proliferation and migration and promoted cell-cycle progression in vitro. Importantly, MICAL2 supported in vivo tumor growth and metastasis. Interestingly, MRTF-B, but not MRTF-A, phenocopied MICAL2-driven phenotypes in vivo. This study highlights the multiple ways in which MICAL2 affects PDAC biology and provides a foundation for future investigations into the potential of targeting MICAL2 for therapeutic intervention. Significance: Characterization of the epigenomic landscape of pancreatic cancer to identify early drivers of tumorigenesis uncovered MICAL2 as a super-enhancer-associated gene critical for tumor progression that represents a potential pharmacologic target.
©2024 The Authors; Published by the American Association for Cancer Research.
Conflict of interest statement
A.S. Courelli reports grants from the NIH during the conduct of the study. A.T. Wenzel reports grants from the NIH during the conduct of the study. D. Jaquish reports grants from the NIH during the conduct of the study. K. Jaque reports grants from the NCI of the NIH during the conduct of the study. A. D’Ippolito reports personal fees from Syros Pharmaceuticals during the conduct of the study and from Syros Pharmaceuticals and Precede Biosciences outside the submitted work, as well as a patent for US-20230210852-A1 issued. D.A. Orlando reports personal fees from Syros Pharmaceutical during the conduct of the study, as well as a patent for US9181580B2 licensed to Syros Pharmaceuticals. C. Commisso reports a patent for US9983194B2 issued. H. Tiriac reports a patent for “Targeting MICAL2” pending. A.M. Lowy reports grants from The Lustgarten Foundation, Stand Up to Cancer, the Pancreatic Cancer Action Network, and the NIH/NCI during the conduct of the study, as well as a patent for “MICAL2 as a target for pancreatic cancer therapy” pending. No disclosures were reported by the other authors.
Figures


References
-
- Siegel RL, Giaquinto AN, Jemal A. Cancer statistics, 2024. CA Cancer J Clin 2024;74:12–49. - PubMed
-
- Hu ZI, O’Reilly EM. Therapeutic developments in pancreatic cancer. Nat Rev Gastroenterol Hepatol 2024;21:7–24. - PubMed
-
- Terman JR, Mao T, Pasterkamp RJ, Yu HH, Kolodkin AL. MICALs, a family of conserved flavoprotein oxidoreductases, function in plexin-mediated axonal repulsion. Cell 2002;109:887–900. - PubMed
MeSH terms
Substances
Grants and funding
- T32 CA121938/CA/NCI NIH HHS/United States
- R21 CA273973/CA/NCI NIH HHS/United States
- Princess Margaret Cancer Foundation (PMCF)
- Syros Pharmaceuticles, Inc. Cambridge MA
- U24 CA220341/CA/NCI NIH HHS/United States
- U54 CA285117/CA/NCI NIH HHS/United States
- T32 CA067754/CA/NCI NIH HHS/United States
- U01 CA274295/CA/NCI NIH HHS/United States
- CA 273973/Foundation for the National Institutes of Health (FNIH)
- R01 CA207189/CA/NCI NIH HHS/United States
- Pancreatic Cancer Action Network (PCAN)
- the Canadian Cancer Society Research Institute
- P30 CA051008/CA/NCI NIH HHS/United States
- the Terry Fox Research Institute
- P30 CA023100/CA/NCI NIH HHS/United States
- U54 CA285115/CA/NCI NIH HHS/United States
- Research for a cure of Pancreactic cancer
- P30CA23100/CCSG
- Lustgarten Foundation (Lustgarten)
- Pancreatic Cancer Canada Foundation (PCCF)
- Stand Up To Cancer (SU2C)
- F31 CA257344/CA/NCI NIH HHS/United States
- P01 CA265762/CA/NCI NIH HHS/United States
- Ontario Institute for Cancer Research (OICR)
LinkOut - more resources
Full Text Sources
Medical
Research Materials
Miscellaneous

