Review
. 2025 Jan 2;12(1):1.
doi: 10.1186/s40658-024-00709-0.

The SwiftScan step-and-shoot continuous mode improves SPECT scanning efficiency: a preliminary phantom and clinical test

Affiliations
Review

The SwiftScan step-and-shoot continuous mode improves SPECT scanning efficiency: a preliminary phantom and clinical test

Jicheng Li et al. EJNMMI Phys. .

Abstract

Purpose: The aim of the study was to investigate the value of SwiftScan Step-and-Shoot Continuous (SSC) scanning mode in enhancing image quality and to explore appropriate scanning parameters for reducing scan time.

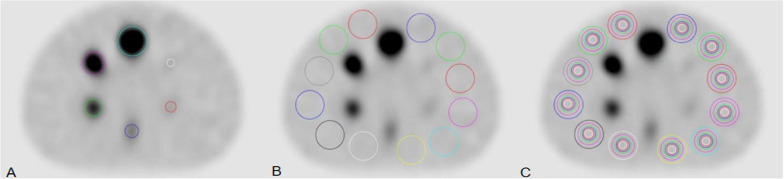
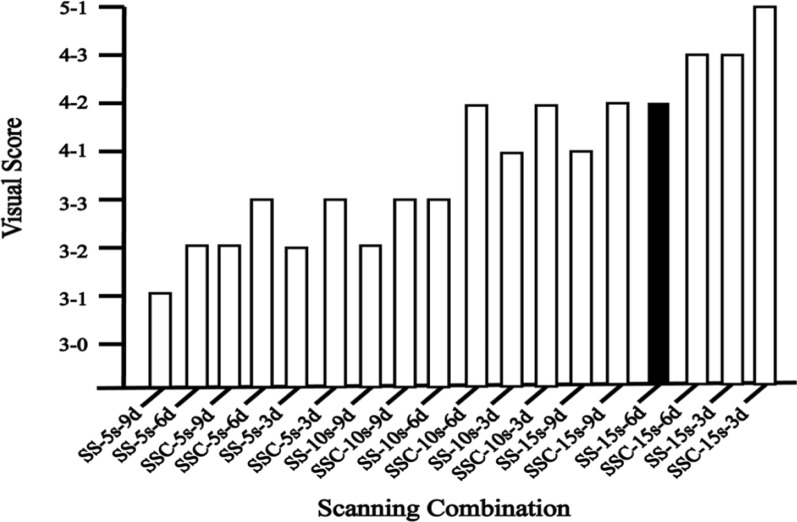
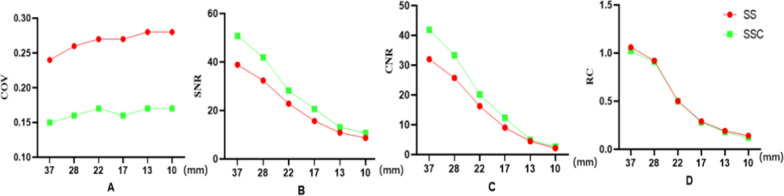
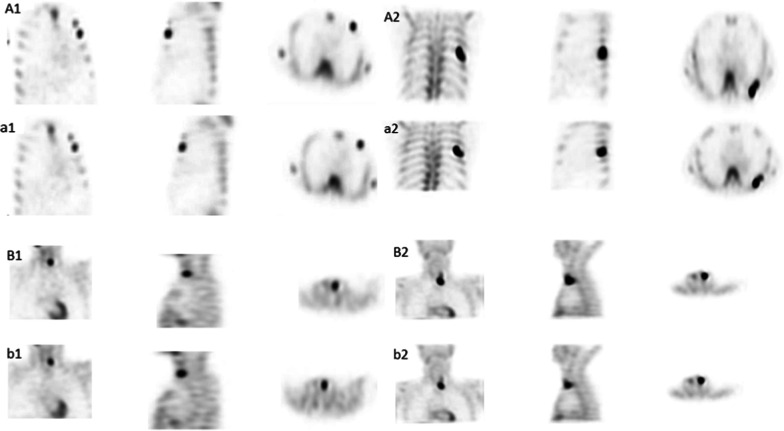
Methods: This study was composed of a phantom study and two clinical tests. The differences in visual image quality scores, coefficient of variance (COV) of the background, image signal-to-noise ratio (SNR), contrast-to-noise ratio (CNR), and recovery coefficient (RC) of the sphere were compared between SSC mode and traditional Step-and-Shoot (SS) mode in the phantom study. Various "shoot" acquisition times (5s, 10s, 15s) and "step" angles (3-degree, 6-degree, 9-degree) were evaluated and verified. In the clinical tests, bone tomography and parathyroid tomography were performed on 30 patients each. Differences in visual image quality scores, background COV, image SNR, CNR, and standardized uptake value (SUV) of lesions were compared between the two modes.

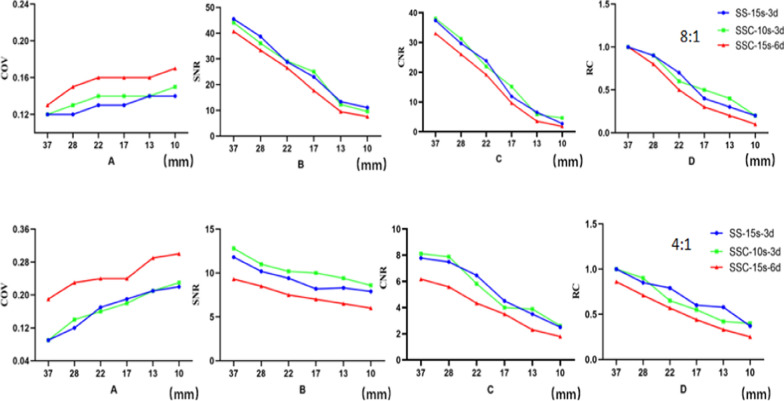
Results: In the phantom study, SSC mode demonstrated higher visual scores and significantly reduced background COV (P < 0.05), and significantly increased SNR and CNR (P < 0.05) compared to SS mode. No significant alteration in RC was observed (P > 0.05). In the clinical tests, no significant differences were found between the optimal SSC scan combination (10s "shoot" and 6-degree "step")/ (10s "shoot" and 3-degree "step") and the traditional SS scan combination (15s "shoot" and 6-degree "step")/ (15s "shoot" and 3-degree "step") in visual image quality scores, background COV, image SNR, CNR, and SUV of bone and parathyroid high uptake lesions (P > 0.05).

Conclusion: The SwiftScan SSC mode can reduce acquisition time by 33% while maintaining similar image quality and quantification accuracy compared to SS mode. An SSC scanning protocol with a 10s "shoot" acquisition and 6-degree "step" or with a 10s "shoot" acquisition and 3-degree "step" over a 360-degree rotation, is recommended for clinical use.

Keywords: Acquisition efficiency; Image quality; SPECT/CT; Step-and-shoot continuous mode; SwiftScan.


Conflict of interest statement

Declarations. Ethics approval and consent to participate: This article does not contain any experiments with animals. All procedures involving human participants were carried out in accordance with the ethical standards of the institutional and/or national research committee. This study was approved by the Ethics Committee of the Second Hospital of Lanzhou University [2024A-799]. Consent for publication: Written informed consent was obtained from all patients in the study. Competing interests: The authors declare no competing interests. Conflict of interest there are no conflicts of interest to declare.

Figures

Fig. 1
Fig. 1
A: Circular regions of interest (ROIs) were delineated on the spheres in the center slice of the CT image along the inner edge of the spheres, which were projected to the SPECT image. B: Each ROI was then copied to 12 ROIs in the background, so that the ROIs were 15 mm away from the phantom edge and no less than 15 mm away from each other in the center slice, and in the + 2 cm slice, + 1 cm slice, − 1 cm slice and − 2 cm slice. Hence, a total of 60 ROIs of each sphere were created in the background. The background ROIs of the 37-mm diameter sphere in the center slice were illustrated. C: The background ROIs of all spheres in the center slice were illustrated
Fig. 2
Fig. 2
Visual score of a physician of different acquisition combinations. Black parameter indicates conventional acquisition parameters
Fig. 3
Fig. 3
Comparisons of quantitative data between the SSC and SS modes in different size spheres in the phantom study. A: The COVs of the background of the SSC combinations were lower than those of the SS combinations. B: The SNRs decreased with the decrease of the sphere diameter. The SNRs of the SSC combinations were higher than those of the SS combinations, but the differences became smaller with the decrease of the sphere diameter. C: The CNRs decreased with the decrease of the sphere diameter. The CNRs of the SSC combinations were higher than those of the SS combinations, but the differences became smaller with the decrease of the sphere diameter. D: The RCs were almost the same in both the SSC combinations and the SS combinations. The RCs in the spheres with the diameter of 37 mm and 28 mm spheres were basically consistent with the actual concentrations. The RCs decreased with the decrease of the sphere diameter
Fig. 4
Fig. 4
The distributions of the quantitative data with different size spheres of SS-15S-6d, SSC-10s-6d and SSC-15s-9d combinations in the phantom study. Column A shows the distribution of the COV in the background; column B shows the SNR distribution; column C shows the CNR distribution, and column D shows the RC distribution. The first row shows the data with 8:1 (sphere-to-background concentration ratio) contrast; the second row shows the data with 4:1 contrast
Fig. 5
Fig. 5
The distributions of the quantitative data with different size spheres of SS-15S-3d, SSC-10s-3d and SSC-15s-6d combinations in the phantom study. Column A shows the distribution of the COV in the background; column B shows the SNR distribution; column C shows the CNR distribution, and column D shows the RC distribution. The first row shows the data with 8:1 (sphere-to-background concentration ratio) contrast; the second row shows the data with 4:1 contrast
Fig. 6
Fig. 6
Comparison of patient images between conventional acquisition mode SS-15s-6d/SS-15s-3d and SSC-10s-6d/SSC-10s-3d. Where A1/A2 and a1/a2 are SS-15s-6d/SS-15s-3d and SSC-10s-6d/SSC-10s-3d modes for local bone tomography, and B1/B2 and b1/b2 are SS-15s-6d/SS-15s-3d and SSC-10s-6d/SSC-10s-3d modes for parathyroid tomography

Similar articles

References

    1. Zhang Y, Hu P, He Y, et al. Ultrafast 30-s total-body PET/CT scan: a preliminary study. Eur J Nucl Med Mol Imaging. 2022;49(8):2504–13. 10.1007/s00259-022-05838-1. - PubMed
    1. Hu Y, Liu G, Yu H, et al. Feasibility of acquisitions using total-body PET/CT with an ultra-low 18F-FDG activity. J Nucl Med. 2022;63(6):959–65. 10.2967/jnumed.121.262038. - PMC - PubMed
    1. Arvola S, Seppänen M, Timonen KL, et al. Detection of prostate cancer bone metastases with fast whole-body 99mTc-HMDP SPECT/CT using a general-purpose CZT system. EJNMMI Phys. 2022;9(1):85. 10.1186/s40658-022-00517-4. - PMC - PubMed
    1. Agency IAE. Clinical Applications of SPECT: New Hybrid Nuclear Medicine Imaging System. International Atomic Energy Agency (IAEA); 2008.
    1. Cao Z, Maunoury C, Chen CC, Holder LE. Comparison of continuous step-and-shoot versus step-and-shoot acquisition SPECT. J Nucl Med Off Publ Soc Nucl Med. 1996;37:2037–40. - PubMed

LinkOut - more resources