. 2025 Jan 2;66(1):3.
doi: 10.1167/iovs.66.1.3.

Blue Light Damages Retinal Ganglion Cells Via Endoplasmic Reticulum Stress and Autophagy in Chickens

Affiliations

Blue Light Damages Retinal Ganglion Cells Via Endoplasmic Reticulum Stress and Autophagy in Chickens

Deng Pan et al. Invest Ophthalmol Vis Sci. .

Abstract

Purpose: Because chickens have excellent light perception properties, this study focused on investigating whether monochromatic light can cause photodamage in chicken retinal ganglion cells (RGCs).

Methods: Post-hatching day chickens were exposed to four different light-emitting diode light environments for five weeks, respectively, monochromatic blue light (480 nm), green light (560 nm), red light (660 nm), or white light (6000 K). The mechanisms through which monochromatic light influences the structure of the chicken retina were analyzed by detecting the morphological structure of the retina, gene and protein expression levels, and the ultrastructure of the optic nerve.

Results: Blue light exposure for five weeks significantly impacted the thickness of the inner reticular layer, retinal synaptic function, and the number of RGCs in the chicken retina. Moreover, neurodegenerative disease characteristics, such as a reduction in the number of dendritic branches and the presence of myelin lesions, have also been observed in RGCs. The activation of the protein kinase RNA-like ER kinase-mediated unfolded protein response, along with the abnormal degradation of the autophagy substrate P62, accompanies these retinal pathological processes. Additionally, our findings indicate that the photosensitivity of OPN4 is linked to endoplasmic reticulum stress in RGCs, which may elucidate why chicken RGCs experience damage exclusively under blue light exposure.

Conclusions: Blue light can damage the chicken retina through endoplasmic reticulum stress and autophagy, especially in RGCs. Our study enhances the understanding of the mechanisms underlying retinal photodamage and emphasizes the risk of retinal damage in low-illuminance blue light environments.


Conflict of interest statement

Disclosure: D. Pan, None; G. Hu, None; J.L, None; Z.W, None; Y.C, None; J.C, None

Figures

Figure 1.
Figure 1.
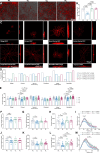
BL exposure destroyed the retinal structure and impaired retinal synaptic function in chickens. (A) Nissl staining and retinal thickness statistics (n = 5). (B) Localization of SNAP25 and PSD95 in the chicken retina. (C, D) Distribution of SNAP25 and PSD95 in retinas subjected to monochromatic light treatment. (E) SNAP25 protein fluorescence density statistics after five weeks of monochromatic light exposure (n = 5). (F) PSD95 protein fluorescence density statistics after five weeks of monochromatic light exposure (n = 5). Data were presented as means ± SEM. The results were analyzed using one-way ANOVA with Sidak's multiple comparisons test (A, E, and F); *P < 0.05, **P < 0.01, ***P < 0.001, and ****P < 0.0001. RPE, retinal pigment epithelium.
Figure 2.
Figure 2.
BL exposure altered the dendritic morphology of RGCs in chickens. (A) Three-dimensional modeling of RGC dendrites in the monochromatic light treatment groups. (B) Dendritic coverage area of RGCs in the IPL (n = 5-8 areas from three animals in each group). (C) DiI-labeled cell types of RGCs. (D) Proportion of DiI-labeled RGC subtypes in the monochromatic light treatment groups. (E) The effect of monochromatic light on the dendritic depth of RGCs in the IPL (n = 6–35 RGCs, from five to seven animals in each group). (FI) Effects of BL on the number of primary dendrites (F), dendritic field diameter (G), total dendritic length (H), and dendritic branch morphology (I) of parasol RGCs (n = 11–21 RGCs, from four to five animals in each group). (J–M) Effects of BL on the number of primary dendrites (J), dendritic field diameter (K), total dendritic length (L), and dendritic branch morphology (M) of bistratified RGCs (n = 18–25 RGCs; four to six animals in each group). Data were presented as means ± SEM. The results were analyzed using one-way ANOVA with Sidak's multiple comparisons test (B, E, G, H, and K) or Kruskal-Wallis with Dunn's multiple comparisons test (F, J, and L); *P < 0.05, **P < 0.01, ***P < 0.001, and ****P < 0.0001. For the Sholl analysis, one-way ANOVA or Kruskal-Wallis was selected based on a normality test among different light color groups at the same distance (I and M).
Figure 3.
Figure 3.
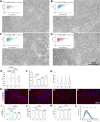
BL affected the density of RGCs in chickens after five weeks. (A) Isodensity maps illustrating the distribution density of RGCs in chickens. (B) Verification of the distribution density of RGCs from the dorsal to the ventral retina. The dotted line represents the predicted values generated by the software, while the solid line indicates the actual observed values. (CE) Effects of monochromatic light on the soma size of RGCs. (F, G) Effects of monochromatic light on the density proportion and number of RGCs in various regions of the retina. (H) Brn3a protein expression levels in the retina (n = 5). Data were presented as means ± SEM. The results were analyzed using the Kruskal-Wallis test followed by Dunn's multiple comparisons test; *P < 0.05. CA, central area; D, dorsal; DA, dorsal area; N, nasal; T, temporal; TP, temporal periphery; V, ventral.
Figure 4.
Figure 4.
BL exposure caused damage to the axons of RGCs in chickens. (AD) The g-ratio and representative electron microscopy images of RGC axons in the monochromatic light treatment groups (n = 955–966 axons from five distinct areas in each group). (E) A comparison of the g-ratio among the monochromatic light treatment groups (n = 955–966 axons from five distinct areas in each group). (F) The coronal section area of the optic nerve in the monochromatic light treatment groups (n = 5). (G) A comparison of the diameters of optic nerve cell axons in the monochromatic light treatment groups (n = 955–966 axons from five distinct areas in each group). (H) The chromatin status of LC3B-positive cells in the chicken optic nerve. The dotted line indicates the boundary between LC3B-positive and LC3B-negative cell areas. (I) A comparison of LC3B-positive fluorescence intensity across the entire coronal section area of the optic nerve (n = 5). (J) A comparison of cell density in the coronal section area of the optic nerve (n = 5). (K, L) The distribution frequency of cell nucleus sizes in the coronal section area of the optic nerve (n = 5). Axonal g-ratios were fitted using regression lines. Data were presented as means ± SEM. The results were analyzed using the Kruskal-Wallis test with Dunn's multiple comparisons test (E, F, and G) or one-way ANOVA with Sidak's multiple comparisons tests (I, J, and K); *P < 0.05, **P < 0.01, ***P < 0.001, and ****P < 0.0001.
Figure 5.
Figure 5.
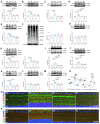
BL exposure induced ER stress and impaired autophagy in the chicken retina. (AE) WB bands and statistical analysis of ER stress-related protein levels in the monochromatic light treatment groups (n = 5). (F) WB bands and statistical analysis of ubiquitinated proteins (n = 5). (GI) WB bands and statistical analysis of autophagy-related proteins (n = 5). (J) A comparison of TRB3 expression levels in each group (n = 5). (KM) WB bands and statistical analysis of NFR2-related antioxidant pathways (n = 5). (N) Schematic diagram illustrating the relationships among the unfolded protein response, autophagy, and oxidative stress. The PERK-ATF4-CHOP pathway regulates Atg5 transcription and influences autophagosome formation during the unfolded protein response. Furthermore, prolonged ER stress also activates Trb3 transcription to inhibit the degradation of P62 in autophagosomes. (O) Colocalization of TUJ-1 (a RGC marker) and p-PERK in the GCL and IPL under monochromatic light treatment. (P) Colocalization of P62 and LC3B in the chicken GCL and IPL under monochromatic light treatment. Data were presented as means ± SEM. The results were analyzed using one-way ANOVA with Sidak's multiple comparisons test; *P < 0.05 and **P < 0.01. eIF2α, eukaryotic initiation factor 2 alpha; Ub, Ubiquitin; P62, also known as SQSTM1 (sequestosome 1); HO-1, heme oxygenase 1.
Figure 6.
Figure 6.
Both OPN4 and melatonin influence ER stress in chicken RGCs under BL in vitro. (A) Expression levels of genes associated with mitochondrial dynamics and damage in the retina following five weeks of monochromatic light treatment (n = 5–9). (B) Fluorescent labeling of DNA fragmentation in chicken retinas. (C) Effects of light wavelength on the transcription levels of Opn4 orthologs in the chicken retina (n = 5). (D) Protein levels of OPN4m in chicken retinas after five weeks of monochromatic light treatment (n = 5). (E) BL exposure resulted in greater muscular pupil constriction in chickens (n = 6). (F, G) BL exposure does not influence the kinetics of pupil contraction in chickens (one-phase association, n = 5). (H) Expression levels of melatonin-related proteins (n = 5). (I) Localization of Mel1a in the chicken retina. (J) Localization of AANAT in the nuclei of RGCs (n = 5). (K) Effects of the OPN4 inhibitor AA92593 on the viability of embryonic chicken retinal cells (n = 4). The black arrows indicate the drug concentrations used in vitro. (L) Effects of melatonin on the viability of embryonic chicken retinal cells (n = 4). The black arrows indicate the drug concentrations used in vitro. (M, N) Effects of the in vitro addition of AA92593 and melatonin on the intensity of p-PERK immune-positive signals in TUJ-1+ embryonic chicken retinal cells under BL (n = 5). Data were presented as means ± SEM. The results were analyzed using the Kruskal-Wallis test with Dunn's multiple comparisons (A) or one-way ANOVA with Sidak's multiple comparisons tests (C, D, E, H, and J). Comparisons between drugs and their solvents were conducted using an unpaired two-tailed Student's t-test or Mann-Whitney U test (K, L, and N); *P < 0.05, **P < 0.01, and ****P < 0.0001. Dnm1, dynamin 1; Opa1, optic atrophy 1; Mfn1, mitofusin-1; Mfn2, mitofusin-2; cgas, cyclic guanosine monophosphate (GMP)-AMP synthase; Sting, stimulator of interferon genes; Mel1b, melatonin receptor 2; NQO2, quinone dehydrogenase 2; Mel, melatonin.

Similar articles

References

    1. Beier C, Bocchero U, Levy L, et al. .. Divergent outer retinal circuits drive image and non-image visual behaviors. Cell Rep . 2022; 39: 111003. - PMC - PubMed
    1. Pan D, Wang Z, Chen Y, Cao J.. Melanopsin-mediated optical entrainment regulates circadian rhythms in vertebrates. Commun Biol. 2023; 6: 1054. - PMC - PubMed
    1. Wang L, Yu X, Zhang D, et al. .. Long-term blue light exposure impairs mitochondrial dynamics in the retina in light-induced retinal degeneration in vivo and in vitro. J Photochem Photobiol B. 2023; 240: 112654. - PubMed
    1. Godley BF, Shamsi FA, Liang FQ, et al. .. Blue light induces mitochondrial DNA damage and free radical production in epithelial cells. J Biol Chem. 2005; 280: 21061–21066. - PubMed
    1. Wenzel A, Grimm C, Samardzija M, Reme CE. Molecular mechanisms of light-induced photoreceptor apoptosis and neuroprotection for retinal degeneration. Prog Retin Eye Res. 2005; 24: 275–306. - PubMed

MeSH terms

LinkOut - more resources