Comment
. 2025 Jan 28;333(4):307-318.
doi: 10.1001/jama.2024.22684.

Transcriptomic Profiles in Nasal Epithelium and Asthma Endotypes in Youth

Affiliations
Comment

Transcriptomic Profiles in Nasal Epithelium and Asthma Endotypes in Youth

Molin Yue et al. JAMA. .

Abstract

Importance: T helper 2 (T2) cells and T helper 17 (T17) cells are CD4+ T cell subtypes involved in asthma. Characterizing asthma endotypes based on these cell types in diverse groups is important for developing effective therapies for youths with asthma.

Objective: To identify asthma endotypes in school-aged youths aged 6 to 20 years by examining the distribution and characteristics of transcriptomic profiles in nasal epithelium.

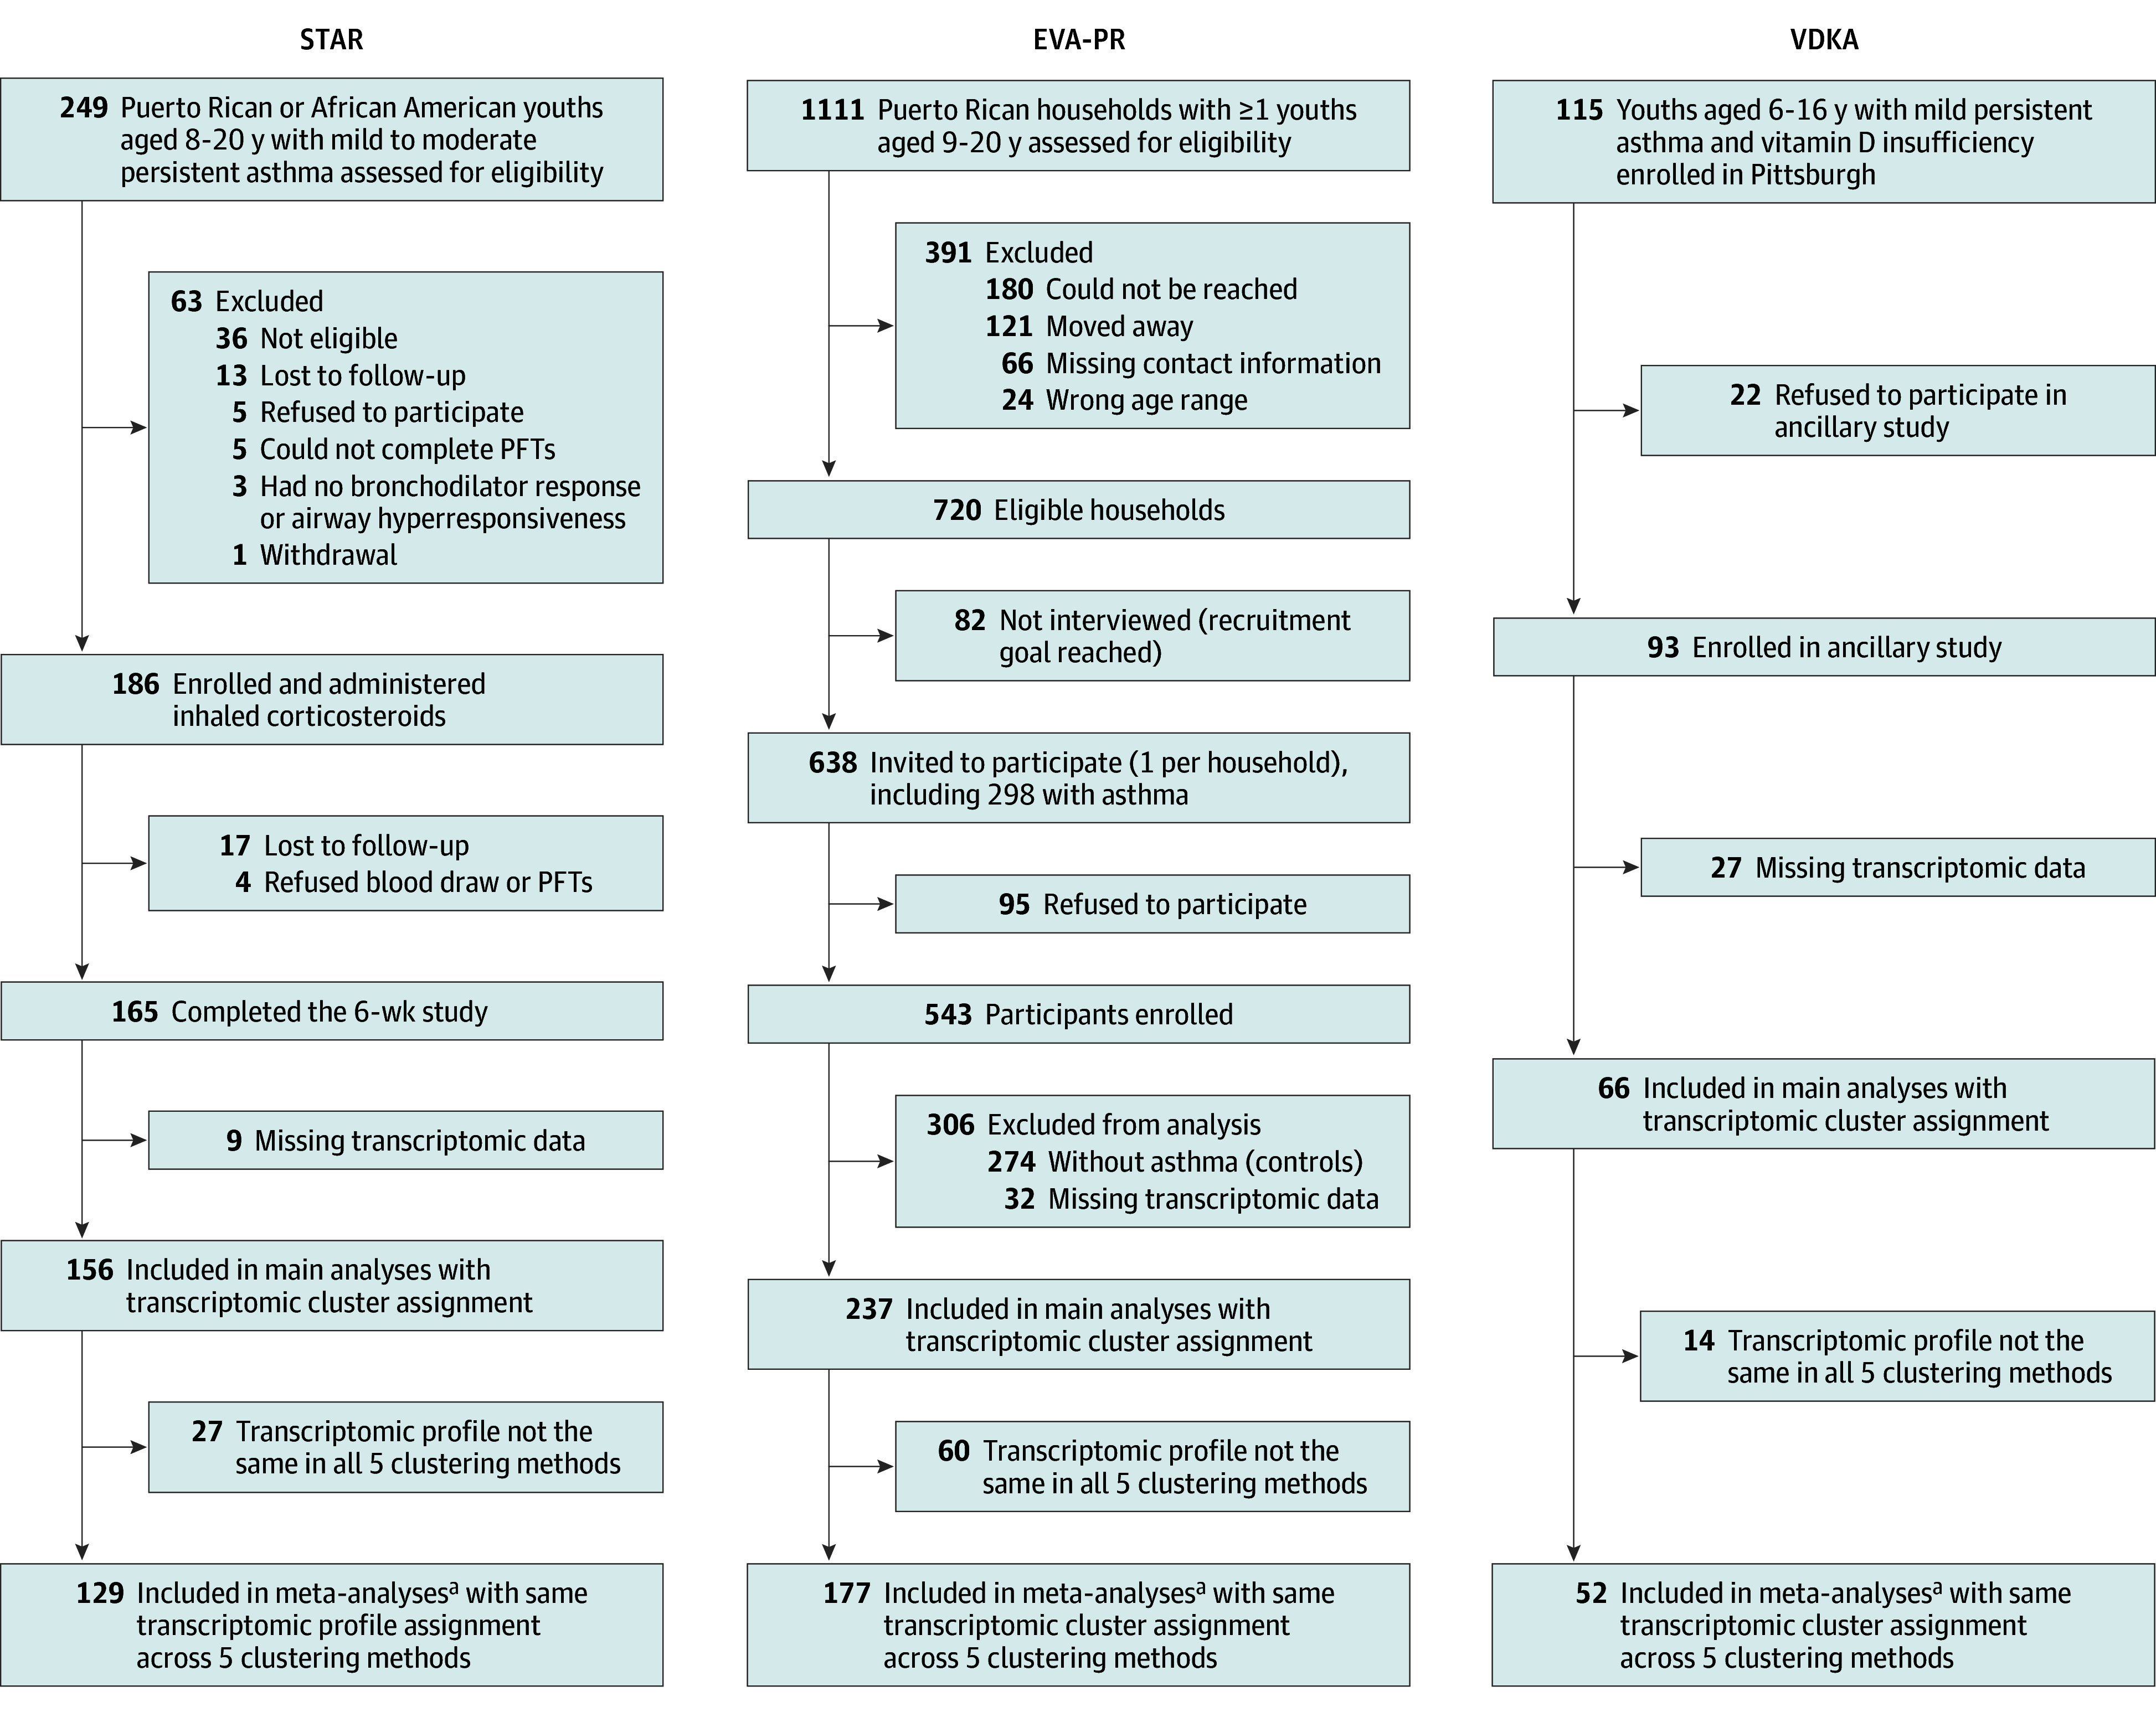
Design, setting, and participants: Cross-sectional analysis of nasal epithelial samples from 3 studies of youths with asthma aged 6 to 20 years: Stress and Treatment Response in Puerto Rican and African American Children with Asthma (STAR; N = 156), Epigenetic Variation and Childhood Asthma in Puerto Ricans (EVA-PR; N = 237), and Vitamin D Kids Asthma (VDKA; N = 66).

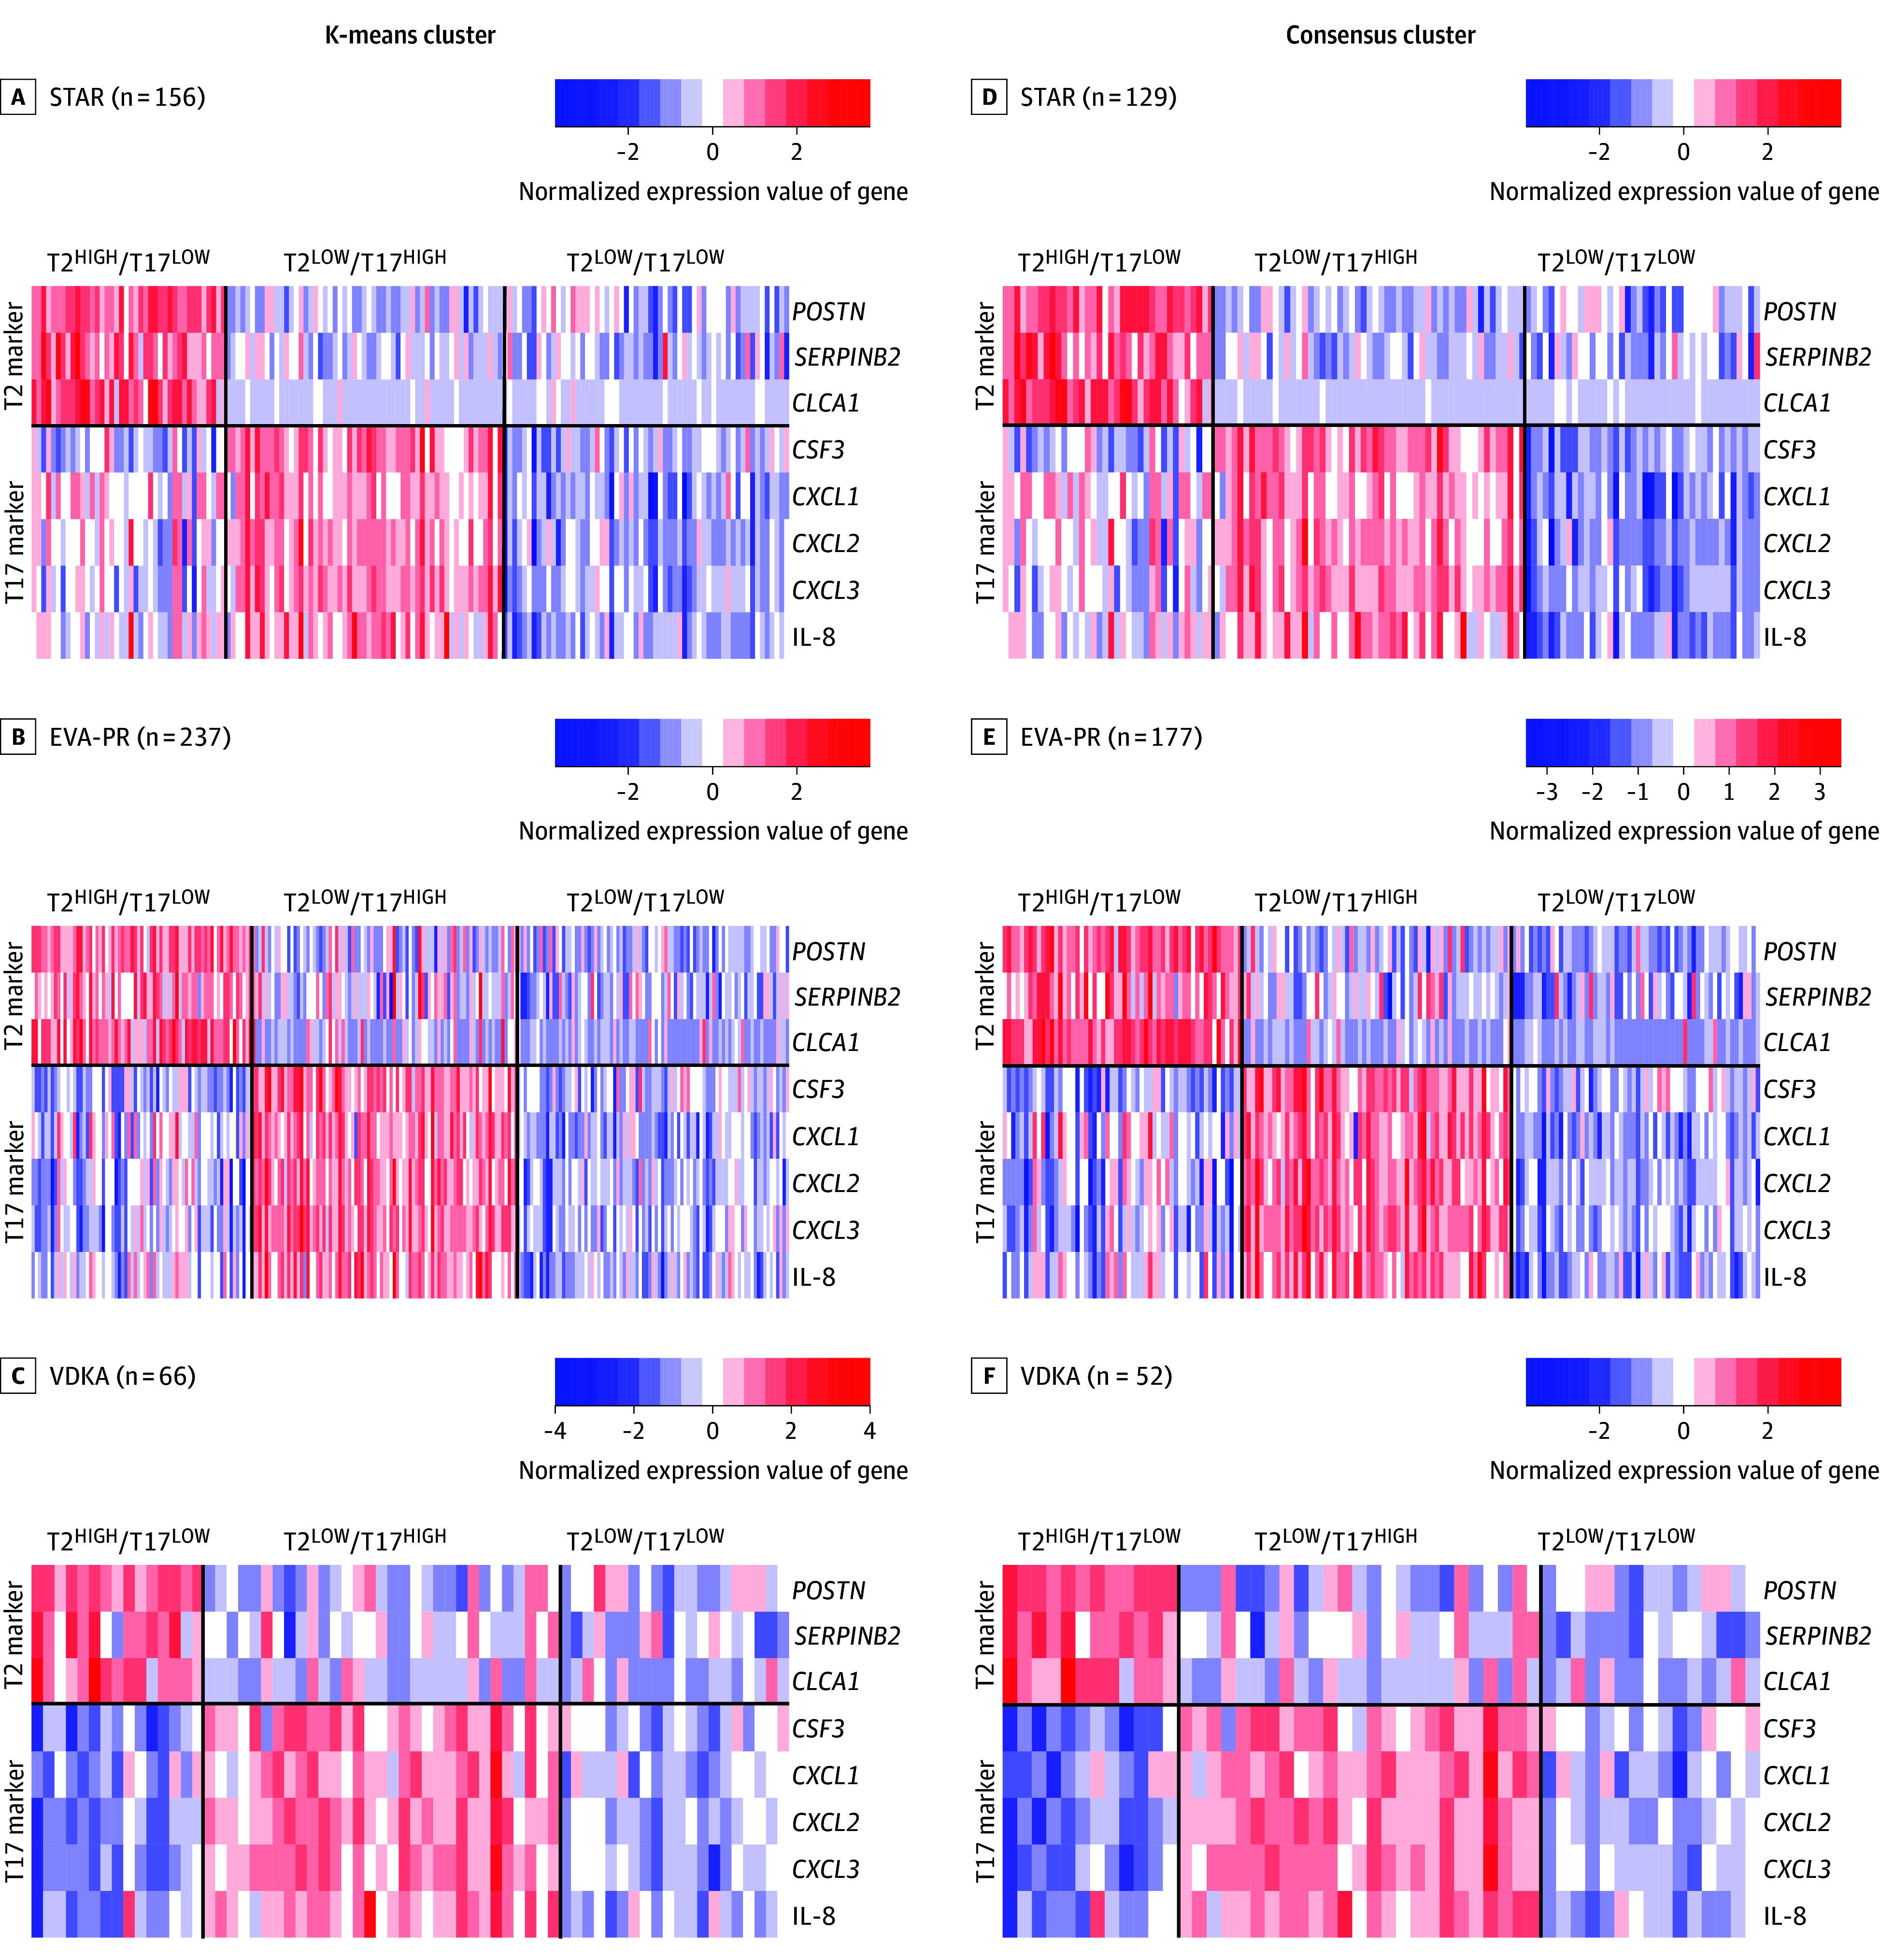
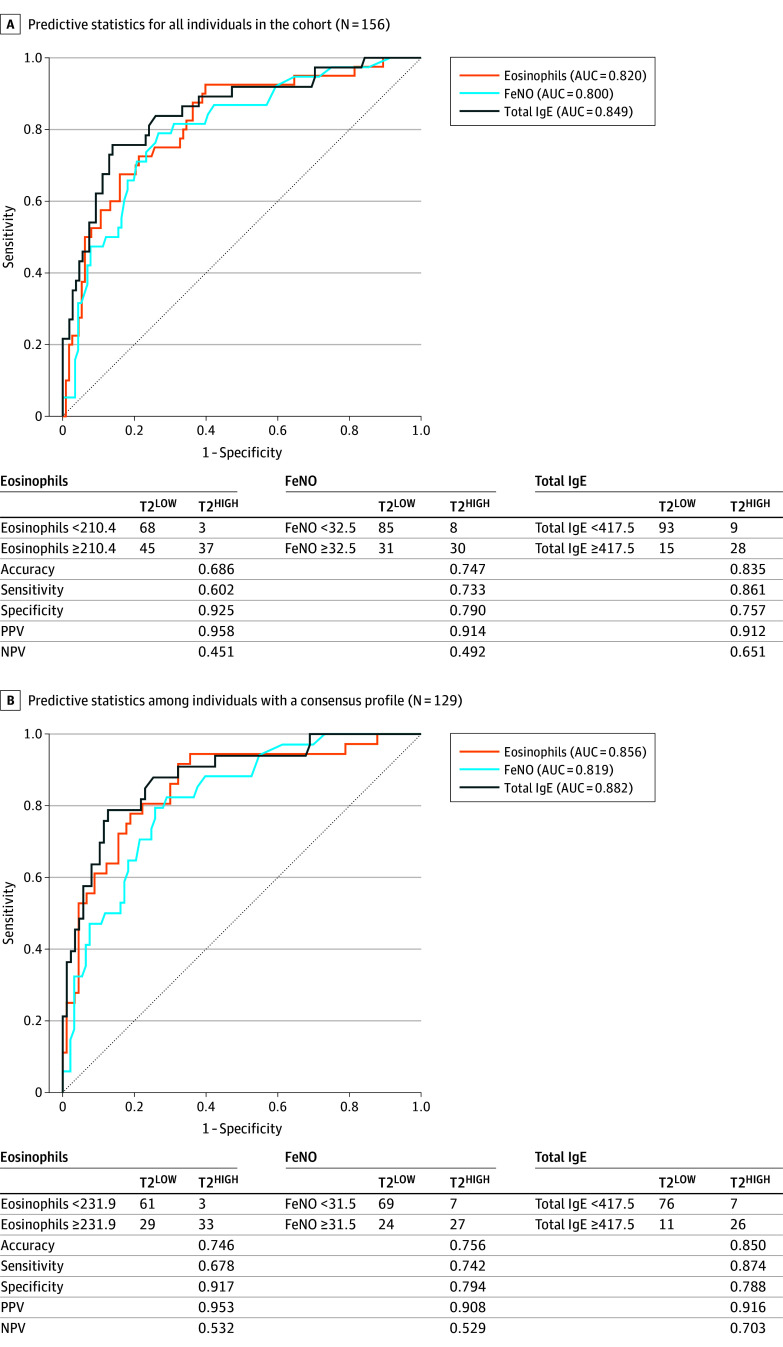
Main outcomes and measures: The primary outcome was nasal epithelial transcription profiles of 3 T2 and 5 T17 pathway genes. Clinical characteristics, total and allergen-specific immunoglobulin E (IgE), blood eosinophils, and lung function were compared across profiles in all studies.

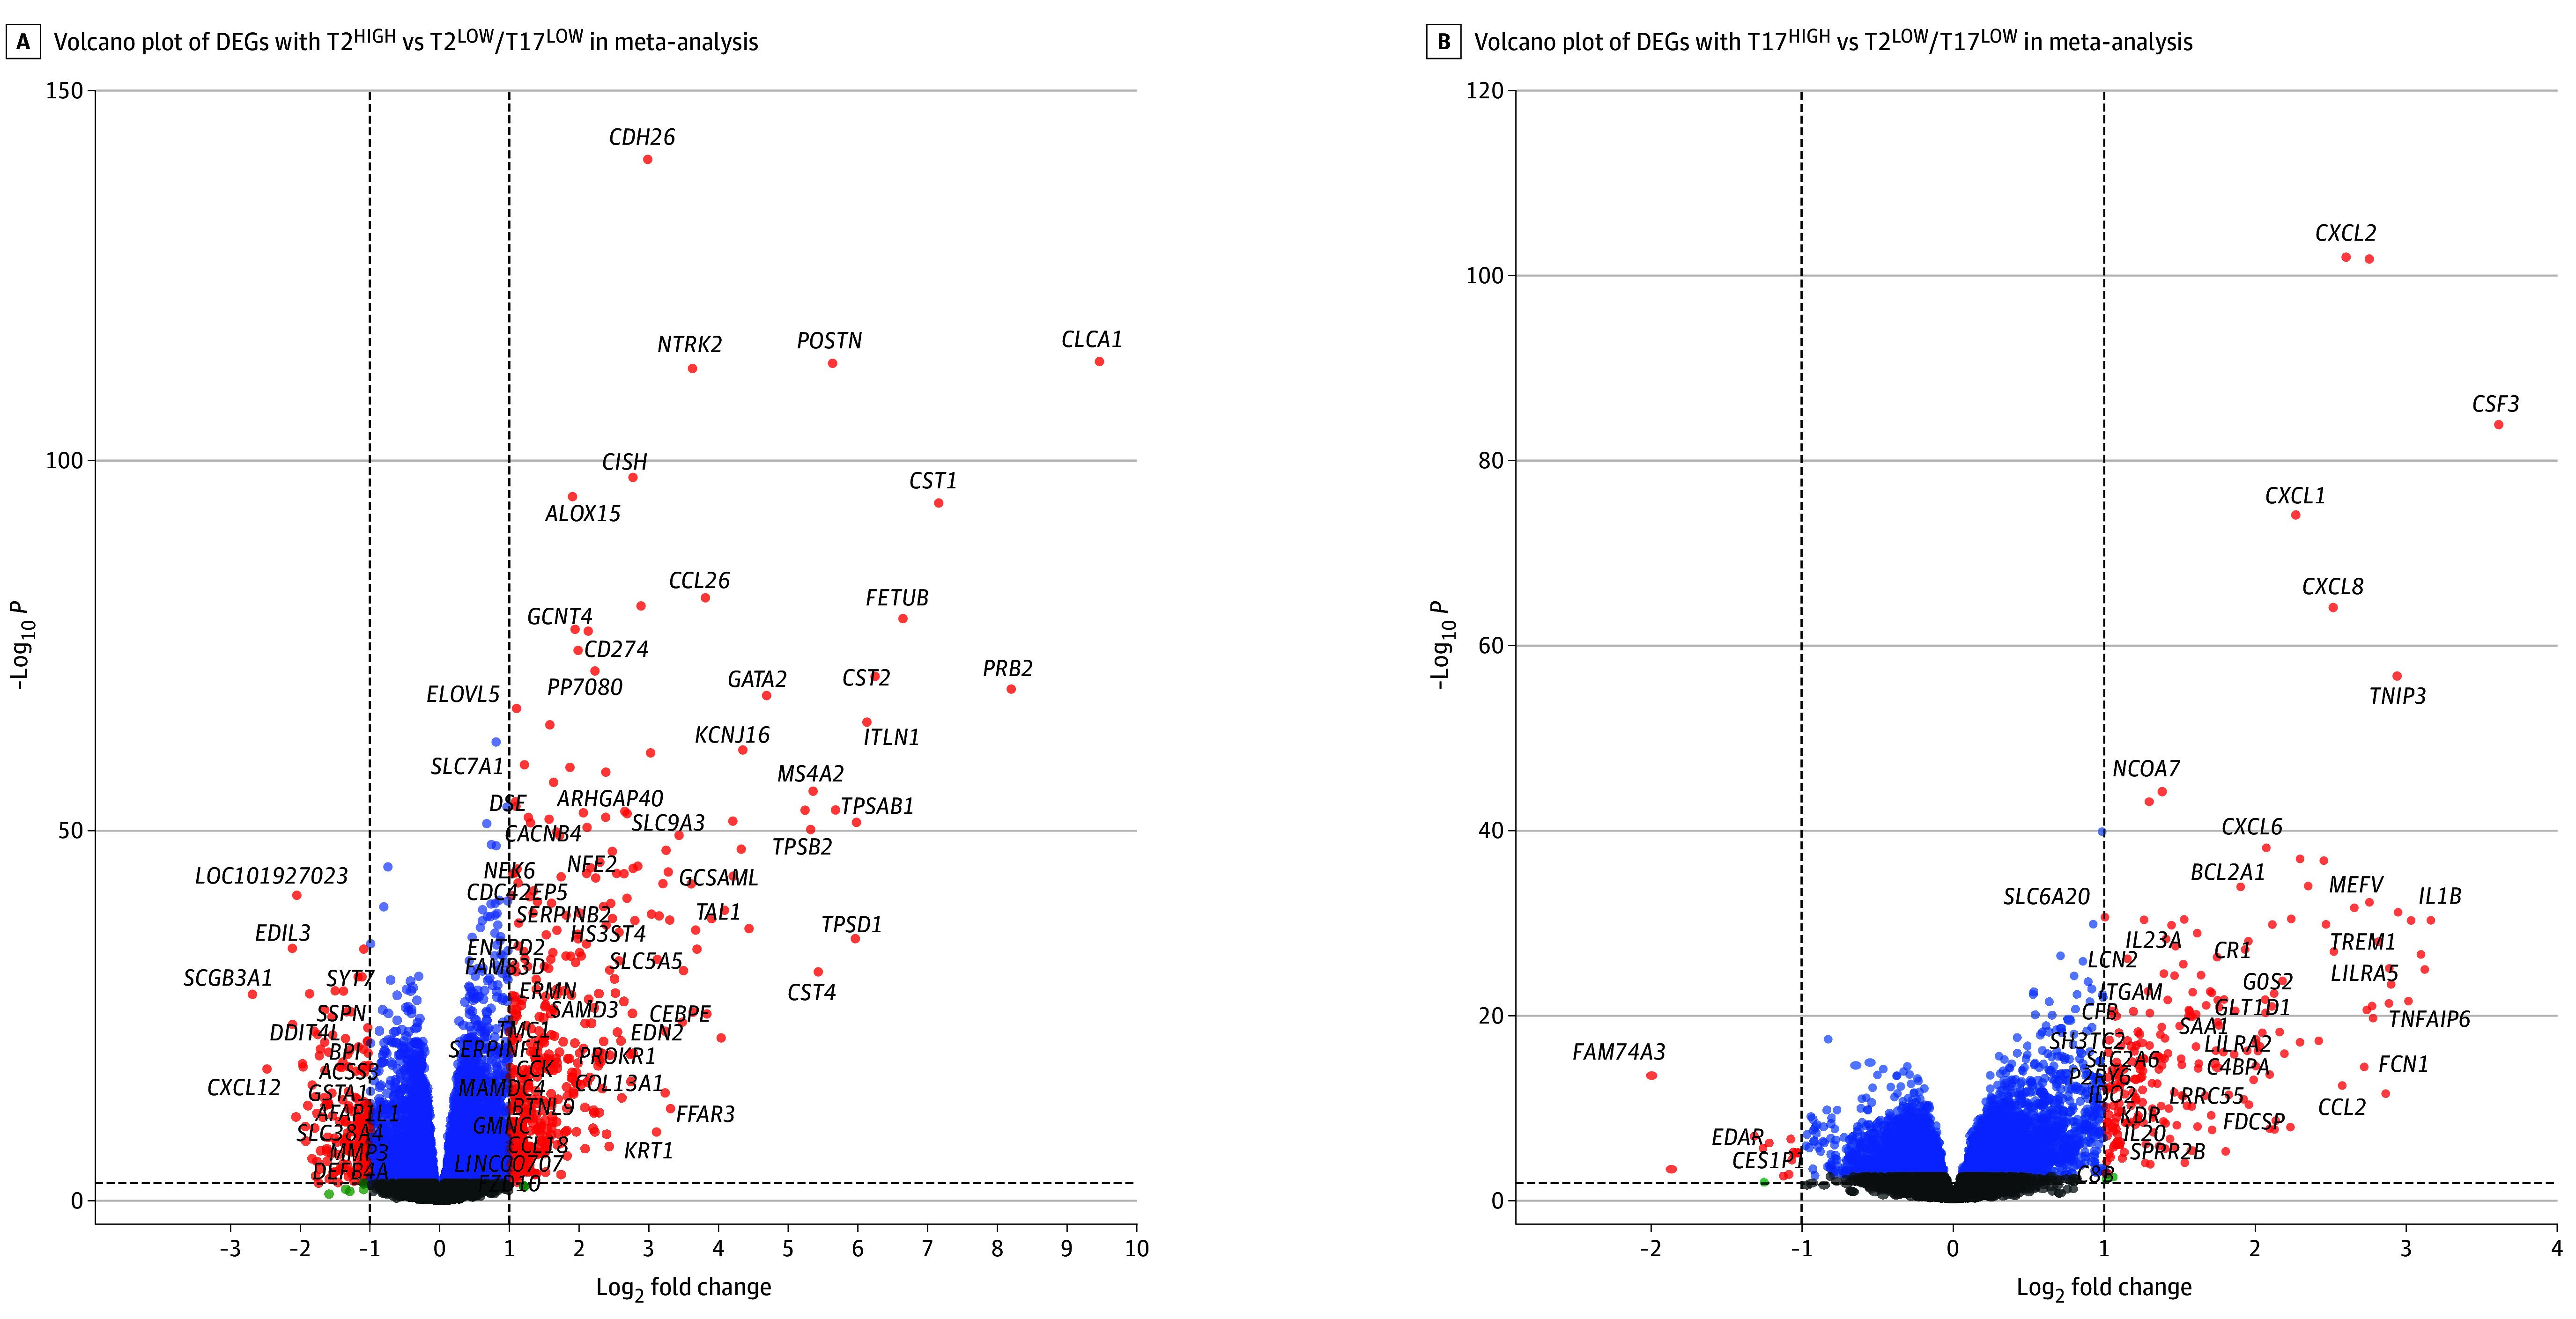
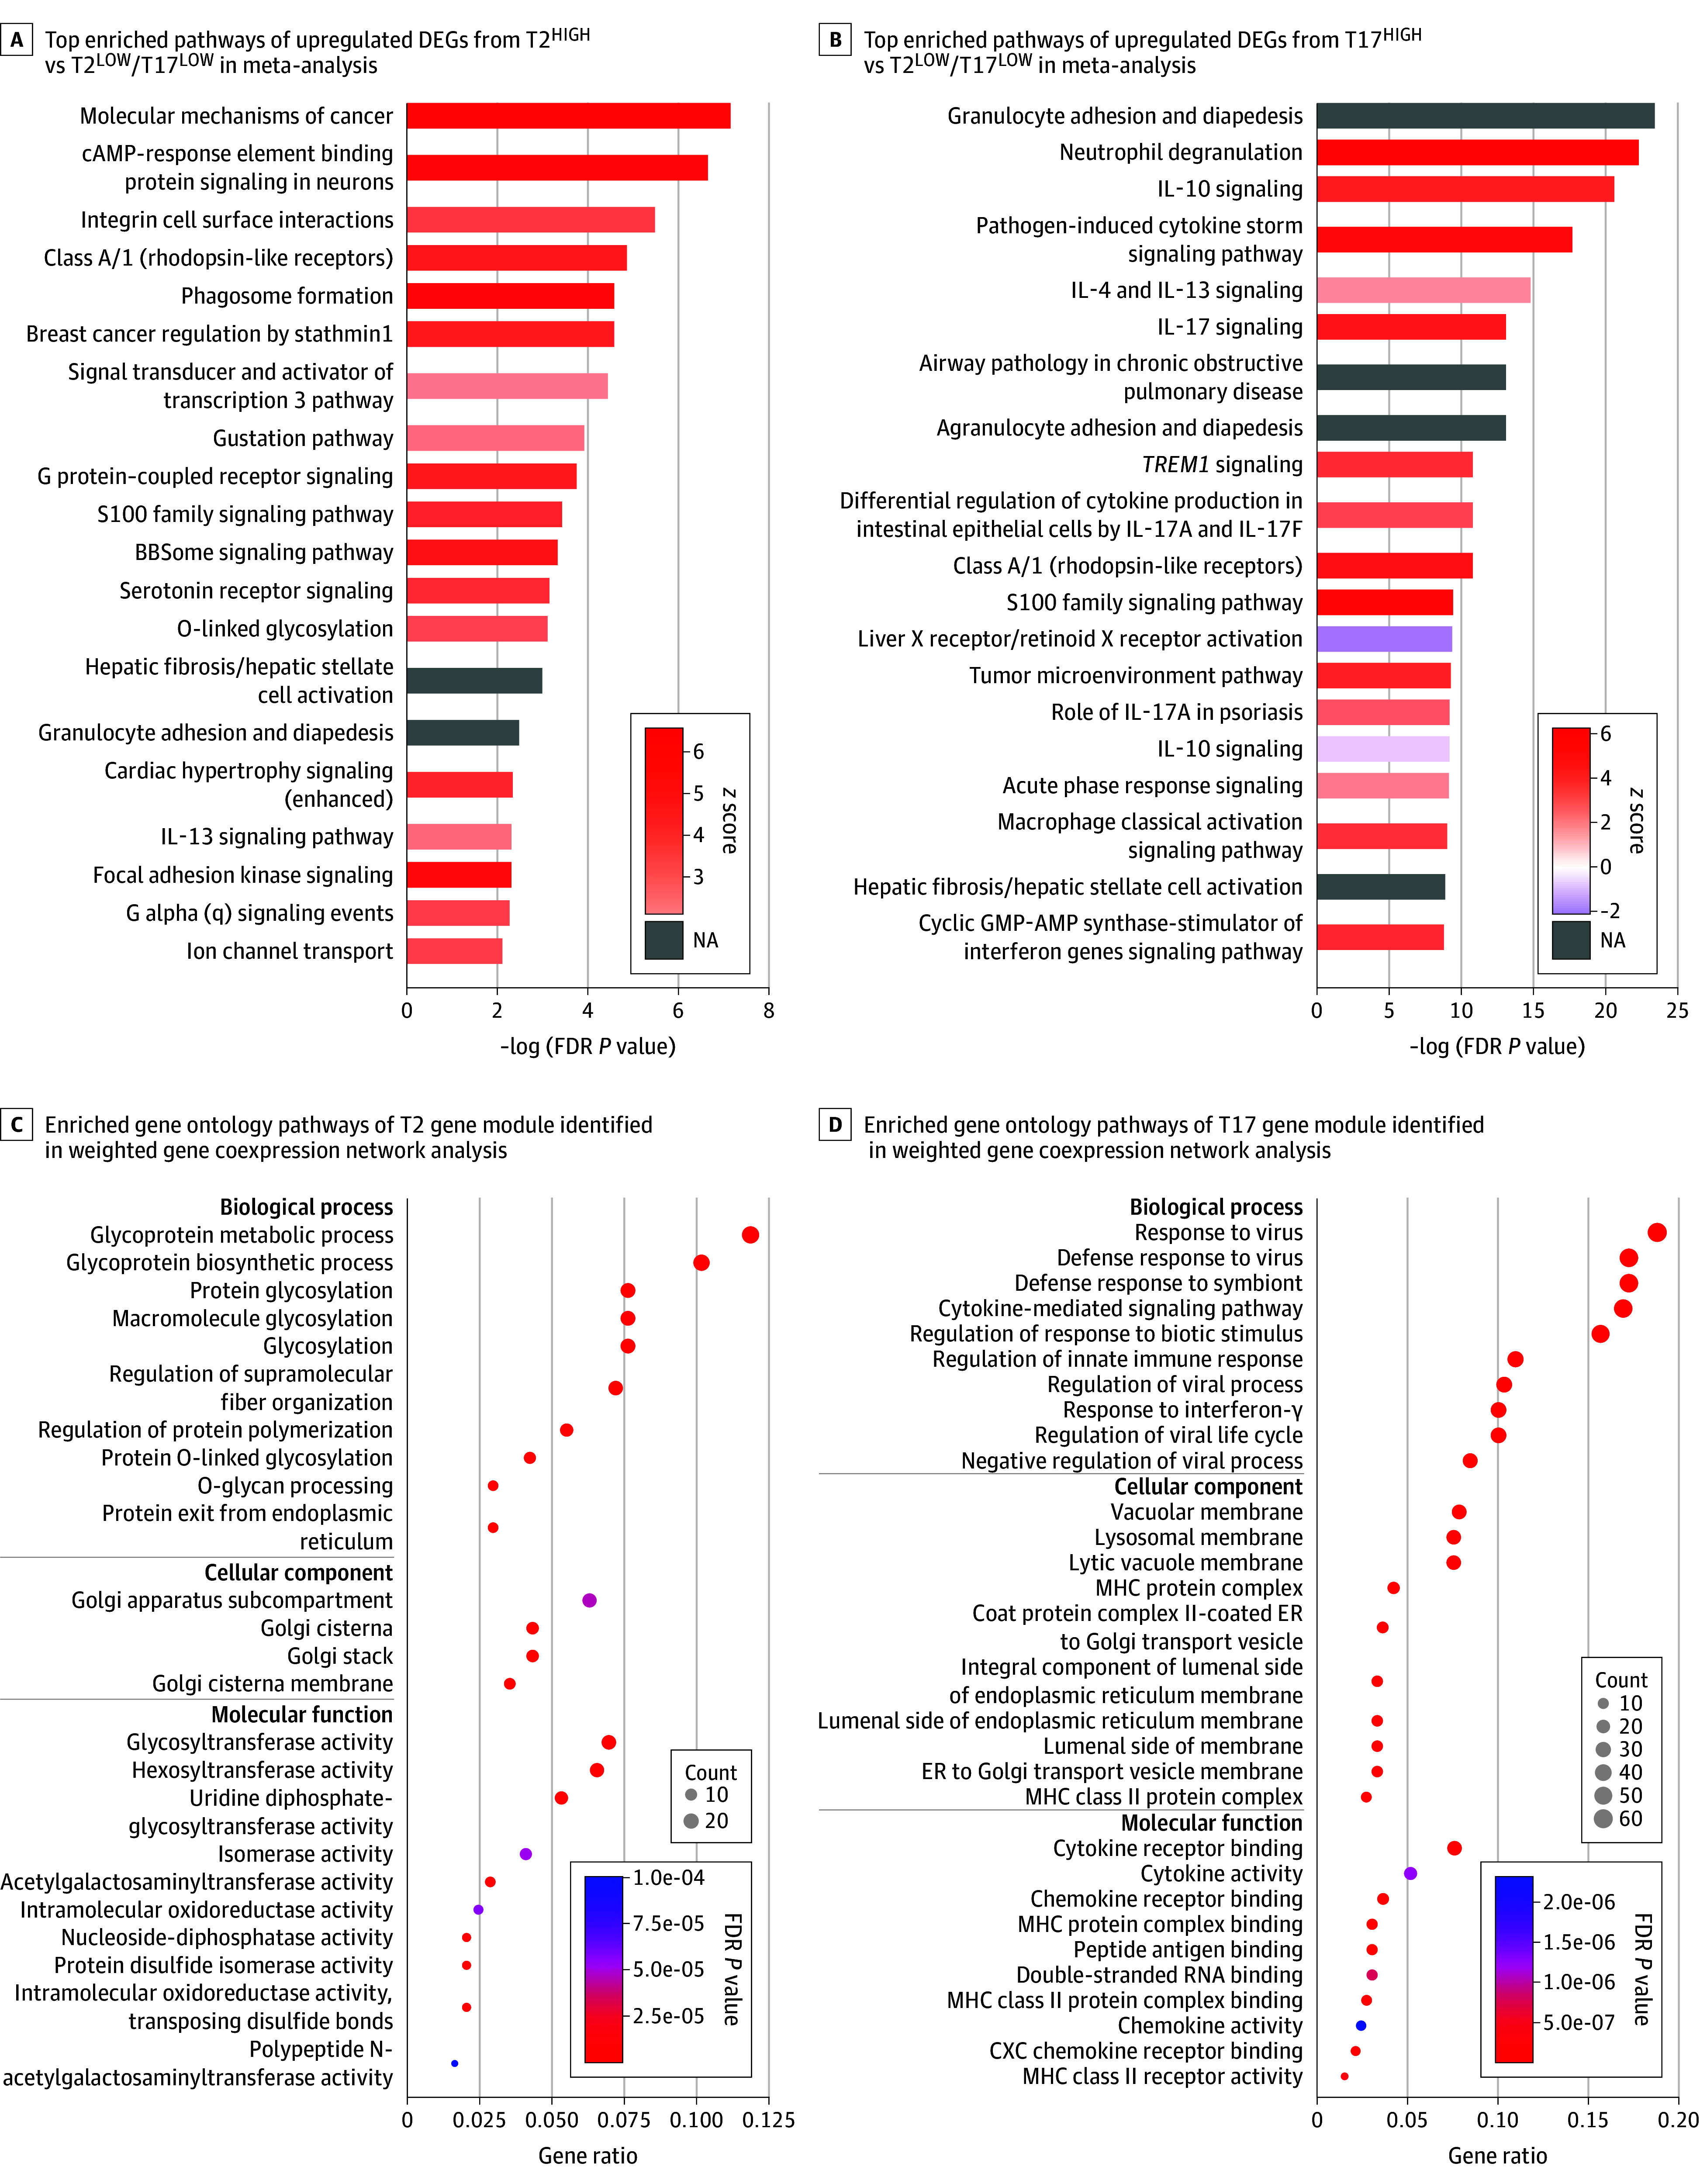
Results: Mean ages for STAR, EVA-PR, and VDKA participants were 14.2, 15.4, and 10.3 years, respectively. The percentage of female participants ranged from 41% to 53.2% across studies. The predominant race or ethnicity was Puerto Rican in EVA-PR (100%) and Black or African American in STAR (71.8%) and VDKA (57.6%). Three transcriptomic profiles were identified: high T2 expression (T2HIGH), high T17 expression (T17HIGH), and low expression of both pathways (T2LOW/T17LOW). Across studies, T2HIGH was present in 23% to 29% of participants, T17HIGH in 35% to 47%, and T2LOW/T17LOW in 30% to 38%. In each study, median total IgE and blood eosinophils for the T2HIGH profile was higher than for the T2LOW profiles (IgE, 584-869 vs 105-382 IU/mL; eosinophils, 343-560 vs 164-413 cells/mL). Of the participants in all profiles, at least 50% had 1 or more positive allergen-specific IgEs. A differential expression meta-analysis identified 3516 and 2494 differentially expressed genes for the T2HIGH and T17HIGH profiles, respectively. The T17HIGH profile was associated with interleukin 17 and neutrophil signaling pathways and the T2HIGH profile was associated with interleukin 13 signaling pathways.

Conclusions and relevance: Nasal transcriptomic profiles consistent with T2-high, T17-high, and T2-low/T17-low endotypes occurred in similar proportions across 3 studies of predominantly racially and ethnically minoritized youths with asthma. Most participants had T2-low asthma endotypes and sensitization to 1 or more allergens was common among these endotypes.


Conflict of interest statement

Conflict of Interest Disclosures: Dr Gaietto reported receiving a T32 training grant (HL129949) from the National Institutes of Health (NIH). Dr Rosser reported receiving grants from NIH (K08 HL159333). Dr Forno reported receiving grants from NIH (HL149693). Dr Celedón reported receiving nonfinancial support from Merck during the conduct of the Stress and Treatment Response in Puerto Rican and African American Children with Asthma (STAR) study and Pharmavite and GSK during the conduct of the Vitamin D Kids Asthma (VKDA) study. No other disclosures were reported.

Figures

Figure 1.
Figure 1.. Selection of Participants in a Study of Nasal Epithelial Transcriptomics of Asthma in Youths Aged 6 to 20 Years
EVA-PR indicates Epigenetic Variation and Childhood Asthma in Puerto Ricans study; PFTs, pulmonary function tests; STAR, Stress and Treatment Response in Puerto Rican and African American Children with Asthma study; and VDKA, Vitamin D Kids Asthma study. aA differential expression meta-analysis and consensus-weighted gene coexpression analysis were conducted in participants with a consensus profile (those whose transcriptomic profile assignment was the same using all 5 clustering approaches).
Figure 2.
Figure 2.. Heat Map of Transcriptomic Clusters in the STAR, EVA-PR, and VDKA Studies Using K-Means and Consensus Clustering Profiles
Study participants who had the same transcriptomic profile assignment (eg, T2HIGH, T17HIGH, or T2LOW/T17LOW) across k-means clustering, k-medoid clustering, hierarchical clustering, Gaussian mixture model, and spectral clustering approaches were deemed to have a consensus profile. EVA-PR indicates Epigenetic Variation and Childhood Asthma in Puerto Ricans study; STAR, Stress and Treatment Response in Puerto Rican and African American Children with Asthma study; and VDKA, Vitamin D Kids Asthma study.
Figure 3.
Figure 3.. Predictive Statistics for Fractional Exhaled Nitric Oxide (FeNO), Total Immunoglobulin E (IgE), and Eosinophils in Determining the T2HIGH Profile in the STAR Cohort
A, Cutoffs were 417.5 IU/mL for total IgE, 210.4 cells/μL for eosinophils, and 32.5 ppb for FeNO. B, Cutoffs were 417.5 IU/mL for total IgE, 231.9 cells/μL for eosinophils, and 31.5 ppb for FeNO. All biomarker cutoffs were defined using the Youden Index. AUC indicates area under the curve; NPV, negative predictive value; ppb, parts per billion; PPV, positive predictive value; and STAR, Stress and Treatment Response in Puerto Rican and African American Children with Asthma study.
Figure 4.
Figure 4.. Differential Expression Meta-Analysis Results
The magnitude, direction, and significance of changes in gene expression for the T2HIGH and T17HIGH profiles, respectively. A, Includes DEGs among individuals in the consensus T2HIGH profile compared with individuals in the consensus T2LOW/T17LOW profile in the meta-analysis of all 3 studies (STAR, n = 76; EVA-PR, n = 114; and VDKA, n = 27). B, Includes DEGs among individuals in the consensus T17HIGH profile compared with individuals in the consensus T2LOW/T17LOW profile in the meta-analysis of all 3 studies (STAR, n = 93; EVA-PR, n = 121; and VDKA, n = 40). Volcano plots show –log10 (raw P values) vs log2 fold change. −Log10 P refers to the logarithm (base 10) of the raw P value in the differential expression analysis. Genes with small P values, corresponding to strong differential effects, appear at the top. Log2 fold change refers to the logarithm (base 2) of the fold change in expression levels between 2 groups, where fold change is the ratio of the expression level of a gene in 1 group (eg, T2HIGH/T17LOW) to the expression level in another group (eg, T2LOW/T17LOW). Red = |log2 fold change|>1 and FDR-adjusted P value <0.01. Blue = FDR-adjusted P value <0.01 but fold change below threshold. Green = |log2 fold change|>1 but FDR-adjusted P value below significance threshold. DEGs indicates differentially expressed genes; EVA-PR, Epigenetic Variation and Childhood Asthma in Puerto Ricans study; STAR, Stress and Treatment Response in Puerto Rican and African American Children with Asthma study; and VDKA, Vitamin D Kids Asthma study.
Figure 5.
Figure 5.. Pathway Enrichment Analysis Results
Top 20 enriched (statistically overrepresented) canonical pathways of upregulated genes from T2 (A) or T17 (B) models, ranked by −log10 (FDR-adjusted P value). Red (positive enrichment scores), pathway activation; purple (negative enrichment scores), pathway inhibition; and gray, no activity prediction can be made. Gene ontology pathway enrichment for T2-related (C) and T17-related (D) modules identified in WGCNA, plotting enrichment significance (−log10) against ratio of genes involved in biological process, cellular component, or molecular function. Dot size corresponds to number of genes enriched.

Comment on

Similar articles

Cited by

References

    1. Porsbjerg C, Melén E, Lehtimäki L, Shaw D. Asthma. Lancet. 2023;401(10379):858-873. doi: 10.1016/S0140-6736(22)02125-0 - DOI - PubMed
    1. US Centers for Disease Control and Prevention . Data, statistics, and surveillance—asthma surveillance data. Reviewed July 24, 2024. Accessed June 25, 2024. https://www.cdc.gov/asthma/asthmadata.htm
    1. Pate CA, Zahran HS, Qin X, Johnson C, Hummelman E, Malilay J. Asthma surveillance—United States, 2006-2018. MMWR Surveill Summ. 2021;70(5):1-32. doi: 10.15585/mmwr.ss7005a1 - DOI - PMC - PubMed
    1. Woodruff PG, Boushey HA, Dolganov GM, et al. Genome-wide profiling identifies epithelial cell genes associated with asthma and with treatment response to corticosteroids. Proc Natl Acad Sci U S A. 2007;104(40):15858-15863. doi: 10.1073/pnas.0707413104 - DOI - PMC - PubMed
    1. Choy DF, Hart KM, Borthwick LA, et al. TH2 and TH17 inflammatory pathways are reciprocally regulated in asthma. Sci Transl Med. 2015;7(301):301ra129. doi: 10.1126/scitranslmed.aab3142 - DOI - PubMed

Publication types

MeSH terms

Substances