. 2025 Mar 4;177(3):213-223.
doi: 10.1093/jb/mvae097.

Polymerase-usage sequencing identifies initiation zones with less bias across S phase in mouse embryonic stem cells

Affiliations

Polymerase-usage sequencing identifies initiation zones with less bias across S phase in mouse embryonic stem cells

Akino Matsumoto et al. J Biochem. .

Abstract

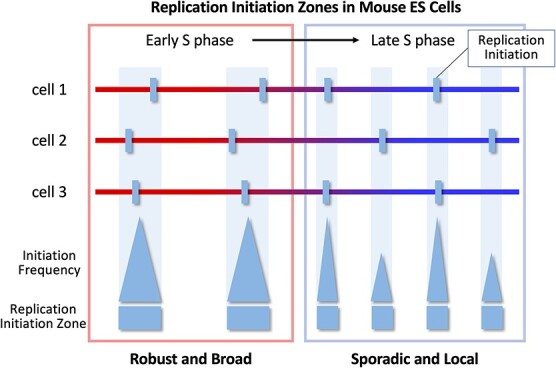
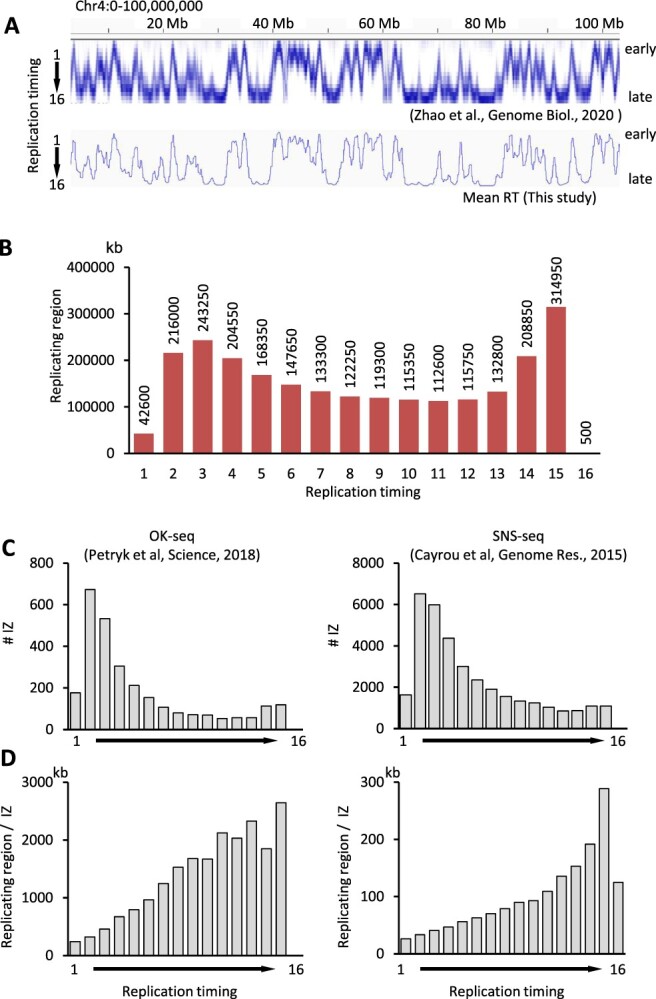
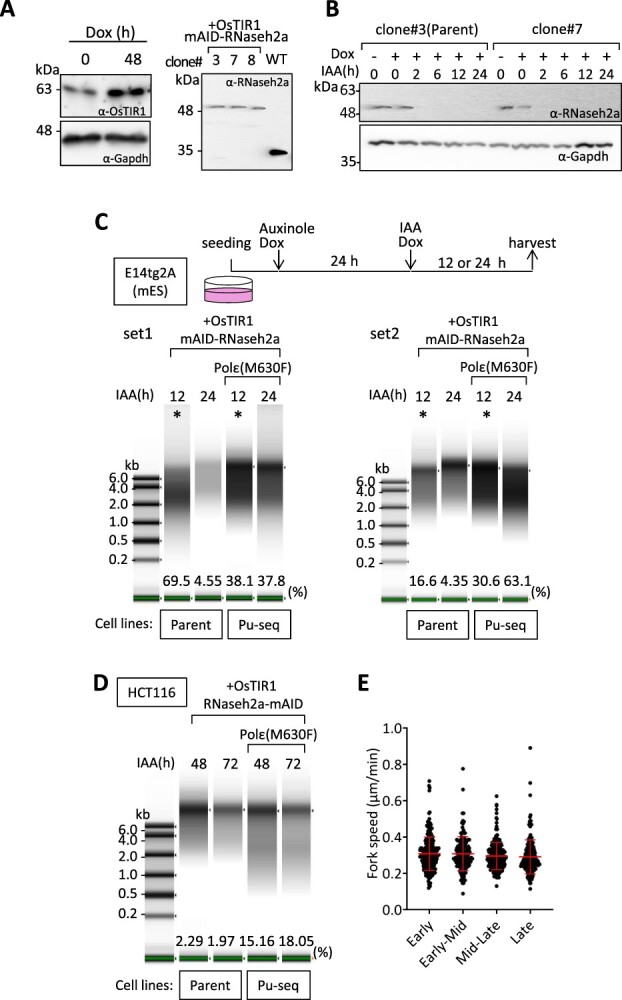
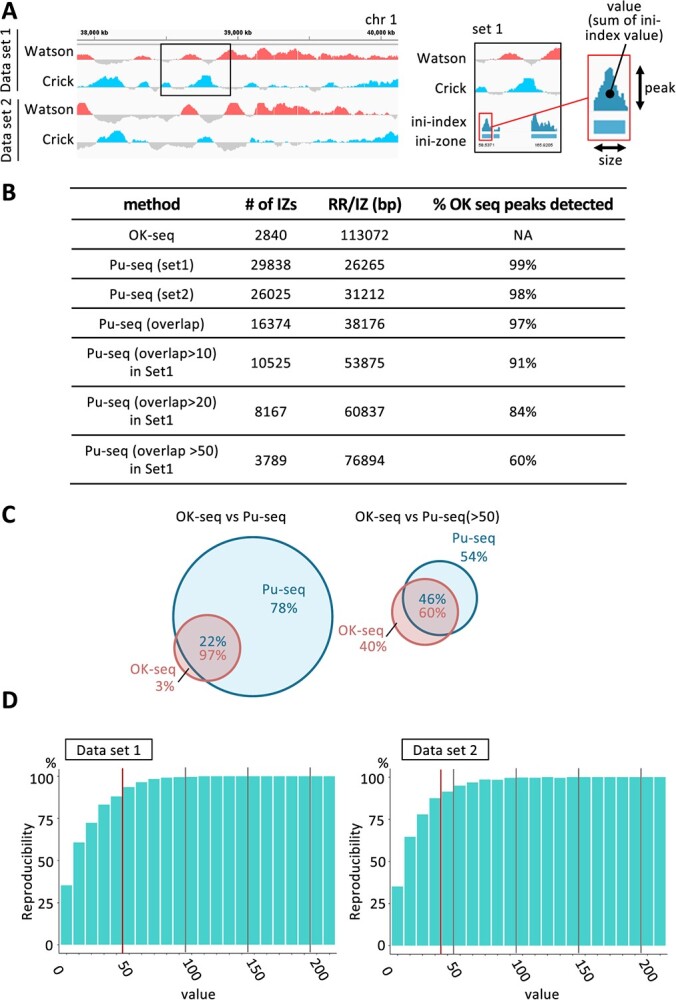
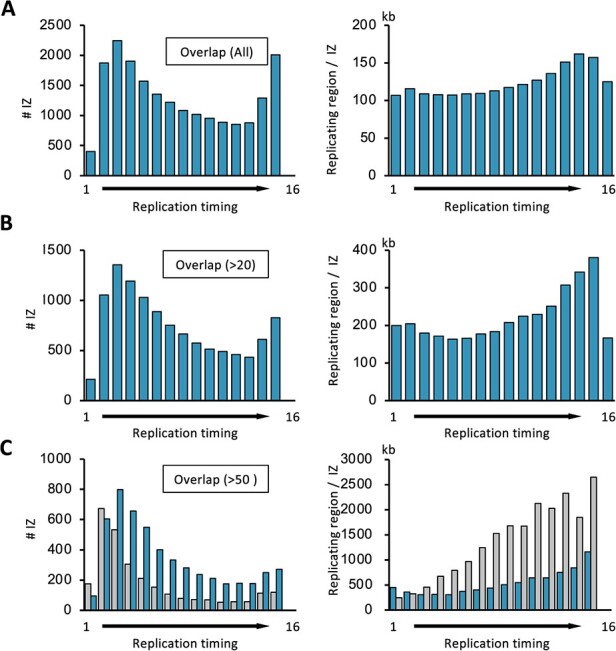
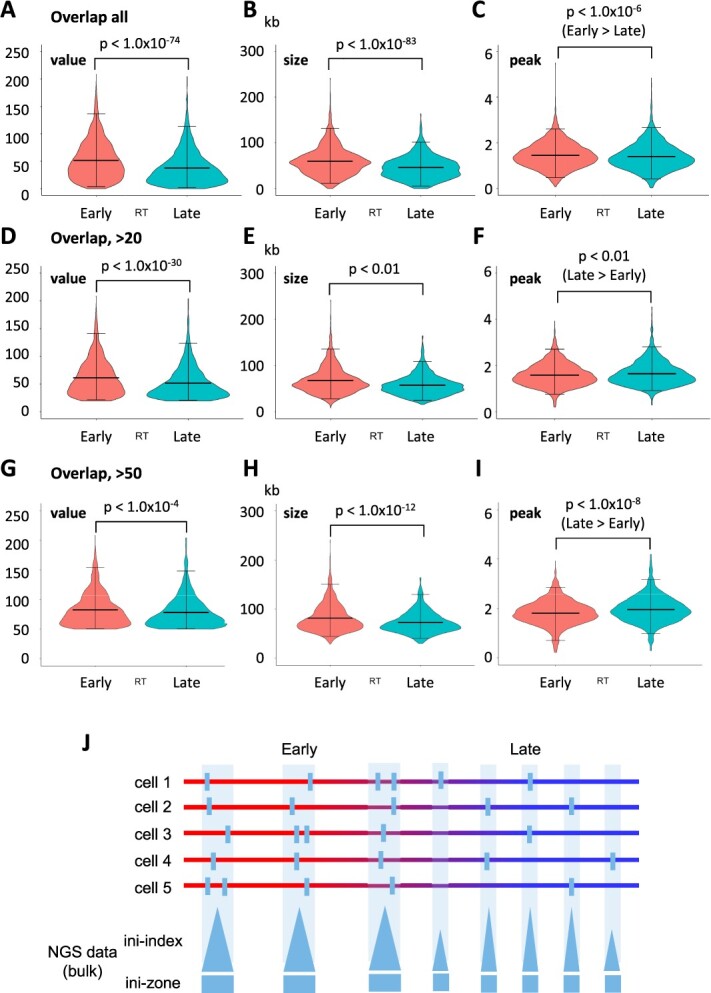
Various methods have been developed to map replication initiation zones (IZs) genome-wide, often finding far fewer IZs than expected. In particular, IZs corresponding to later stages of S phase are under-represented. Here, we reanalysed IZs with respect to replication timing in mouse ES cells. These datasets identified over five times as many early IZs compared to late IZs. In addition, we have set up a polymerase-usage sequencing (Pu-seq) system in mouse ES cells to map IZs genome-wide. Pu-seq showed less bias towards early IZs, potentially indicating better sensitivity for identifying IZs in late S phase.

Keywords: DNA replication; mouse embryonic stem cells; polymerase-usage sequencing; replication initiation zones; replication timing.


Figures

Graphical Abstract
Graphical Abstract
Fig. 1
Fig. 1
Replication IZs identified by OK-seq and SNS-seq in mouse ES cells relative to replication timing. (A) Example of RT profiles obtained by Zhao et al (20) (top). Replicating genomic regions were labelled in fractions 1–16 sorted by FACS, with fraction 1 (RT1) representing the earliest S phase and fraction 16 (RT16) being the latest. To categorize each genomic bin with a single RT value, the ‘meanRT’ was calculated (bottom, see Materials and Methods). (B) Sizes of genomic regions categorized into each RT fraction (RT1–16). The actual sizes in kilobases (kb) are shown above each bar. Note that region sizes in RT1–16 vary. For RT16, only 10 bins, corresponding to 500 kb, were included. (C) The IZs identified in OK-seq (left) and SNS-seq (right) were categorized into RT1–16, and their numbers in each RT are presented. (D) To normalize for different region sizes across RTs, replicating regions shown in (B) were divided by the number of IZs identified in (C), providing a measure of IZ density. Larger replicating region size per IZ (Replicating region/IZ) indicates that relatively few IZs are found for the size of the replicating region.
Fig. 2
Fig. 2
Establishment and assessment of the parent and the Pu-seq lines in mouse ES cells. (A) The Dox-inducible OsTIR1 cassette was knocked into the ROSA26 locus, and OsTIR1 expression levels were confirmed by western blot (left). A significant induction (3.75-fold) was observed after 48 h of Dox treatment. (right) RNaseh2a was tagged with mAID in the cell line carrying Dox-inducible OsTIR1 cassette (23), and the size and expression levels of RNaseh2a were confirmed. Tagged RNaseh2a showed the expected size on the western blot, but expression levels were considerably reduced in all three clones tested compared to wild-type. (B) RNaseh2a degradation with IAA treatment was confirmed in clones #3 and #7. RNaseh2a was undetectable 2 h after IAA treatment in both clones. Clone #3 was used as a ‘parent line’ to introduce polε (M630F) mutation to create the ‘Pu-seq line’. (C) Both the parent and Pu-seq lines were treated with Dox and IAA to evaluate ribonucleotide incorporation. Auxinole was also added with Dox to minimize background activity of TIR1. Cells were collected at 12 or 24 h after IAA treatment, and extracted genomic DNA was subjected to alkaline treatment. The level of ribonucleotide incorporation was evaluated by quantitating the level of smearing using Tape Station. Percentages shown in each lane indicate the percentage of DNA found <2 kb, relative to total DNA in the lane. Asterisks mark the samples used for Pu-seq analyses. (D) Smearing test of the parent and the Pu-seq lines of HCT116 used in the previous study (15). (E) Replication fork speed in the Pu-seq line was evaluated using the DNA fibre assay. Replication fork speed remained roughly constant across S phase. Pairwise comparisons indicated no statistical differences across samples (P > 0.05), except comparison between Early and Late samples, which showed a marginal difference (P = 0.0324). Kruskal–Wallis test.
Fig. 3
Fig. 3
Identification of replication IZs using Pu-seq. (A) DNA libraries were prepared using samples obtained in Fig. 2C, and were sent out for sequencing. The obtained reads from the Pu-seq lines were normalized to reads from the parent lines. As shown, reads for the Watson and the Crick strands display reciprocal patterns in a reproducible manner for Set1 and Set2. The boxed region is enlarged for Set1 on the right. The data was used to calculate ‘ini-indexes’, which measure the likelihood of a region being a replication initiation site. ‘Ini-zones (IZs)’ are defined as continuous regions with a positive ini-index value. IZs vary in several properties. IZs with a large ‘value’ indicate robustness and can span large or small genomic areas, represented as ‘size’. If initiation events are concentrated in a small genomic region but occur with high frequency, then the IZ will have a high ‘peak’ value. (B) Number of IZs detected in OK-seq and Pu-seq with different cut-off criteria. ‘Overlap’ refers to IZs found in both Set1 and Set2 data from Pu-seq. IZs are listed with varying cut-offs based on their IZ values: >10 (IZs with values >10), >20 (IZs with values >20), >50 (IZs with values >50). (C) Venn diagram showing the IZ peaks found in OK-seq and Pu-seq [with no cut-off (left) and those >50] and their overlaps. (D) Reproducibility of Pu-seq peaks with different values. IZs were categorized based on their values in increments of 10. IZs with values greater than 50 in the Data set 1 (left) and those with values greater than 40 in the Data set 2 (right) show >90% reproducibility.
Fig. 4
Fig. 4
Highly robust IZs are found in early S phase. (A–C) Numbers of IZs (left) and the replicating region/IZ (right) identified by Pu-seq were plotted for each RT fraction, as in Fig. 1C and D. In (C), the grey bars represent the data from OK-seq for comparison. IZs with a cut-off of >50 show similar values to OK-seq in early S phase (RT1–3) but increasingly diverge from OK-seq values towards late S phase.
Fig. 5
Fig. 5
IZs in late S phase are found in smaller genomic regions. (A–C) Violin plots showing the distribution of value (A), size (B) and peak height (C) for IZs identified in both datasets (Set1 and Set2). (D–F) Violin plots for overlapping IZs with >20. (G–I) Violin plots for IZs with values >50. Mann–Whitney tests. (J) Model. See Discussion for details.

Similar articles

References

    1. Aladjem, M.I. and Redon, C.E. (2017) Order from clutter: selective interactions at mammalian replication origins. Nat. Rev. Genet. 18, 101–116 - PMC - PubMed
    1. Gaboriaud, J. and Wu, P.J. (2019) Insights into the link between the organization of DNA replication and the mutational landscape. Genes. 10, 252–263 - PMC - PubMed
    1. Chagin, V.O., Casas-Delucchi, C.S., Reinhart, M., Schermelleh, L., Markaki, Y., Maiser, A., Bolius, J.J., Bensimon, A., Fillies, M., Domaing, P., Rozanov, Y.M., Leonhardt, H., and Cardoso, M.C. (2016) 4D visualization of replication foci in mammalian cells corresponding to individual replicons. Nat. Commun. 7, 11231. - PMC - PubMed
    1. Nakamura, H., Morita, T., and Sato, C. (1986) Structural organizations of replicon domains during DNA synthetic phase in the mammalian nucleus. Exp. Cell Res. 165, 291–297 - PubMed
    1. O'Keefe, R.T., Henderson, S.,.C., and Spector, D.L. (1992) Dynamic organization of DNA replication in mammalian cell nuclei: spatially and temporally defined replication of chromosome-specific alpha-satellite DNA sequences. J. Cell Biol. 116, 1095–1110 - PMC - PubMed