. 2025 Feb 3;224(2):e202404047.
doi: 10.1083/jcb.202404047. Epub 2025 Jan 2.

ATG9A facilitates the closure of mammalian autophagosomes

Affiliations

ATG9A facilitates the closure of mammalian autophagosomes

Ruheena Javed et al. J Cell Biol. .

Abstract

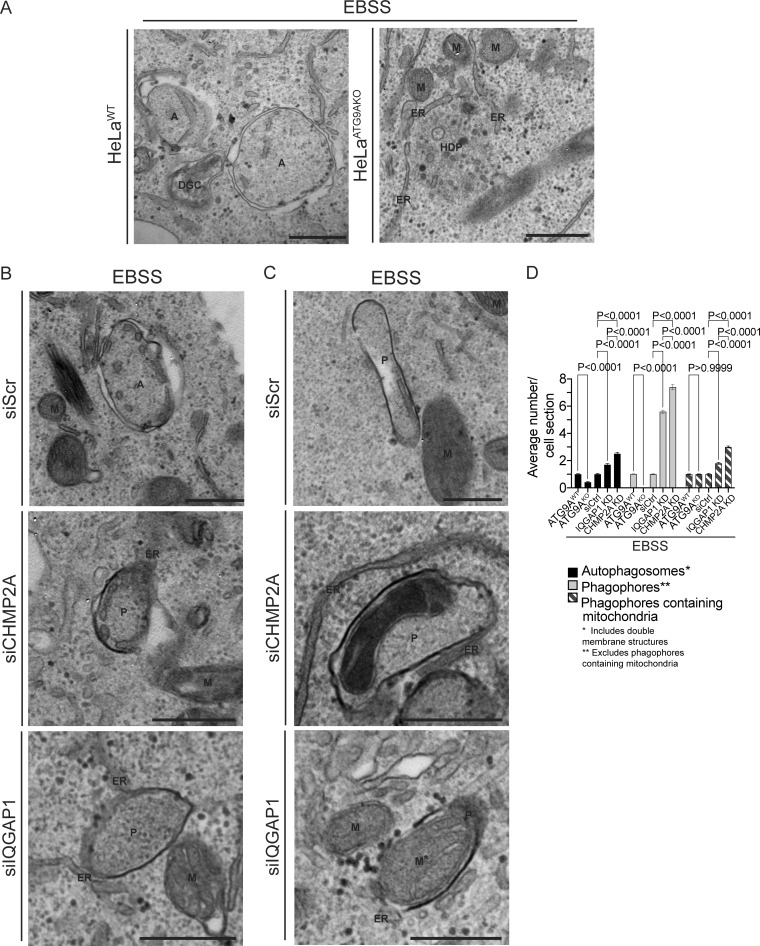
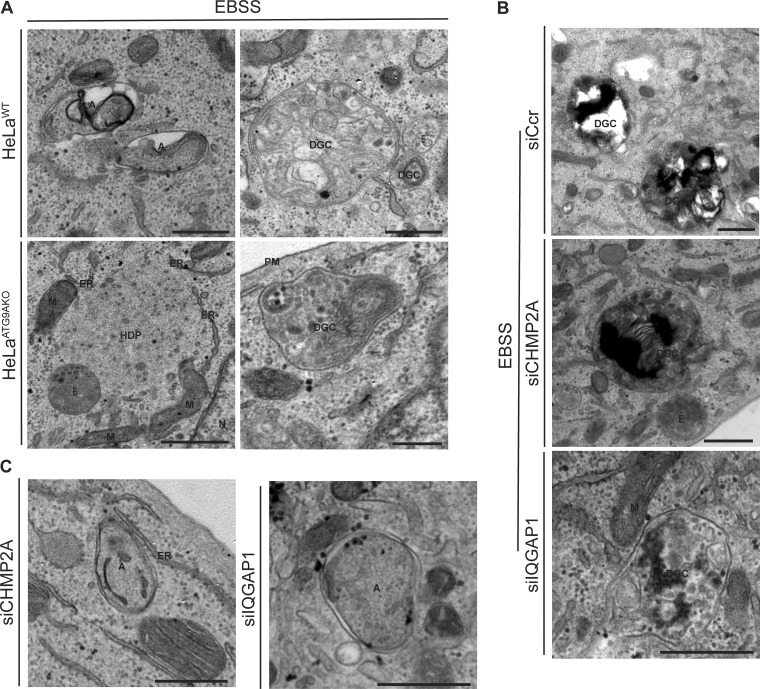
Canonical autophagy captures within specialized double-membrane organelles, termed autophagosomes, an array of cytoplasmic components destined for lysosomal degradation. An autophagosome is completed when the growing phagophore undergoes ESCRT-dependent membrane closure, a prerequisite for its subsequent fusion with endolysosomal organelles and degradation of the sequestered cargo. ATG9A, a key integral membrane protein of the autophagy pathway, is best known for its role in the formation and expansion of phagophores. Here, we report a hitherto unappreciated function of mammalian ATG9A in directing autophagosome closure. ATG9A partners with IQGAP1 and key ESCRT-III component CHMP2A to facilitate this final stage in autophagosome formation. Thus, ATG9A is a central hub governing all major aspects of autophagosome membrane biogenesis, from phagophore formation to its closure, and is a unique ATG factor with progressive functionalities affecting the physiological outputs of autophagy.


Conflict of interest statement

Disclosures: The authors declare no competing interests exist.

Figures

Figure 1.
Figure 1.
IQGAP1 plays a role in autophagosome closure. (A) Scatter plot of ATG9A proximity proteome comparing starvation-induced autophagy (EBSS, 90 min) and treatment with CCCP (20 µM, 6 h) identified by LC-MS/MS in FLAG-APEX2-ATG9A Flp-In T-REx HEK293(TetON) cells. For highlighted proteins (colors defined in inset legend), functions are separated by the stage of autophagosome biogenesis. (B) Schematic ATG9A was modified from the AlphaFold entry AF-Q7Z3C6 by rotating the unstructured C-terminal loop to avoid clashes with the membrane. Successive stages of autophagosome biogenesis: initiation (X), expansion (Y), and closure (Z). (C) Schematic representation of quantitative high content microscopy HaloTag (HT)-LC3B based closure assay (MIL/MPL HCM) encompassing incubation with membrane-impermeant HT ligand (MIL) to stain and saturate HT-LC3B-II accessible to the cytosol followed by membrane-permeant HT ligand (MPL) to stain LC3B-II (protected from and free of MIL because of sequestration within sealed membranes). (D) IQGAP1 knockdown (siRNA pool) in Huh7 HT-LC3B cells, immunoblot analysis. (E) MIL/MPL HCM quantification in Huh7 HT-LC3B control cells or cells knocked down for IQGAP1. Starvation in EBSS, 90 min incubation ± 100 nM BafA1. (i) MPL+ puncta (red symbols), closed autophagosomes. (ii) MIL+ puncta (green symbols), unclosed phagophores, and other accessible HT-LC3B; (iii) Ratio of MIL+ and MPL+ profiles (puncta/cell; gray symbols) in i and ii. Circles, siRNA control cells; squares, cells knocked down for IQGAP1. (F) Immunoblot of IQGAP1 KD with individual siRNAs, MIL/MPL HCM quantification in Huh7 HT-LC3B control cells or cells knocked down for IQGAP1 (siRNA1, squares; siRNA2, triangles) and complementation with siRNA resistant constructs pDest-3xFLAG-iQGAP1Res1 (diamonds) or pDest-3xFLAG-IQGAP1Res2 (inverted triangles) against siRNA1 and siRNA2, respectively. Starvation in EBSS, 90 min incubation ± 100 nM BafA1. (i–iii) MPL+ puncta (red symbols), (ii) MIL+ puncta (green symbols), (iii) Ratio of MIL+ and MPL+ profiles (puncta/cell; gray symbols). HCM parameters: 60 fields/well, >500 primary objects (cells)/well; 6 (E) or 4 (F) wells per sample/plate. Statistical significance was determined by one-way ANOVA and post-hoc Tukey’s multiple comparison test. Data, means ± SD, n = 5 (E) or 3 (F) biologically independent experiments per condition. Source data are available for this figure: SourceData F1.
Figure S1.
Figure S1.
IQGAP1 contributes to autophagosome closure via CHMP2A. (A) HCM Images (example) of the effects of IQGAP1 knockdown in Huh7-HT-LC3 cells in Fig. 1 E, (masks: white, primary objects; green, MIL+ profiles; red, MPL+ profiles). (B) Immunoblot analysis of IQGAP1 knockdown with individual siRNAs, siRNA1 or siRNA2 in Huh7 HT-LC3B cells. (C) HCM example images corresponds to Fig. 1, F i–iii. (D) Upper panel, expression analysis by immunoblotting of the siRNA1 or siRNA2 resistant constructs pDest-3xFLAG-IQGAP1Res1 and pDest-3xFLAG-IQGAP1Res2 in Huh7 HT-LC3B cells. Lower panel, examples of HCM images of FLAG+ (gated) cells transfected with pDest-3xFLAG-IQGAP1Res1 or pDest-3xFLAG-IQGAP1Res2, corresponding to Fig. 1, F i–iii. (E) Immunoblot analysis of IQGAP1 knockdown in Huh7 HT-LC3B cells (top blot) and protease protection assay (bottom blot) of p62 and NDP52 in Huh7 HT-LC3B cell extracts (siRNAs: Scr, siRNA control; siIQGAP1, IQGAP1 siRNA) ± proteinase K with or without Triton X-100 treatment. Quantification of p62 and NDP52 levels (band intensities) in control and proteinase K-treated samples. Data are means ± SD, n = 3 (biologically independent experiments); one-way ANOVA followed by Tukey’s multiple comparison test. (F) Quantification by immunoblotting (band intensity) of CHMP2A in whole cell lysates in control cells and cells knocked down for IQGAP1 (corresponding to Fig. 2, D ii). (G) Quantification (i–iii) and example images (iv), MIL/MPL HCM assay in Huh7 HT-LC3B cells treated with control (siScr) or CHMP2A siRNA (siCHMP2A) and sequentially incubated with membrane-impermeable HT ligand (MIL) to stain HT-LC3B-II (cytosolic) and membrane-permeant HT ligand (MPL) to stain LC3B-II, sequestered within closed membrane. HCM images: MPL+ (red mask) and MIL+ (green mask) puncta. Huh7 HT-LC3B cells were incubated in EBSS to induce autophagy for 90 min ± BafA1 (100 nM). Scale bars, 10 μm. Source data are available for this figure: SourceData FS1.
Figure 2.
Figure 2.
IQGAP1 is necessary for degradative autophagy and bridges ATG9A with CHMP2A. (A) Schematic, TMRHT release assay. TMRHT-LC3B (HaloTag-LC3B) is processed by lysosomal hydrolases releasing the TMRHT fragment from a fusion with LC3B. Released (HaloTag stabilized by TMR) is detectable by in-gel fluorescence and immunoblotting. Top, open phagophores do not yield the TMRHT fragment. Bottom, closed autophagosomes fuse with lysosomes and the TMRHT fragment is released. (B)TMRHT release in IQGAP1 knockdown or control (siScr) cells stably expressing HT-LC3B. TMR+, cells incubated with TMR for 30 min. Cells were starved in EBSS for 90 min, lysed, and processed for in-gel fluorescence and immunoblotting. (i) In-gel fluorescence detection of released TMRHT. (ii) Immunoblot detection of released TMRHT. (iii) quantification of released TMRHT in immunoblots. (C) ESCRT protein subcomplexes with components present in or absent from LC-MS/MS after proximity biotinylation with APEX2-ATG9A. Cells (FLAG-APEX2-ATG9A Flp-In T-REx HEK293[TetON]) were incubated in EBSS (90 min) or treated with CCCP in full medium for 6 h. Black, proteins detected in all conditions; blue, detected only in EBSS; purple, detected only in CCCP; red, not detected in any samples. Note ESCRTs absent from proteomic dataset (red color). (D) Co-IP analysis of GFP-ATG9A with endogenous CHMP2A in Huh7 cells, control (siScr) or knocked down for IQGAP1 by siRNA. Cells were treated with protonophore CCCP for 6 h as a means to collapse organellar proton gradients. (i) Immunoblot, IQGAP1 knockdown in Huh7 cells. (ii) Western blot, Co-IP analysis of GFP-ATG9A (GFP pulldown), and endogenous CHMP2A in control and IQGAP1 depleted cells. (iii) Quantification of Co-IP analyses (CHMP2A band intensity was ratioed to the intensity of the upper band in GFP-ATG9A blots). Data, means ± SD, n = 3 ANOVA. (E) Summary of findings in Fig. 2. Source data are available for this figure: SourceData F2.
Figure 3.
Figure 3.
ATG9A colocalizes with CHMP2A and supports sequential stages in autophagosome biogenesis. (A) Confocal microscopy imaging of Huh7WT cells transiently transfected with pDest-3xFLAG-ATG9A and GFP-CHMP2A and stained for endogenous LC3B. Cells were starved in EBSS for 90 min. White square, enlarged area in the inset (merged image; dashed diagonal line - section). (B) Profile intensity (dashed diagonal in A inset) for multiple fluorescence channels. (C) Immunoblot analysis of ATG9A KO in Huh7 cells and MIL/MPL HCM closure assay in Huh7WT (circles) and Huh7ATG9AKO (squares) cells stably expressing HT-LC3B; starvation-induced autophagy (EBSS, 90 min) ± 100 nM BafA1. (i–iii) Quantifications: (i) MPL+ HT-LC3B (red symbols); (ii) MIL+ HT-LC3B (green symbols); (iii) MIL/MPL ratios (puncta/cell; gray symbols). (D) HCM images: red masks, MPL+ profiles, green masks, MIL+ profiles. Quantification: >500 (cells)/well with 80 fields/well; 6 wells per sample/plate. Data, means ± SD, n = 5 (biologically independent experiments); one-way ANOVA followed by Tukey’s multiple comparison test. (E) Complementation analysis of Huh7ATG9AKO HT-LC3B cells transfected with pDest-3xFLAG, pDest-3xFLAG-ATG9AWT or pDest-3xFLAG-ATG9AM33 mutant. Source data are available for this figure: SourceData F3.
Figure S2.
Figure S2.
Localization analysis of IQGAP1, CHMP2A, and ATG9A and effects of their depletion on autophagosome closure. (A) Huh7WT cells were transiently co-transfected with pDest-3xFLAG-ATG9A and pDest-GFP-CHMP2A and stained for endogenous IQGAP1. Cells were starved in EBSS for 90 min. The selected area is shown within the white square, and the inset is depicted in the merged image. The region of interest (ROI) is marked with a diagonal dashed white line. (B) Profile intensity (dashed diagonal in A inset) for multiple fluorescence channels. (C) Representative images (HCM), one of 80 fields/well in reference to Fig. 3 E. Huh7WT and Huh7ATG9AKO cells stably expressing HT-LC3B complemented with pDest-3xFLAG-ATG9AWT or pDest-3xFLAG-ATG9AM33 (lipid scramblase mutant). (D) Immunoblot analysis of ATG9A, CHMP2A and IQAGP1 knockdown in Huh7 HT-LC3B cells. (E) Quantification, MIL/MPL HCM closure assay. HeLa HT-LC3B (stable cells) treated with siRNAs for CHMP2A (squares), IQGAP1 (triangles), ATG9A (diamonds), or control (Scr; circles). Autophagy was induced in EBSS for 90 min ± BafA1 (100 nM). Cells were sequentially incubated with MIL to stain unclosed structures and MPL to stain HT-LC3B-II available in closed membrane. (i–iii) MPL+, (red) puncta/cell, (ii) MIL+ (green) puncta/cell; (iii) MIL/MPL (gray) ratios of puncta per cell in I and ii. (F) HCM images represent examples (1 of 80 fields/well; >500 primary objects (cells)/well; 4 wells per sample/plate) of MPL+ (red masks; closed) and MIL+ (green masks; unclosed) quantified in E. Data means, ± SD, n = 5 (biologically independent experiments); two-way ANOVA followed by Tukey’s multiple comparison test Scale bars, 10 μm. Source data are available for this figure: SourceData FS2.
Figure 4.
Figure 4.
In vitro assay for autophagosome closure. (A) SolVit (sealing of organellar limiting membranes in vitro) assay schematic: in vitro complementation by mixing postnuclear supernatants (PNS) from ATG9AKO HT-LC3B cells (Acceptor) with PNS from ATG9AWT or ATG9AKO cells (Donor), ±ATP, incubated for 1 h. PNS were from cells treated with 20 μM CCCP for 6 h. Reaction products were stained with MIL and MPL sequentially and immobilized in mounting media on the bottom of 96-well plates followed by HCM quantification. (B i–iii) MPL+ profiles (red); (ii) MIL+ profiles (green). (iii) MIL/MPL ratios (gray). Each HCM experimental point: 1,000 valid primary objects/cells per well, 5 wells/sample. Data, means ± SD, n = 3 (biologically independent experiments); one-way ANOVA followed by Tukey’s multiple comparison test. (C) Examples of HCM images from SolVit assay. Red profiles, MPL+ closed LCB+ membranes; Green profiles, MIL+ unclosed LC3B+ membranes. Scale bars, 3 μm. Source data are available for this figure: SourceData F4.
Figure 5.
Figure 5.
Ultrastructural analysis of ATG9A, IQGAP1, and CHMP2A in autophagosome closure. (A–C) Representative transmission electron microscopy (EM) micrographs of profiles in HeLaWT and HeLaATG9AKO (A), and HeLa cells treated with siRNA control (siScr), CHMP2A siRNA, or IQGAP1 siRNA (B and C). Cells were treated with EBSS (90 min) to induce autophagy. Examples of mitochondria engulfed in phagophores (C) in CHMP2A and IQGAP1 knockdown cells after EBSS treatment (90 min). (D) Quantification of autophagic structures (average number/cell section) in cells treated with EBSS (90 min) 60 sections were examined for counting. A, autophagosomes (engulfed content of similar electron density to surrounding cytosol); ER, endoplasmic reticulum; HDP, high density particle; M, mitochondria; P, phagophores. Statistics, unpaired t test. Data, sample mean, SE. Source data are available for this figure: SourceData F5.
Figure S3.
Figure S3.
Transmission electron microscopy analysis of HeLa cell knocked out for ATG9A or knocked down for CHMP2A and IQGAP1. (A) Quantification of the average number of autophagosomes (black bars) and phagophores (gray bars) per cell section in HeLaWT or HeLaATG9AKO, HeLa siRNA control (siScr), or HeLa knockdown for CHMP2A and IQGAP1 (non-normalized data corresponding to the graph in Fig. 3 D). (B and C) Electron micrographs as in Fig. 3 with highlighted (yellow) open regions. (C and D) Additional examples (micrographs) representing phagophores containing mitochondria or not in CHMP2A and IQGAP1 knockdown cells quantified in Fig. 3 D. T test. Data means ± SE. Scale Bar 500 nm. A: Autophagosome; ER, Endoplasmic Reticulum; M, Mitochondria; M*, Mitochondria inside a phagophore; N, Nucleus; P, Phagophore. Source data are available for this figure: SourceData FS3.
Figure S4.
Figure S4.
Additional types of profiles in electron micrographs from ultrastructural analyses. (A) HeLaWT and HeLaATG9AKO cells. Note autophagosome and DGC in HeLaWT cells and HDP and fewer DGC in HeLaATG9AKO. (B and C) HeLa cells knocked down for CHMP2A or IQGAP1. siRNA: siSCr control, CHPM2A or IQGAP1. A, autophagosome; DGC, degradative compartments; ER, endoplasmic reticulum; HDP, high density particle; M, mitochondria; N, nucleus; E, endosome; PM, plasma membrane. Scale bar, 500 nm. Source data are available for this figure: SourceData FS4.
Figure S5.
Figure S5.
AlphaFold-Multimer modeling of potential IQGAP1-ATG9A interacting sites. (A) Annotated regions of IQGAP1 with fragments used in AlphaFold Multimer predictions; numbers, start/end residues. (B) Rank 1 model of Site 1. (C) Highlighted regions of ATG9A and IQGAP1 colored by pLDDT score (defined in legend). (D) Predicted aligned error (PAE) plot for site 1 model. (E) AlphaFold confidence metrics for Site 1. (F) Putative interactions predicted by AlphaFold-Multimer. Site 1 flipped 180° to enable viewing of a putative binding pocket in IQGAP1. (G) AlphaFold model of full-length ATG9A (AlphaFold database: AF-Q7Z3C6). Yellow, unstructured C-terminal region; green, unstructured N-terminal region; cornflower blue, transmembrane helices; magenta, predicted binding site. (H) AlphaFold model of ATG9A495839 colored using the same scheme as in G. (I) Predicted aligned error (PAE) plot for site 2 model. (J) AlphaFold confidence metrics for Site 2. (K) Interface area as calculated using the PISA server for both Site 1 and Site 2. (L) Example images (MIL/MPL HCM) corresponding to the complementation experiments in Fig. 7 E. White masks, primary objects (cells); red masks, MPL+ structures; green masks, MIL+ structures. Gating was on FLAG transfected cells stained with anti-FLAG for immunofluorescence detection (blue). Scale bar 10 μm. Source data are available for this figure: SourceData FS5.
Figure 6.
Figure 6.
The C-terminal domain of ATG9A mediates its interaction with IQGAP1. (A and B) CD1 and CD2 mutant sites. Numbers, position within full size ATG9A. Mutated residues in ATG9A are indicated in gray. In A: S, polar instead of aromatic W; K, basic instead of acidic E; R, charged instead of aliphatic L; and N, polar instead of aromatic Y. In B, five consecutive residues (FSRLP) were changed to five As. (C) Co-IP analysis of pDest-3xFLAG-ATG9AWT or pDest-3xFLAG-ATG9ACD1 with pDest-GFP-IQGAP1 in transfected HEK293T cells and quantification of GFP-IQGAP1 and FLAG-ATG9A ratios. (D) Co-IP analysis of pDest-3xFLAG-ATG9AWT or pDest-3xFLAG-ATG9ACD2 with GFP-IQGAP1 in transfected HEK293T cells and quantification of GFP-IQGAP1 and FLAG-ATG9A intensity ratios. (E) Co-IP analysis of CD1 and CD2 ATG9A mutants (3xFLAG fusions) with GFP-FIP200 and endogenous ATG13. Huh7ATG9AKO were transfected with pDest-3xFLAG, pDest-3xFLAG-ATG9AWT, pDest-3xFLAG-ATG9ACD1, pDest-3xFLAG-ATG9ACD2. Autophagy was induced by EBSS (90 min). Data are means ± SD, n = 3–5 (biologically independent experiments); one-way ANOVA followed by Tukey’s multiple comparison test. Source data are available for this figure: SourceData F6.
Figure 7.
Figure 7.
Disrupted ATG9A–IQGAP1 interaction impairs autophagosomal closure. (A–D) TMRHT release assay (see Fig. 2) in Huh7WT or Huh7ATG9AKO cells stably expressing HT-LC3B. Huh7ATG9AKO transfected with pDest-3xFLAG, pDest-3xFLAG-ATG9AWT, pDest-3xFLAG-ATG9ACD1, or pDest-3xFLAG-ATG9ACD2. Free TMRHT was measured by in-gel fluorescence (A and B) and immunoblotting (C and D). Cells were induced for autophagy in EBSS (90 min). Data are means ± SD, n = 3 (biologically independent experiments); one-way ANOVA followed by Tukey’s multiple comparison test. (E) MIL/MPL HCM assay in Huh7ATG9AKO HT-LC3B cells transiently transfected with pDest-3xFLAG-ATG9AWT (circles), pDest-3xFLAG-ATG9ACD1 (squares), or pDest3xFLAG-ATG9ACD2 (triangles). Gating on FLAG immunofluorescence was used to identify transfected cells. (i–iii) MPL+, closed HT-LC3B profiles (red symbols); (ii) MIL+, accessible HT-LC3B (green symbols); (iii) MIL/MPL ratios (gray symbols) of puncta/cell values in (i) and (ii). Cells were starved in EBSS for 90 min ± 100 nM BafA1, sequentially incubated with HT ligands MIL and MPL with immunostaining of FLAG incorporated into the protocol. Quantification: >500 cells/well; 4 wells per sample/plate, Data, means ± SD, n = 4 (biologically independent experiments); ANOVA followed by Tukey’s multiple comparison test. Source data are available for this figure: SourceData F7.
Figure 8.
Figure 8.
Effects of ATG9A on the viability of mice and in a murine model of tuberculosis. (A) Survival curves of Atg9afl/fl LysM-Cre+ and Atg9afl/fl LysM-Cre littermate mice uninfected or infected with M. tuberculosis Erdman aerosol (low dose/chronic infection; initial lung deposition, 225 CFU). (B) Survival curves of Atg9afl/fl LysM-Cre+ or Atg9afl/fl LysM-Cre mice infected with M. tuberculosis Erdman aerosol (high dose/acute infection; initial lung deposition 2,491 CFU). CFU, colony forming units. Statistical test, Mantel–Cox. Source data are available for this figure: SourceData F8.
Figure 9.
Figure 9.
A model of ATG9A roles in consecutive stages of the canonical autophagy pathway. (i–iv) Stages: initiation (i), expansion (ii a and ii b; alternative ATG9A trafficking pathways for its inclusion in or cycling to/from phagophores), and closure (iii), leading to the formation of double-membrane autophagosomes (iv). ATG2A-ATG9A model is a modified PDB file from van Vliet et al. (2022). IQGAP1 and CHMP2A, AlphaFold structures AF-Q9JKF1 and AF-O43633-F1.

Similar articles

References

    1. Axe, E.L., Walker S.A., Manifava M., Chandra P., Roderick H.L., Habermann A., Griffiths G., and Ktistakis N.T.. 2008. Autophagosome formation from membrane compartments enriched in phosphatidylinositol 3-phosphate and dynamically connected to the endoplasmic reticulum. J. Cell Biol. 182:685–701. 10.1083/jcb.200803137 - DOI - PMC - PubMed
    1. Azad, K., Guilligay D., Boscheron C., Maity S., De Franceschi N., Sulbaran G., Effantin G., Wang H., Kleman J.P., Bassereau P., et al. 2023. Structural basis of CHMP2A-CHMP3 ESCRT-III polymer assembly and membrane cleavage. Nat. Struct. Mol. Biol. 30:81–90. 10.1038/s41594-022-00867-8 - DOI - PubMed
    1. Behar, S.M., and Baehrecke E.H.. 2015. Tuberculosis: Autophagy is not the answer. Nature. 528:482–483. 10.1038/nature16324 - DOI - PubMed
    1. Bertin, A., de Franceschi N., de la Mora E., Maity S., Alqabandi M., Miguet N., di Cicco A., Roos W.H., Mangenot S., Weissenhorn W., and Bassereau P.. 2020. Human ESCRT-III polymers assemble on positively curved membranes and induce helical membrane tube formation. Nat. Commun. 11:2663. 10.1038/s41467-020-16368-5 - DOI - PMC - PubMed
    1. Broadbent, D.G., Barnaba C., Perez G.I., and Schmidt J.C.. 2023. Quantitative analysis of autophagy reveals the role of ATG9 and ATG2 in autophagosome formation. J. Cell Biol. 222:e202210078. 10.1083/jcb.202210078 - DOI - PMC - PubMed

MeSH terms

Substances

LinkOut - more resources