. 2025 Feb 1;36(2):ar21.
doi: 10.1091/mbc.E24-10-0456. Epub 2025 Jan 2.

A large reverse-genetic screen identifies numerous regulators of testis nascent myotube collective cell migration and collective organ sculpting

Affiliations

A large reverse-genetic screen identifies numerous regulators of testis nascent myotube collective cell migration and collective organ sculpting

Maik C Bischoff et al. Mol Biol Cell. .

Abstract

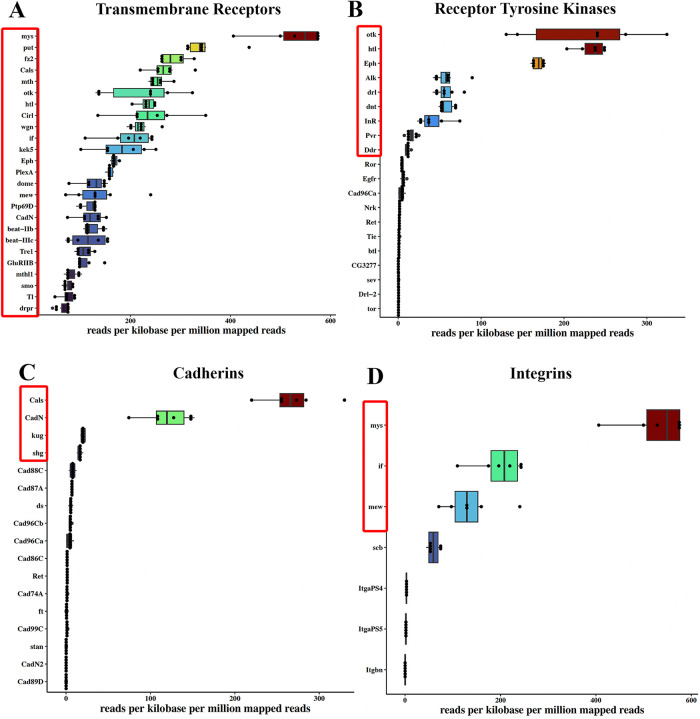
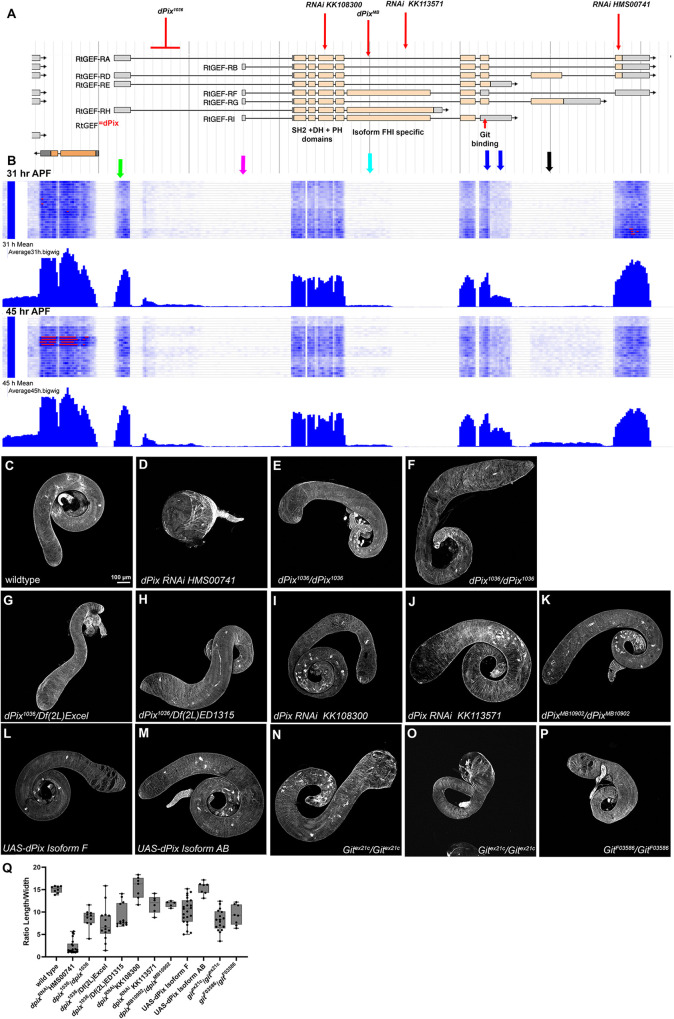
Collective cell migration is critical for morphogenesis, homeostasis, and wound healing. Migrating mesenchymal cells form tissues that shape the body's organs. We developed a powerful model, exploring how Drosophila nascent myotubes migrate onto the testis during pupal development, forming the muscles ensheathing it and creating its characteristic spiral shape. To define genes regulating this, we used RNA sequencing (RNA-seq) to identify genes expressed in myotubes during migration. Using this dataset, we curated a list of 131 ligands, receptors, and cytoskeletal regulators, including all Rho/Ras/Rap1 regulators, as candidates. We then expressed 279 short hairpin RNAs (shRNAs) targeting these genes and examined adult testes. We identified 29 genes with diverse roles in morphogenesis. Some have phenotypes consistent with defective migration, while others alter testis shape in different ways, revealing the underlying logic of testis morphogenesis. We followed up on the Rho-family GEF dPix in detail. dPix knockdown drastically reduced migration and thus muscle coverage. Our data suggest different isoforms of dPix play distinct roles in this process and reveal a role for its partner Git. We also explored whether dPix regulates Cdc42 activity or cell adhesion. Our RNA-seq dataset and genetic analysis provide an important resource for the community to explore cell migration and organ morphogenesis.


Conflict of interest statement

Conflicts of interests: The authors declare no financial conflict of interest.

Figures

FIGURE 1:
FIGURE 1:
Stages of testis morphogenesis and diagrams illustrating the steps used to generate our RNA-seq datasets. (A) Testis morphogenesis begins during pupal development at 30 h APF when nascent myotubes move from the genital disc onto the testis. By 45 h APF, they have covered the entire testis. They then elongate and condense (53 and 66 h APF) enclosing the testis in circumferential muscles. (B–J) The sequential steps in our RNA-seq screen.
FIGURE 2:
FIGURE 2:
FACS sorting allowed us to isolate pure populations of living multinucleate myotubes. (A) FACS profile along the propidium iodide versus the GFP-fluorescence [Alexa488] axis. Cells with high propidium iodide signals were likely dead cells and were discarded. (B) FACS profile along the Vybrant DyeCycleViolet [v450] versus GFP-fluorescence [Alexa488] axis. The Vybrant DyeCycleViolet [v450] signal assesses the DNA content of living cells and allowed us to separate the cells with high-GFP signal into three populations differing in DNA content. (C–E) Examples of cells from the three populations revealing cells with one (C), two (D), or three (E) nuclei. Red = phalloidin (F-actin). Green = GFP Blue = DAPI (DNA). Insets in the upper right show the DNA channel of one cell from each image.
FIGURE 3:
FIGURE 3:
Identifying genes up- and down-regulated at the early and late timepoints. (A) GO terms of genes up-regulated at the 45 h APF timepoint (top, highlighted in gold; equivalent to those down-regulated at the 31 h timepoint) or down-regulated at the 45 h APF timepoint (bottom; equivalent to those up-regulated at the 31 h timepoint). At the right are examples of up-regulated GO terms that reflect muscle differentiation or potential neuromuscular synapse assembly. (B–D) Volcano plots of genes significantly up-regulated at 31 h APF (left, highlighted in teal) or significantly up-regulated 45 h APF (right, highlighted in magenta). Genes which did not reach the significance threshold are depicted in gray (statistical test: Wald test (null model: There is no change between the timepoints). Nominal p-values were adjusted for multiple testing). (B) Highlighted here are selected examples of genes with known roles in muscle differentiation that are significantly up-regulated at the 45 h APF timepoint. (C) Highlighted here are selected examples of genes that encode mesoderm transcription factors or proteins involved in myotube fusion, most of which are significantly up-regulated at the 31 h APF timepoint. (D) Highlighted here are 22 genes that are significantly up-regulated at the 31 h APF timepoint that we chose to include in the RNAi screen.
FIGURE 4:
FIGURE 4:
Genes selected for our RNAi screen. Four lists derived from the Flybase-curated “Gene Group” lists. In each, genes are ranked by level of expression (reads per kilobase per million mapped reads), and genes included in our RNAi screen are boxed in red. (A) Transmembrane receptors. (B) Receptor tyrosine kinases. (C) Cadherin family members. (D) Integrin subunits.
FIGURE 5:
FIGURE 5:
RNAi lines that alter muscle coverage or distal testis shape. Adult testes from wild type or adults expressing a UAS-driven RNAi line targeting the indicated gene under the control of Mef2-GAL4. All are stained with fluorescently-labeled phalloidin to reveal F-actin, which highlights muscles. (A) Wild type. The wild-type testis is fully covered in circumferential muscle and has a spiral shape with a very gradual reduction in diameter toward the proximal end. (B–T) Testis from knockdown lines, arranged according to phenotypic class and severity. Detailed descriptions of each are in the text. (B–D) Extreme loss of muscle coverage. The inset in D shows a close-up illustrating the “striated muscle phenotype.” (E–I) Strong loss of distal muscle coverage (arrows). The more proximal arrow in G shows variation in testis diameter. (J–M) Variable loss of distal muscles or gaps in muscle coverage (arrows). (N–P) Strong N or weaker gaps that are not confined to the distal end (arrows). (Q–T) Distal testis is enlarged (arrows). B–P are genes included in our Class 1 (Migration/Adhesion defects). Q–T are a subset of the genes included in our Class 2 (Testis Shaping defects).
FIGURE 6:
FIGURE 6:
RNAi lines that alter testis morphology in other ways. Adult testes from wild type or adults expressing a UAS-driven RNAi line targeting the indicated gene under the control of Mef2-GAL4. All are stained with fluorescently-labeled phalloidin to reveal F-actin, which highlights muscles. More detailed descriptions of individual phenotypes are in the text. (A) Wild type, showing normal shape. Inset reveals normally aligned muscles. (B–F) Variable testis diameter leading to a wavy margin (arrows). (G and H) Broadened and shortened testis. Rlip knockdown also leads to variations in testis diameter (arrows). (I–L) regional variations in testis diameter. (M) Narrowed and elongated testis. (O–R) Strong defects in muscle alignment (Inset in O, arrows) and loss of spiraling. (S–U). Defects in muscle alignment (arrows) coupled with other defects in testis shape. (B–M) are a subset of the genes included in our Class 2 (Testis Shaping defects). O- U are the genes in our Class 3 (Muscle alignment and shape altered).
FIGURE 7:
FIGURE 7:
dPix knockdown dramatically slows myotube migration, and reducing N-cadherin partially suppresses adult testis defects. (A and B) Adult testis illustrating the range of phenotypes seen after dPixRNAi. (C) Wild-type myotube migration beginning ∼38 h APF. Green = Lifeact-eGFP, revealing actin. Magenta = mCherry with an added NLS, marking nuclei. (D and E) Representative examples of the delay in migration after dPixRNAi. Some myotubes that are far apart remain interconnected by long processes that stretch over myotubes located between them (arrows). (F) Adult testis after NcadRNAi. (G) Adult testis after dPixRNAi; NcadRNAi. (H) Quantification of phenotypic severity, quantified as ratio of width to length. Statistical test: ordinary One-way ANOVA with Šídák's multiple comparisons test. Adjusted p-values: NCadRNAi versus dPixRNAi: <0.0001, NCadRNAi versus NCadRNAi + dPixRNAi 0.0019, dPixRNAi versus NCadRNAi + dPixRNAi: 0.015.
FIGURE 8:
FIGURE 8:
Different dPix isoforms play differential roles in testis morphogenesis and the dPix binding partner Git also plays a role. (A) Diagram of the genomic structure of the dPix gene, scale at top, 5′ end left, exons are gray (noncoding) or tan (protein coding) boxes and introns are lines. Multiple dPix isoforms are illustrated. Above are indicated the locations of three shRNAs targeting different exons and the location of mobile element insertions in two mutant alleles. Below are some features of the dPix protein isoforms. (B) RNA-seq data from the 31 h APF and 45 h APF timepoints. Colored arrows indicate exons discussed in the text. (C–O) Adult testes from wild type, adults expressing the noted UAS-driven RNAi line targeting dPix under control of Mef2-GAL4, or the dPix or git mutant alleles indicated. All are stained with fluorescently-labeled phalloidin to reveal F-actin, which highlights muscles. Phenotypes are discussed in the text. (P) Quantification of testis shape change in different dPix and git mutants or knockdowns, expressed at the ratio of length to width.
FIGURE 9:
FIGURE 9:
Knockdown of the AB isoforms of dPix elevates rather than reduces the signal from a Cdc42 biosensor. (A, B, D, G, I, J) Images of the Cdc42 biosensor (the CRIB domain of Mbt fused to EGFP) expressed in the myotubes on the seminal vesicle at the base of the testis, using Mef2-GAL4. (A) In wild type, the biosensor signal is found at the plasma membrane. (B) Cdc42 knockdown reduces cortical biosensor signal. (C) Line scans perpendicular to the membrane reveal the reduction in the cortical signal. Wild type: N = 7, RNAi: N = 8. (D and E) Slightly reduced biosensor signal after Rac2 knockdown. Wild type: N = 6, RNAi: N = 8. (F) Quantification of normalized membrane signal in wild type, two different Cdc42 RNAi lines, and a Rac2 RNAi line. Statistical tests: Kruskal Wallis test and Dunn's multiple comparisons test. Wild type versus Cdc42RNAi 1: p < 0.0001, wild type versus Cdc42RNAi 2: p < 0.0001, wild type versus Rac2RNAi: p = 0.0075. (G and H) Slightly reduced biosensor signal after expression of a GDP-locked Cdc42N17 mutant. Wild type: N = 8, Cdc42N17: N = 8. (I and J). dPix knockdown elevates the cortical biosensor signal. Wild type: N = 17, RNAi: N = 30. (K) Line scans perpendicular to the membrane. (L) Quantification of normalized membrane signal. Statistical test: Student's t test, p < 0.0001.
FIGURE 10:
FIGURE 10:
Cartoon illustrating the sequential events of testis morphogenesis and the steps at which we hypothesize each gene may act. (A) Diagrams of the entire testis and closeups of the myotubes at each step. (B) Changes in actin and N-cadherin localization at each step. (C) Stages of morphogenesis and proposed steps at which different genes act.

Update of

Similar articles

Cited by

References

    1. Aberle H (2019). Axon guidance and collective cell migration by substrate-derived attractants. Front Mol Neurosci 12, 148. - PMC - PubMed
    1. Bahri SM, Choy JM, Manser E, Lim L, Yang X (2009). The Drosophila homologue of Arf-GAP GIT1, dGIT, is required for proper muscle morphogenesis and guidance during embryogenesis. Dev Biol 325, 15–23. - PubMed
    1. Bischoff MC, Bogdan S (2021). Collective cell migration driven by filopodia-new insights from the social behavior of myotubes. Bioessays 43, e2100124. - PubMed
    1. Bischoff MC, Bogdan S (2023). Dissecting collective cell behavior in migrating testis myotubes in Drosophila. Methods Mol Biol 2608, 117–129. - PubMed
    1. Bischoff MC, Lieb S, Renkawitz-Pohl R, Bogdan S (2021). Filopodia-based contact stimulation of cell migration drives tissue morphogenesis. Nat Commun 12, 791. - PMC - PubMed

MeSH terms

Substances

LinkOut - more resources