. 2025 Jan 17;12(1):ENEURO.0279-24.2024.
doi: 10.1523/ENEURO.0279-24.2024. Print 2025 Jan.

Eye Movements during Measurements of Visual Vertical in the Poststroke Subacute Phase

Affiliations

Eye Movements during Measurements of Visual Vertical in the Poststroke Subacute Phase

Yasuaki Arima et al. eNeuro. .

Abstract

The subjective visual vertical (VV), the visually estimated direction of gravity, is essential for assessing vestibular function and visuospatial cognition. In this study, we aimed to investigate the mechanisms underlying altered VV perception in stroke participants with unilateral spatial neglect (USN), specifically by examining their eye movement patterns during VV judgment tasks. Participants with USN demonstrated limited eye movement scanning along a rotating bar, often fixating on prominent ends, such as the top or bottom. This suggests a reflexive response to visually salient areas, potentially interfering with accurate VV perception. In contrast, participants without USN showed broader scanning around the center of the bar. Notably, participants with USN without frontal lobe lesions occasionally exhibited extended scanning that included the bar's center, which was associated with accurate VV judgments. These findings suggest that (1) a tendency to fixate on peripheral, prominent areas and (2) frontal lobe involvement in disengaging and redirecting spatial attention may influence VV perception in USN. Based on these results, targeted rehabilitation strategies that encourage individuals with USN to extend their visual scanning beyond prominent endpoints and include central areas could improve VV accuracy. This study highlights the specific eye movement behaviors contributing to VV misperception, emphasizing the importance of training that broadens scanning to improve VV perception effectively.

Keywords: disengagement; eye movements; stroke; subjective visual vertical; unilateral spatial neglect.


Conflict of interest statement

The authors declare no competing financial interests.

Figures

Figure 1.
Figure 1.
Measurement procedure of the subjective VV and eye movement. A, Experimental setup. B, A luminous bar, initially tilted 30° to the left or right, was gradually rotated toward the vertical around its center on a dark background until the participant judged that it was precisely vertical. The VV was defined as the discrepancy (in degrees) between the subjectively judged and true vertical orientation (0°). C, D, Orientation (C) and variability (D) of the VV in different groups. The box plot center mark indicates the median; a box’s top and bottom edges indicate the 25th and 75th percentiles, respectively. Each dot indicates the data for one participant. USN(+)RHD, participants with USN and right hemisphere damage (RHD) (n = 17); USN(−)RHD, participants without USN and with RHD (n = 9); USN(−)LHD, participants without USN and with LHD (n = 14); NC, normal control (n = 28). C, VVm, the mean (degree) of VV in all trials for each participant, as the VV orientation. Negative values indicate deviation of the VV toward the contralesional direction; positive values indicate deviation of the VV toward the ipsilesional direction. D, VVsd, the standard deviation of VV in all trials for each participant, as the intraindividual variability in VV. Asterisks indicate significance levels with Bonferroni’s correction (adjusted p < 0.05/6, Wilcoxon rank-sum test). E, Trial-based VV values for each participant. Participants are arranged on the horizontal axis in a descending order of VVsd. The VV is shown for five trials starting from an ipsilesional tilt (top half) and five trials from a contralesional tilt (bottom half). Red and blue indicate deviation from the vertical to the ipsilesional and contralesional sides, respectively. The color density indicates the extent of deviation in degrees (see the color scale below the panel). Cross marks indicate missing values. Additional statistical analyses, including correlations between VVm, VVsd, and the severity of USN, are shown in Extended Data Figure 1-1.
Figure 2.
Figure 2.
Each participant group showed characteristic eye-scan paths. A, Examples of eye position and bar orientation. The panels illustrate one initial right-tilt trial from a 30° tilt until the participant responded that the bar was vertical. a, USN(+)RHD, participants with USN; b, USN(−)RHD, participants without USN with RHD; c, USN(−)LHD, participants without USN with LHD; d, NC, normal controls. Colored circles and the black + indicate the eye position detected as a “fixation” (see Materials and Methods), and gray circles indicate the eye positions that failed to meet the criteria of a fixation. The orientation of the bar and the corresponding fixation circles for each moment are in the same color: 30° tilt, blue, and red, straight. B-E, Quantitative characterization of eye-scan paths during the subjective VV measurement. B, “Ratio of an eye on the bar,” the ratio of the duration for which the eye position (red circle) is within a 2° distance from the bar relative to the positions over the whole trial duration (see an inset above the graph). C, “Total scan length projected on the bar,” the total sum of eye movement length projected on the bar (dotted lines in an inset above the graph). D, Frequency of fixation (for the definition of “fixation”; see Materials and Methods). E, Mean duration of fixation. For each panel, asterisks indicate the main effect of group difference as assessed using a GLMM and Tukey’s test (*p < 0.05; ***p < 0.001). The trials were categorized based on their initial tilt direction: Lt (leftward or counterclockwise tilt, blue) and Rt (rightward or clockwise tilt, red), and each participant's mean values for both directions are connected by a line. Additional statistical analyses, including correlations between VV measures and the eye movement measures in USN(+)RHD participants, are shown in Extended Data Figure 2-1.
Figure 3.
Figure 3.
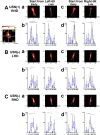
The distributions of eye positions during the measurement of subjective VV for normal control participants (NC). a, c, Mean of the ratio of eye position density two-dimensional maps for NC participants, separately for the initial direction of the bar, start from “left-tilt” or “right-tilt” and during the “early” (30° to 15° tilt) and “late” (15° tilt and more) phases of a trial. X and Y axes indicate degrees from the center of the rotating bar. White lines indicate the real vertical and 30° (early) or 15° (late) tilts. b, d, Relative frequencies of eye positions in five different visual spaces. C, A central square of 4 × 4°; LU, left-up; LD, left-down; RU, right-up, and RD, right-down represent spaces excluding the central square. In each box plot, the center mark indicates the median, and the top and bottom edges of the box indicate the 25th and 75th percentiles, respectively. Data of each participant are connected by lines. The lines above the box plot signify significant differences between spaces. B. The distribution of eye position relative to the bar. The eye position on the top half of the bar was defined as positive. The data signify the mean and SE of the eye position of all NC participants.
Figure 4.
Figure 4.
The different distributions of eye positions during the measurement of subjective VV between the groups. A, USN(+)RHD: participants with USN; B, C, USN(−): participants without USN; RHD, right hemisphere damage; LHD, left hemisphere damage. Same format as Figure 3. For USN(+)RHD, the significant peak of the ratio of eye position was observed around the top part of the bar (Ab, “LU”; Ad “RU”) or lower part of the bar for left-tilt trials (Ab, “RD”). For USN(−)RHD and LHD, the significant peak of the ratio of eye position was observed around the center (B, Cb, Cd, “C”).
Figure 5.
Figure 5.
The distribution of eye position relative to the bar varied depending on the subject groups and subjective VV. The histograms signify the mean and standard error of the ratio of eye position frequencies reflected on the bar. The eye position on the top half of the bar was defined as positive. A, B, The distribution of eye position on the bar of USN(+)RHD in red, USN(−)RHD in blue, and USN(−)LHD in cyan are compared with NC in green (repeated presentation of Fig. 3B). Dots in each color indicate significant difference from NC (p < 0.05 ROC analyses using 1,000 times bootstrapping). C, D, The distribution of eye position on the bar of USN(+) RHD whose VV was improved by a longer eye scan on the bar (Fig. 6, USN(+) RHD Pts. 1, 2, 7, 11, 13, and 14). Red lines indicate trials with good VV (VV ≥ −4 or VV ≤ 4 (mean ± 2SD of VV data derived from NC, −4.3 < VV ≤ 4.5); black lines indicate trials with bad VV (VV ≤ −5 or VV ≥ 5). E, F, Same as C, but of USN(+) RHD whose VV was not improved by a longer eye scan on the bar (Fig. 6, USN(+) RHD Pts. 8, 10, 15, and 17).
Figure 6.
Figure 6.
A subgroup of USN(+)RHD participants showed subjective VV improvement with longer eye-scan length on the bar. A, For each USN(+)RHD participant, separately for initially left (contralateral)- and right (ipsilateral)-tilt trials, “VV improvement index”: [the absolute value of VV for a trial with the shortest eye-scan length projected on the bar] − [the absolute value of VV for a trial with the longest eye-scan length projected on the bar] was computed. Positive values indicate improvement of VV with longer eye scan. If the average of the indices for ipsilateral- and contralateral-start trials were positive (Pts. 1, 2, 7, 11, 13, and 14, colored in orange), we judged that the subject with “VV improved with longer eye scans”; if negative (Pts. 8, 10, 15, and 17, colored in purple), we assigned the subjects with “VV not improved with longer eye scans.” B, C, Trial-by-trial correlation between VV (vertical axis) and total scan length projected on the bar (horizontal axis) for USN(+)RHD participants. Trials that started from a rightward tilt are plotted using red open circles; those from a leftward tilt are plotted using blue cross marks; dotted vertical lines indicate the median value of the VV data computed separately for rightward- and leftward-tilt start trials. B, A subgroup of “VV improved with longer eye scans” showed improvements in VV (i.e., close to zero on the vertical axis) with a longer total scan length projected on the bar (X-axis). C, A subgroup of “VV not improved with longer eye scans” did not show improvement in VV even with a longer total scan length projected on the bar. D, E. Lesion anatomy derived using MRI and CT shows the extent of cortical and subcortical lesions in USN(+)RHD participants. D is of six participants, as in B, who showed improvement; E is of four participants, as in C, who did not show improvement of VV with longer eye scans. Data of participants excluded from comparisons based on trial selection criteria are shown in Extended Data Figure 6-1. Additional statistical analyses, including correlations between the normalized brain lesion size and VV measures or eye movement measures, as well as lesion locations in regions related to eye movement control, are shown in Extended Data Figure 6-2.
Figure 7.
Figure 7.
The distribution of eye scans was associated with subjective VV accuracy. A, B. The distributions of eye position for good VV (VV ≥ −4 or VV ≤ 4 (mean ± 2SD of VV data derived from NC, −4.3 < VV ≤ 4.5) and bad VV (VV ≤ −5 or VV ≥ 5) trials for USN(+)RHD participants (Pts. 1, 2, 7, 11, 13, and 14) whose VV was improved with longer eye scans along the bar. The two-dimensional mapping of the relative distribution of eye positions (a, c) and relative frequencies of eye positions in five different visual spaces (b, d) during good VV trials (A) and bad VV trials (B) are shown. Same format as Figure 4. C, The distributions of eye position for bad VV trials for USN(+)RHD participants (Pts. 8,10, 15, and 17) whose VV was not improved with longer eye scans along the bar.

Similar articles

References

    1. Barra J, Marquer A, Joassin R, Reymond C, Metge L, Chauvineau V, Perennou D (2010) Humans use internal models to construct and update a sense of verticality. Brain 133:3552–3563. 10.1093/brain/awq311 - DOI - PubMed
    1. Behrmann M, Ghiselli-Crippa T, Dimatteo I (2001) Impaired initiation but not execution of contralesional saccades in hemispatial neglect. Behav Neurol 13:39–60. 10.1155/2002/253201 - DOI - PMC - PubMed
    1. Berger MF, Johannsen L, Karnath HO (2008) Time course of eye and head deviation in spatial neglect. Neuropsychology 22:697–702. 10.1037/a0013351 - DOI - PubMed
    1. Bonan IV, Guettard E, Leman MC, Colle FM, Yelnik AP (2006) Subjective visual vertical perception relates to balance in acute stroke. Arch Phys Med Rehabil 87:642–646. 10.1016/j.apmr.2006.01.019 - DOI - PubMed
    1. Brandt T, Dieterich M, Danek A (1994) Vestibular cortex lesions affect the perception of verticality. Ann Neurol 35:403–412. 10.1002/ana.410350406 - DOI - PubMed

LinkOut - more resources