. 2025 Jan 6;12(1):ENEURO.0511-24.2024.
doi: 10.1523/ENEURO.0511-24.2024. Print 2025 Jan.

Optical Assay of the Functional Impact of Cuprizone-Induced Demyelination and Remyelination on Interhemispheric Neural Communication in the Anterior Cingulate Cortex via the Corpus Callosum

Affiliations

Optical Assay of the Functional Impact of Cuprizone-Induced Demyelination and Remyelination on Interhemispheric Neural Communication in the Anterior Cingulate Cortex via the Corpus Callosum

Kyoka Tsukuda et al. eNeuro. .

Abstract

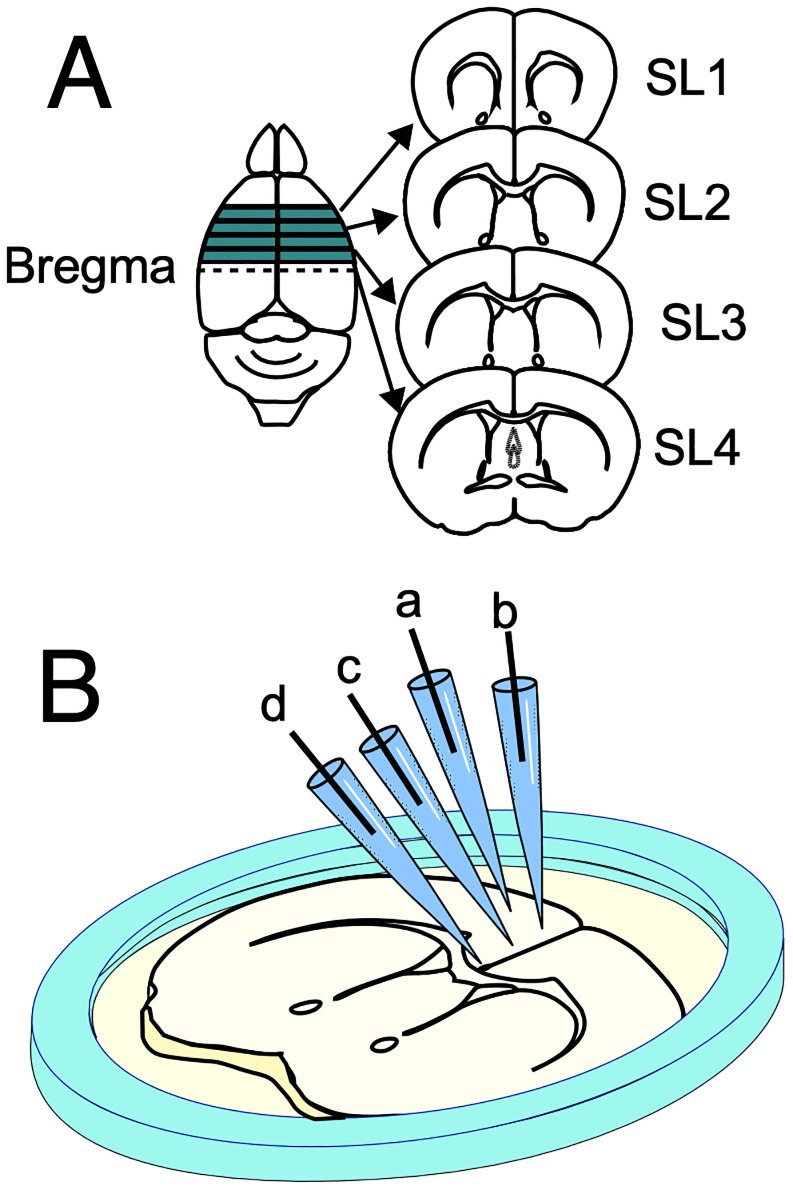
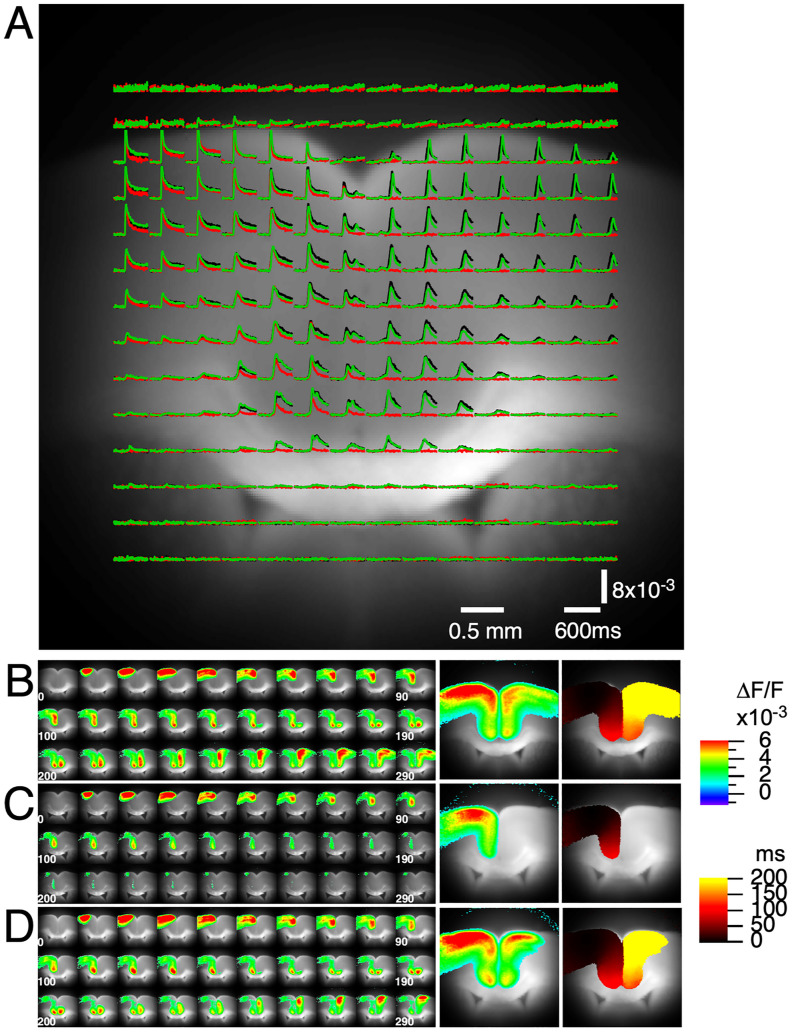
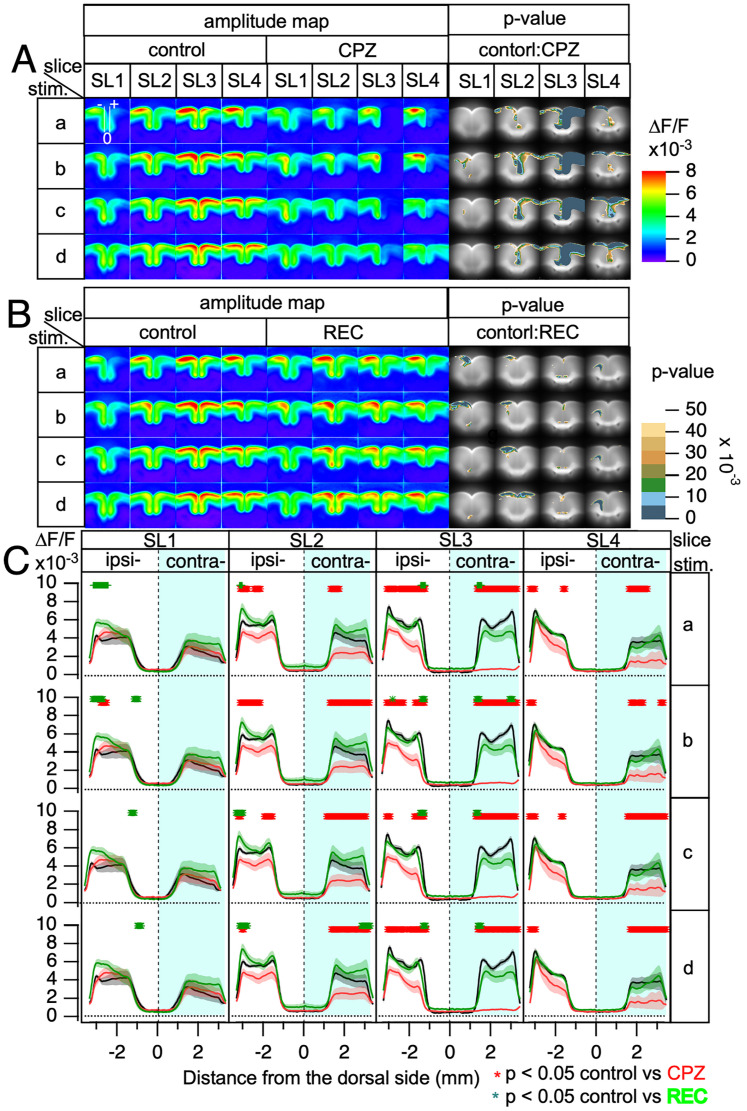
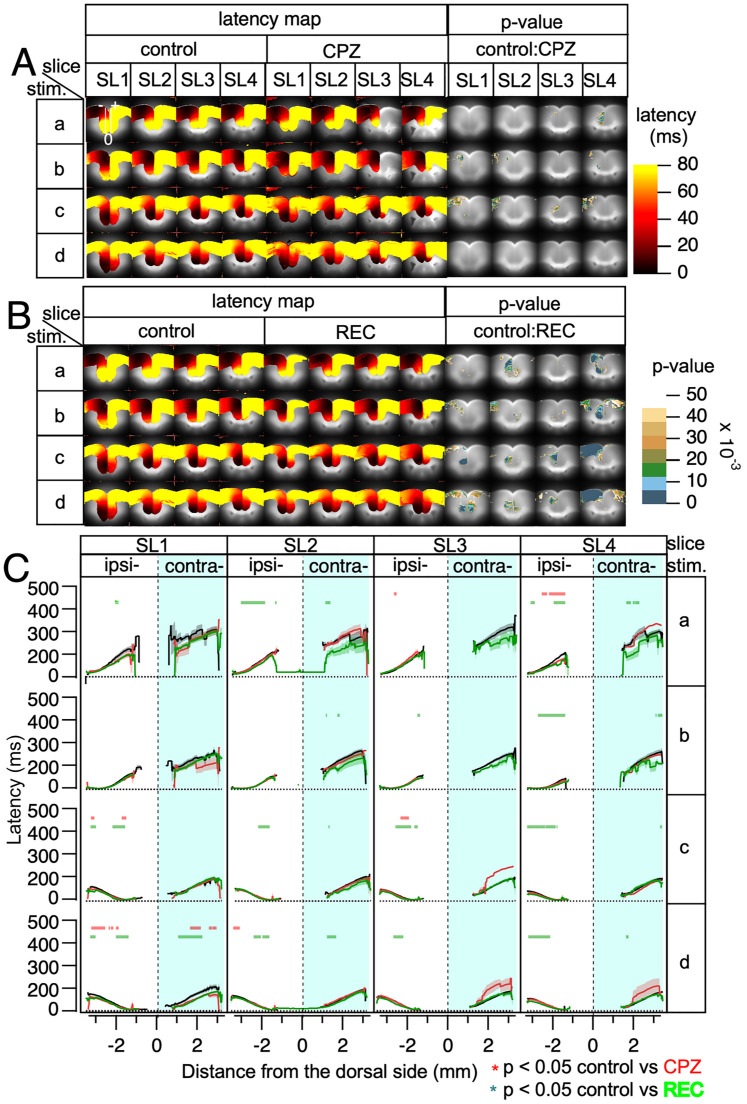
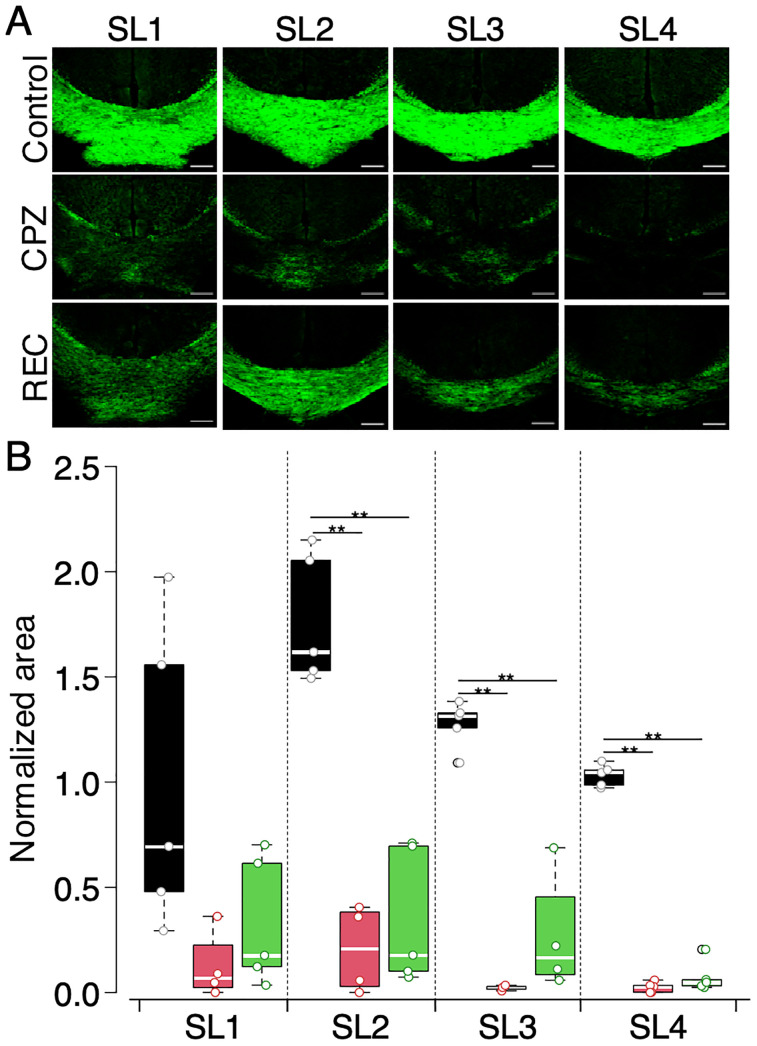
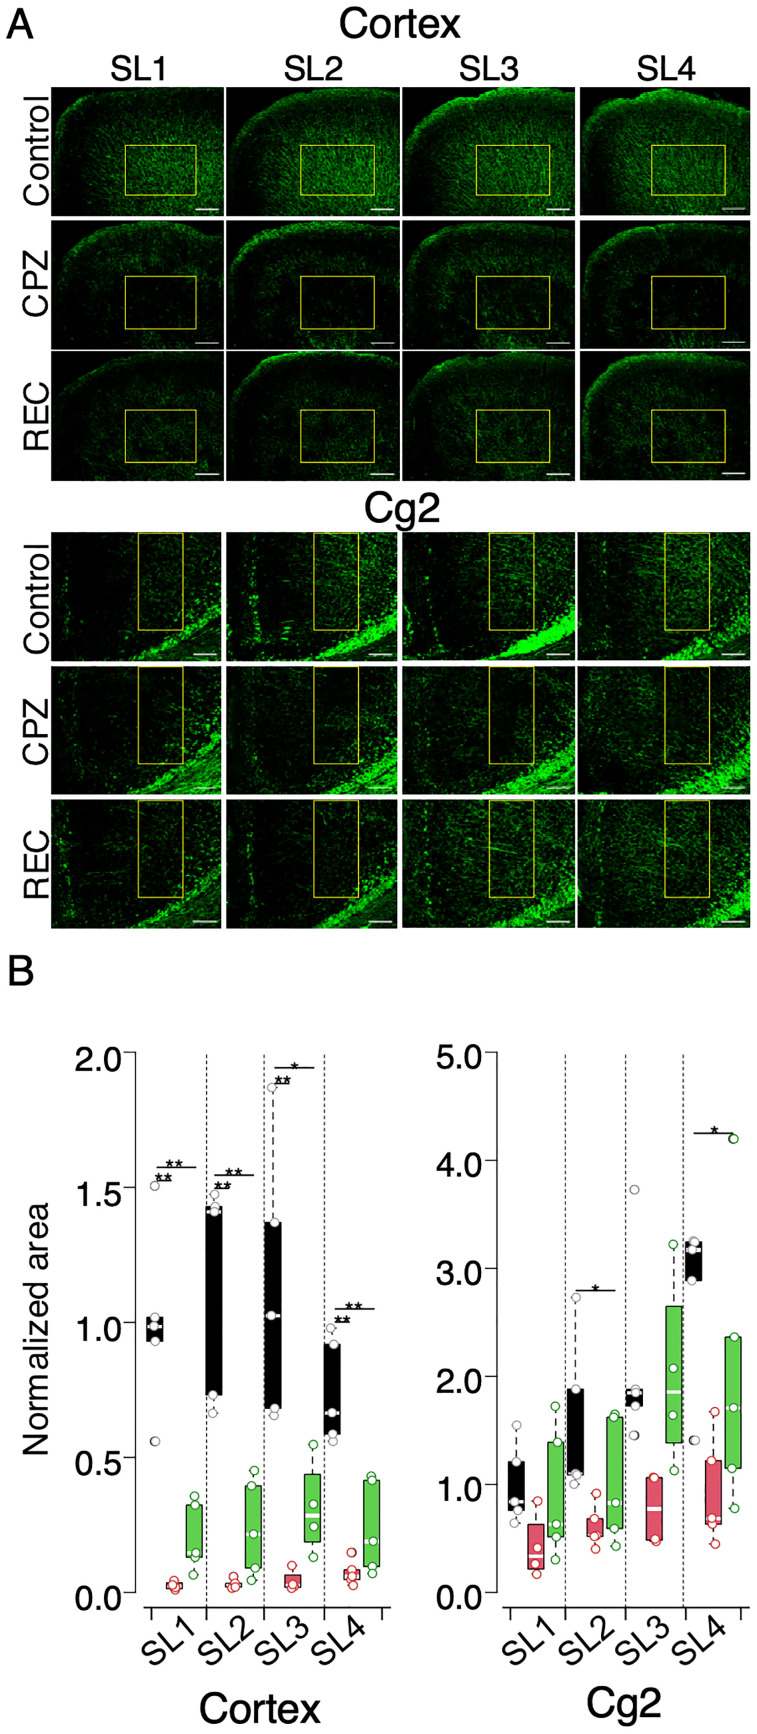
Cuprizone (CPZ) is a widely used toxin that induces demyelinating diseases in animal models, producing multiple sclerosis (MS)-like pathology in rodents. CPZ is one of the few toxins that triggers demyelination and subsequent remyelination following the cessation of its application. This study examines the functional consequences of CPZ-induced demyelination and the subsequent recovery of neural communication within the anterior cingulate cortex (ACC), with a particular focus on interhemispheric connectivity via the corpus callosum (CC). By employing wide-field, high-speed, voltage-sensitive dye imaging, we were able to provide real-time mapping of neural activity in the ACC of CPZ-fed mice. Although we could not record physiological signals from the CC, the results demonstrated a notable impairment in interhemispheric connections within the ACC via the CC, with the most pronounced loss observed in a specific coronal slice among a series of slices examined. Notably, the latency of neural signal propagation remained largely unaltered despite connectivity loss, indicating that demyelination affects the extent, rather than the temporal dynamics, of neural communication. It is noteworthy that while functional connectivity appeared to recover fully after the cessation of CPZ, histological analysis revealed only partial recovery of myelination, indicating a discrepancy between functional and structural recovery. These findings enhance our understanding of how demyelination affects the ACC's role in orchestrating neural activity, particularly in light of the slice-specific nature of interhemispheric communication impairments. These findings offer new insights into MS pathology, particularly regarding the role of the CC in interhemispheric communication and potential therapeutic strategies.

Keywords: anterior cingulate cortex; corpus callosum; cuprizone; medial prefrontal cortex; multiple sclerosis; voltage-sensitive dye.


Conflict of interest statement

The authors declare no competing financial interests.

Figures

Figure 1.
Figure 1.
A, Consecutive coronal slices from the rostral to caudal part of the PFC. These slices represent different regions of the PFC, moving from the rostral (front) to the caudal (back) regions of the brain. B, Schematic illustration of an SL3 slice placed on a ring with a membrane filter. The diagram shows four stimulation sites (a–d) along Layers II/III of the cortex, each representing different regions targeted for optical recording during experiments.
Figure 2.
Figure 2.
Representative responses to electrical stimulation in Layers II/III of the ACC of a coronal slice. A, A fluorescent image of the ACC coronal slice obtained using a high-speed 256 × 256 imaging system. Superimposed on this image are traces representing optical signals measured from selected pixels. Black traces correspond to data from control mice, red traces represent CPZ mice, and green traces represent REC mice. B, Consecutive images illustrate the propagation of neuronal activity following electrical stimulation, shown in increments of 10 ms. Adjacent to these images is a panel showing the projection of the peak signal values for each pixel onto the original fluorescent image, highlighting the amplitude of the response. The rightmost panel displays the latency values from the time of stimulation, demonstrating the rate at which activity spread across the slice. C, D, Similar datasets are presented for CPZ mice (panel C) and REC mice (panel D), highlighting the differences in activity spread and propagation time compared with control mice.
Figure 3.
Figure 3.
Averaged amplitude maps and line profiles for electrical stimulation across slices SL1 to SL4. A, Averaged amplitude maps for stimulations a–d applied to slices SL1–SL4 are shown in pseudocolor. Each pixel value represents the response amplitude, and pixel-wise statistical analysis was performed using ANOVA to compare control and CPZ mice. The p values are represented in pseudocolor to highlight significant differences. B, Averaged amplitude maps comparing the control and REC mice using the same pseudocolor representation and pixel-wise ANOVA analysis as shown in panel A. C, Line profiles of amplitude along a selected line are superimposed on the SL1-stim image, with data plotted for control (black line), CPZ (red line), and REC (green line) mice, along with the standard error of the mean (SEM). Statistically significant differences (p < 0.05) between the control and CPZ mice are indicated with red symbols, while the differences between the control and REC mice are denoted by green symbols positioned above the corresponding line profile graphs. In all the panels, stimulation was applied to the left hemisphere of the slices (ipsilateral side). n = 6–10 for each group.
Figure 4.
Figure 4.
Averaged latency maps and line profiles for electrical stimulation across slices SL1–SL4. A, Averaged latency maps following stimulations a–d in slices SL1–SL4 shown in pseudocolor. Each pixel value represents the response latency, and pixel-wise statistical comparisons were performed using ANOVA to compare the control and CPZ mice. Areas with significant latency differences are indicated by corresponding p values in pseudocolor. B, Averaged latency maps comparing the control and REC mice using the same pseudocolor representation and pixel-wise ANOVA analysis as shown in panel A. C, Line profiles of latency along a selected line are superimposed on the SL1-stim image, with data plotted for the control (black line), CPZ (red line), and REC (green line) mice, including the SEM. Statistically significant differences (p < 0.05) between the control and CPZ mice are indicated with red symbols, while significant differences between the control and REC mice are marked with green symbols above the corresponding line profile graphs. In all the panels, electrical stimulation was applied to the left hemisphere of the slices (ipsilateral side). n = 6–10 for each group.
Figure 5.
Figure 5.
Myelin staining of slices used in VSDI experiments using FMG. A, FMG fluorescent images of the CC areas in slices SL1–SL4 for control, CPZ, and REC mice. The images depict myelin content in each group, with reduced fluorescence indicating demyelination. Scale bar, 200 µm. B, Box plots representing the normalized myelin area stained with FMG across the control, CPZ, and REC mice. Data are presented as black (control), red (CPZ), and green (REC). Significant differences are indicated (p < 0.01). n = 4–6 for each group.
Figure 6.
Figure 6.
Myelin staining of slices used in VSDI experiments using PLP antibody. A, PLP antibody fluorescent staining of slices used for VSDI experiments, targeting the dorsal motor cortex and ventral cortex (cg2 of the ACC) across slices SL1–SL4 in control, CPZ, and REC mice. Stained areas indicate the presence of myelin, with reduced staining suggesting demyelination. Scale bar, 200 µm (cortex), 100 µm (cg2). B, The box plot representing the normalized area of fluorescence in the regions of interest (ROI, indicated by square boxes in panel A). Data for control (black), CPZ (red), and REC (green) mice are shown, with significance levels indicated by *p < 0.05; **p < 0.01. n = 4–6 for each group.

Similar articles

References

    1. Aboitiz F, Montiel J (2003) One hundred million years of interhemispheric communication: the history of the corpus callosum. Braz J Med Biol Res 36:409–420. 10.1590/S0100-879X2003000400002 - DOI - PubMed
    1. Antic SD, Empson RM, Knöpfel T (2016) Voltage imaging to understand connections and functions of neuronal circuits. J Neurophysiol 116:135–152. 10.1152/jn.00226.2016 - DOI - PMC - PubMed
    1. Bando Y, Takakusaki K, Ito S, Terayama R, Kashiwayanagi M, Yoshida S (2008) Differential changes in axonal conduction following CNS demyelination in two mouse models. Eur J Neurosci 28:1731–1742. 10.1111/j.1460-9568.2008.06474.x - DOI - PubMed
    1. Cohen LB, Salzberg BM, Grinvald A (1978) Optical methods for monitoring neuron activity. Annu Rev Neurosci 1:171–182. 10.1146/annurev.ne.01.030178.001131 - DOI - PubMed
    1. Crawford DK, Mangiardi M, Tiwari-Woodruff SK (2009) Assaying the functional effects of demyelination and remyelination: revisiting field potential recordings. J Neurosci Methods 182:25–33. 10.1016/j.jneumeth.2009.05.013 - DOI - PubMed

MeSH terms

LinkOut - more resources