. 2025 Feb;12(8):e2414358.
doi: 10.1002/advs.202414358. Epub 2025 Jan 2.

ECSIT-X4 is Required for Preventing Pressure Overload-Induced Cardiac Hypertrophy via Regulating Mitochondrial STAT3

Affiliations

ECSIT-X4 is Required for Preventing Pressure Overload-Induced Cardiac Hypertrophy via Regulating Mitochondrial STAT3

Xia Lu et al. Adv Sci (Weinh). 2025 Feb.

Abstract

Mitochondrial dysfunction is a key factor in exacerbating pressure overload-induced cardiac hypertrophy and is linked to increased morbidity and mortality. ECSIT, a crucial adaptor for inflammation and mitochondrial function, has been reported to express multiple transcripts in various species and tissues, leading to distinct protein isoforms with diverse subcellular localizations and functions. However, whether an unknown ECSIT isoform exists in cardiac cells and its potential role in regulating mitochondrial function and pathological cardiac hypertrophy has remained unclear. This study identified a 42-kDa ECSIT isoform encoded by the transcript variant Ecsit-X4, which is highly expressed in the mitochondria of adult cardiomyocytes but down-regulated in hypertrophic human heart samples and TAC-treated mouse hearts. AAV9-mediated Ecsit-X4 gene therapy, administered either before or after TAC surgery, significantly attenuated cardiac hypertrophy. Cardiomyocyte-specific Ecsit deficiency worsened TAC-induced cardiac hypertrophy, while Ecsit-X4 compensation independently rescued hypertrophic phenotypes in EcsitcKO mice. Mechanistically, ECSIT-X4 localized to the mitochondria and interacted with STAT3, leading to increased STAT3 levels and enhanced serine 727 phosphorylation in cardiomyocyte mitochondria, thereby promoting strong mitochondrial bioenergetics. This study identified a novel transcript variant of ECSIT localized in the mitochondria of adult cardiomyocytes and highlights its potential as a therapeutic target for heart failure.

Keywords: ECSIT‐X4; STAT3; cardiac hypertrophy; mitochondria.


Conflict of interest statement

The authors declare no conflict of interest.

Figures
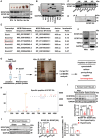
Figure 1
Figure 1
The ~42‐kDa ECSIT is encoded by transcript variant Ecsit‐X4 in adult cardiomyocytes and is down‐regulated in hypertrophic heart tissues. A) Representative Western blot of ECSIT protein expression and gross appearance of whole hearts in mouse hearts at different ages. n = 3 independent experiments. B) Representative Western blot of ECSIT protein in different organs of 8‐week‐old mice. Left ventricle (LV), Right ventricle (RV), Skeletal muscle (SM). n = 3 independent experiments. C) Representative Western blot showing ECSIT protein expression in heart tissues or cardiac cells derived from 8‐week‐old mice, 1‐ to 3‐day‐old neonatal mice, and 1‐ to 3‐day‐old neonatal rats. Adult mice (AM), Neonatal mice (NM), Neonatal rats (NR), Cardiomyocytes (CM), Cardiac fibroblasts (CF). n = 3 independent experiments. D) Molecular weight and pI of ECSIT were detected by 2‐DE. n = 1 independent experiment. E) Five predicted Ecsit transcript variants (Ecsit‐X2, Ecsit‐X4, Ecsit‐X5, Ecsit‐X6, Ecsit‐X7) from the NCBI database (ID: 26940) and the pI of each protein are shown in the table. The pI of each protein was obtained from https://web.expasy.org/protparam/. F) ECSIT protein levels in mitochondrial and cytoplasmic lysates extracted from the hearts of adult wild‐type mice (8 weeks old). n = 3 independent experiments. G) Mitochondrial protein lysates isolated from the hearts of 8‐week‐old adult mice were incubated with either anti‐ECSIT or anti‐IgG antibody, followed by electrophoresis and silver staining. The gel corresponding to the ≈42‐kDa band was then excised for LC‐MS/MS analysis, and five peptide sequences of ECSIT‐X4 were found in the immunocomplex. n = 1 independent experiment. H) LC‐MS scans of the specific peptide sequence “tsmawagrttrmr” matched Ecsit‐X4 encoded protein. n = 1 independent experiment. I) Representative Western blot and statistical results of ECSIT protein expression in non‐hypertrophic and hypertrophic human hearts. n = 4 or 8 samples per group. J) Male mice aged 8 weeks underwent either Sham or TAC surgery for 4 weeks. Representative Western blot and statistical results of ECSIT protein expression in Sham‐ or TAC‐treated mouse hearts were shown. n = 4 or 7 mice per group. K) The mRNA level of Ecsit‐X4 in Sham‐ or TAC‐treated mouse hearts. It was normalized to HPRT. n = 4 mice per group. Data were presented as mean ± SD, p‐values were determined by unpaired t‐test. p < 0.05 was considered statistically significant.
Figure 2
Figure 2
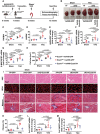
Ecsit‐X4 gene delivery before or after TAC attenuates pressure overload‐induced pathological cardiac hypertrophy. A) Treatment regimen. B) Representative gross appearance of whole hearts. Scale bar = 1 mm. C,D) The ratios of HW/BW and LW/BW were calculated. heart weight (HW), body weight (BW), lung weight (LW). E) The mRNA levels of ANP, BNP, and β‐MHC. All were normalized to HPRT. Atrial natriuretic peptide (ANP), Brain natriuretic peptide (BNP), and β‐myosin heavy chain (β‐MHC). F) Hematoxylin and eosin (H&E) and Wheat germ agglutinin (WGA) staining were performed to detect cardiomyocyte cross‐sectional area. Statistical result of cell size was presented. Scale bar = 40 µm. n = 6 mice per group. G) Treatment regimen. H) Representative gross appearance of whole hearts. Scale bar = 1 mm. I,J) The ratios of HW/BW and LW/BW were calculated. K) The mRNA levels of ANP, BNP, and β‐MHC. All were normalized to HPRT. L) Hematoxylin and eosin (H&E) and Wheat germ agglutinin (WGA) staining were performed to detect cardiomyocyte cross‐sectional area. Statistical result of cell size was presented. Scale bar = 40 µm. n = 8 mice per group. Data were presented as mean ± SD, p‐values were determined by one‐way ANOVA corrected by the post hoc Turkey's test. p < 0.05 was considered statistically significant.
Figure 3
Figure 3
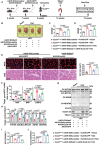
Compensation of Ecsit‐X4 alleviates TAC‐induced pathological cardiac hypertrophy in EcsitcKO mice. A) Treatment regimen. B) Representative gross appearance of whole hearts. Scale bar = 1 mm. C,D) The ratios of HW/BW and LW/BW. E–G) The mRNA expression of ANP, BNP, and β‐MHC. All were normalized to HPRT. H‐K) H&E, WGA staining, and Masson's trichrome staining were performed to detect cardiomyocyte cross‐sectional area and myocardial collagen in mouse hearts. Scale bar = 40 µm. Statistical results of cell size and fibrosis were shown in (H,K), respectively. L,M) The mRNA levels of Collagen I (Col 1) and Collagen III (Col 3). All were normalized to HPRT. n = 8 mice per group. Data were presented as mean ± SD, p‐values were determined by two‐way ANOVA corrected by the post hoc Turkey's test. p < 0.05 was considered statistically significant.
Figure 4
Figure 4
Overexpression of Ecsit‐X4 protects cardiomyocytes from Ang II‐induced hypertrophy. A) H9c2 cells transfected with Adv‐GFP or Adv‐Flag‐Ecsit‐X4 for 24 h before they were treated with Saline or Ang II (1 µm) for 48 h. Cardiomyocyte surface areas were analyzed by immunofluorescence staining with anti‐α‐actinin antibody (red) and DAPI (blue). Statistical result of cell surface areas was shown. Scale bar = 20 µm. n = 4 independent experiments. B) The mRNA levels of ANP, BNP, and β‐MHC in H9c2 cells. All were normalized to HPRT. n = 4 independent experiments. C) Neonatal mouse primary cardiomyocytes (NMCMs) isolated from Ecsitf/f mice were transfected with Adv‐GFP or Adv‐Cre for 12 h to delete the Ecsit gene (NMCM‐EcsitcKO), and then transfected with Adv‐GFP or Adv‐Flag‐Ecsit‐X4 for another 24 h. D) Representative Western blot and statistical result of ECSIT‐X4 and ~55‐kDa ECSIT were shown. n = 3 independent experiments. E, F) NMCM‐EcsitcKO were transfected with Adv‐GFP or Adv‐Flag‐Ecsit‐X4 for 24 h followed by Saline or Ang II stimulation for 48 h. Cardiomyocyte surface areas of NMCM‐EcsitcKO stained with α‐actinin (red) and DAPI (blue) were shown. Statistical result of cell surface areas was shown. Scale bar = 20 µm. n = 4 independent experiments. G) The mRNA levels of ANP, BNP, and β‐MHC in NMCM‐EcsitcKO. All were normalized to HPRT. n = 4 independent experiments. Data were presented as mean ± SD, p‐values were determined by one‐way ANOVA corrected by the post hoc Turkey's test. p < 0.05 was considered statistically significant.
Figure 5
Figure 5
Overexpression of Ecsit‐X4 enhances mitochondrial OXPHOS function in TAC‐induced hypertrophic mouse hearts and Ang II‐induced hypertrophic cardiomyocytes. A) Representative Western blot and statistical result of ECSIT‐X4 in myocardial mitochondria isolated from Sham‐ or TAC‐treated mouse hearts. n = 4 mice per group. B) NMCMs were transfected with Adv‐Flag‐Ecsit‐X4 for 24 h. Immunofluorescence staining with anti‐Flag antibody (green), mitochondria marker Mitotracker (red), and DAPI (blue). Scale bar = 40 µm. n = 3 independent experiments. C) Representative Western blot and statistical results of the ETC complex components in mouse hearts. n = 3 mice per group. D,E) Representative Western blots and statistical results of NDUFAF1, NDUFB8, and NDUFA13 in mitochondria of H9c2 cells. n = 3 independent experiments. F) The activity of mitochondrial complex I in H9c2 cells. n = 3 independent experiments. G) ATP content in H9c2 cells. n = 3 independent experiments. H) H9c2 cells were incubated with MitoSox. Fluorescence measurement was performed to detect mROS, and statistical result of relative MitoSox staining was shown. Scale bar = 40 µm. n = 3 independent experiments. I) Representative Western blot and statistical results of the ETC complex components in NMCM‐EcsitcKO. n = 4 independent experiments. J) The activity of mitochondrial complex I in NMCM‐EcsitcKO. n = 4 independent experiments. K) ATP content in NMCM‐EcsitcKO. n = 4 independent experiments. L) NMCM‐EcsitcKO were incubated with MitoSox. Fluorescence measurement was performed to detect mROS, and statistical result of relative MitoSox staining was shown. Scale bar = 40 µm. n = 4 independent experiments. Data were presented as mean ± SD, p‐values were determined by unpaired t‐test and one‐way ANOVA corrected by the post hoc Turkey's test. p < 0.05 was considered statistically significant.
Figure 6
Figure 6
ECSIT‐X4 interacts with STAT3 and enhanced its serine 727 phosphorylation in the mitochondria of hypertrophic cardiomyocytes. A) NMCMs were isolated from Ecsitf/f mice transfected with Adv‐Flag‐Ecsit‐X4. Mitochondria isolated from the NMCMs were lysed and immunoprecipitated with either anti‐IgG or anti‐Flag antibody. Flag‐labeled immunoprecipitates were visualized using Coomassie blue staining and subsequently subjected to LC‐MS/MS analysis to identify the target protein (STAT3), a mitochondrial complex I‐related protein that interacts with ECSIT‐X4. B) LC‐MS/MS fragment analysis of the specific peptide segment (AILSTKPPGTFLLR) of the STAT3 protein. The X‐axis represents the mass‐to‐charge ratio (m/z), while the Y‐axis represents signal intensity. Red line: b ions; blue lines: y ions; gray line: fragment ions. n = 1 independent experiments. C) The structure of ECSIT‐X4 protein was build using AlphaFold2, and the interaction between ECSIT‐X4 (blue) and STAT3 (yellow) was predicted by ZDOCK (version 3.0.2). Score = 1408.166. D) Interaction between ECSIT‐X4 and STAT3 was demonstrated by GST‐pull down. n = 3 independent experiments. E) HEK293T cells were transfected with expression plasmid encoding Flag‐ECSIT‐X4 for 24 h. Immunofluorescence staining with anti‐Flag antibody (green), mitochondria marker VDAC1 (red), and DAPI (blue). Scale bar = 20 µm. n = 3 independent experiments. F,G) HEK293T cells were co‐transduced with expression plasmid encoding FLAG‐ECSIT‐X4 and HA‐STAT3 for 36 h, and interaction between ECSIT‐X4 and STAT3 in mitochondria was determined by immunoprecipitation. n = 3 independent experiments. H) HEK293T cells were co‐transduced with expression plasmid encoding His‐STAT3 and FLAG‐ECSIT‐X4 or FLAG‐ΔECSIT‐X4 (mutant with 110–310 amino acid) for 36 h, and interaction between STAT3 and ECSIT‐X4 or ΔECSIT‐X4 in mitochondria was determined by immunoprecipitation. n = 3 independent experiments. I) Interaction between FLAG‐ECSIT‐X4 and endogenous STAT3 in mitochondria of H9c2 cells was determined by immunoprecipitation with anti‐Flag antibody followed by immunoblot with anti‐STAT3 antibody. n = 3 independent experiments. J) Representative Western blots and statistical results of total STAT3 and p (S727)‐STAT3 were shown. n = 3 independent experiments. K) Interaction between FLAG‐ECSIT‐X4 and endogenous STAT3 in the mitochondria of NMCM‐EcsitcKO is illustrated, along with representative Western blots and statistical results for total STAT3 and p (S727)‐STAT3. n = 4 independent experiments. Data were presented as mean ± SD, p‐values were determined by one‐way ANOVA corrected by the post hoc Turkey's test. p < 0.05 was considered statistically significant.
Figure 7
Figure 7
Overexpression of Ecsit‐X4 enhances mitochondrial OXPHOS function via STAT3 in hypertrophic cardiomyocytes. A) H9c2 cells were transfected with Adv‐Flag‐Ecsit‐X4 or Adv‐GFP for 24 h, and then were treated with 5 µm Stattic or dmso for 4 h before Saline or Ang II stimulation for 48 h. B) Representative Western blots and statistical results of p (S727)‐STAT3, t‐STAT3, NDUFAF1 and NDUFB8 in mitochondria were presented. n = 3 independent experiments. C) ATP content in H9c2 cells. n = 3 independent experiments. D) H9c2 cells incubated with MitoSOX. Fluorescence measurement was performed to detect mROS, and statistical result of relative MitoSOX staining was shown. Scale bar = 40 µm. n = 3 independent experiments. E) NMCMs were transfected with Si‐Scramble or Si‐Stat3 for 24 h, and then were transfected with Adv‐Flag‐Ecsit‐X4 or Adv‐GFP for 24 h before Saline or Ang II stimulation for 48 h. F) Representative Western blots and statistical results of p (S727)‐STAT3, t‐STAT3 and ETC complex components in mitochondria were presented. n = 4 independent experiments. G) ATP content in NMCMs. n = 4 independent experiments. H,I) NMCMs incubated with MitoSox, and mROS was detected by fluorescence measurement. Statistical result of relative MitoSox staining was shown. Scale bar = 40 µm. n = 4 independent experiments. Data were presented as mean ± SD, p‐values were determined by one‐way ANOVA corrected by the post hoc Turkey's test. p < 0.05 was considered statistically significant.
Figure 8
Figure 8
ECSIT‐X4 alleviates cardiac hypertrophy and enhances mitochondrial OXPHOS function through STAT3 in hypertrophic EcsitcKO mice. A) Treatment regimen. B) Representative gross appearance of whole hearts. Scale bar = 1 mm. C,D) The ratios of HW/BW and LW/BW. E) WGA and H&E staining were performed to detect cardiomyocyte cross‐sectional area in mouse hearts. Scale bar = 40µm. Statistical result of cell size was shown. F) The mRNA expression of ANP, BNP, and β‐MHC. All were normalized to HPRT. G–J) Representative Western blots and statistical results of STAT3, ECSIT‐X4, and ETC complex components in mitochondria were presented. n = 6 mice per group. Data were presented as mean ± SD, p‐values were determined by one‐way ANOVA corrected by the post hoc Turkey's test. p < 0.05 was considered statistically significant.

References

    1. Nakamura M., Sadoshima J., Nat. Rev. Cardiol. 2018, 15, 387. - PubMed
    1. Padmanabhan A., Alexanian M., Linares‐Saldana R., Gonzalez‐Teran B., Andreoletti G., Huang Y., Connolly A. J., Kim W., Hsu A., Duan Q., Winchester S. A. B., Felix F., Perez‐Bermejo J. A., Wang Q., Li L., Shah P. P., Haldar S. M., Jain R., Srivastava D., Circulation 2020, 142, 2338. - PMC - PubMed
    1. a) Lopaschuk G. D., Karwi Q. G., Tian R., Wende A. R., Abel E. D., Circ. Res. 2021, 128, 1487; - PMC - PubMed
    2. b) Kim S. Y., Zhang X., Schiattarella G. G., Altamirano F., Ramos T. A. R., French K. M., Jiang N., Szweda P. A., Evers B. M., May H. I., Luo X., Li H., Szweda L. I., Maracaja‐Coutinho V., Lavandero S., Gillette T. G., Hill J. A., Circulation 2020, 142, 2356. - PMC - PubMed
    1. Rosca M. G., Tandler B., Hoppel C. L., J. Mol. Cell. Cardiol. 2013, 55, 31. - PMC - PubMed
    1. Liu J., Wang C., Murakami Y., Gong G., Ishibashi Y., Prody C., Ochiai K., Bache R. J., Godinot C., Zhang J., Am. J. Physiol. Heart Circ. Physiol. 2001, 281, H1319. - PubMed

Substances

LinkOut - more resources