. 2025 Jan 3;14(1):32.
doi: 10.1038/s41377-024-01711-y.

Phasor-FSTM: a new paradigm for multicolor super-resolution imaging of living cells based on fluorescence modulation and lifetime multiplexing

Affiliations

Phasor-FSTM: a new paradigm for multicolor super-resolution imaging of living cells based on fluorescence modulation and lifetime multiplexing

Luwei Wang et al. Light Sci Appl. .

Abstract

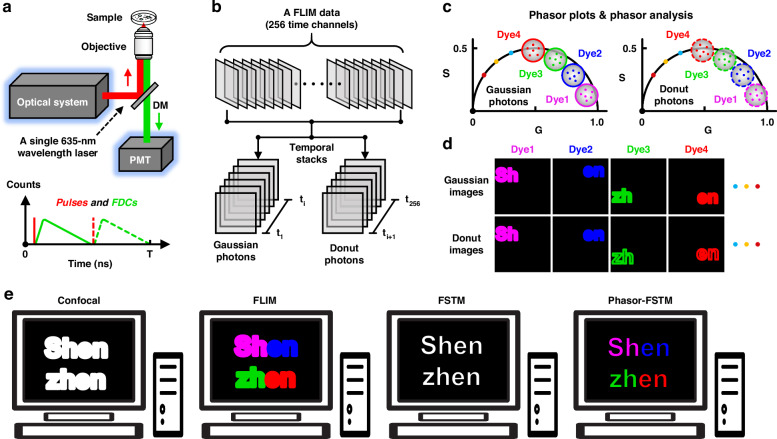
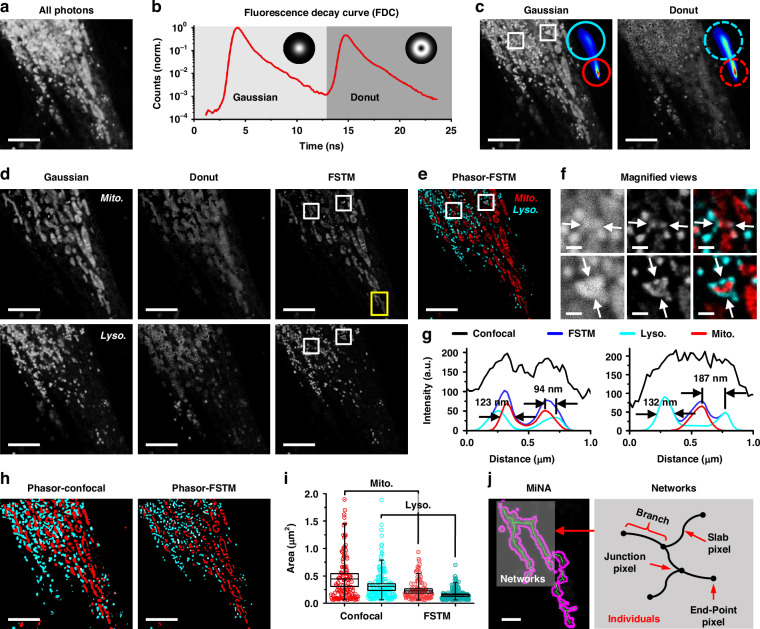
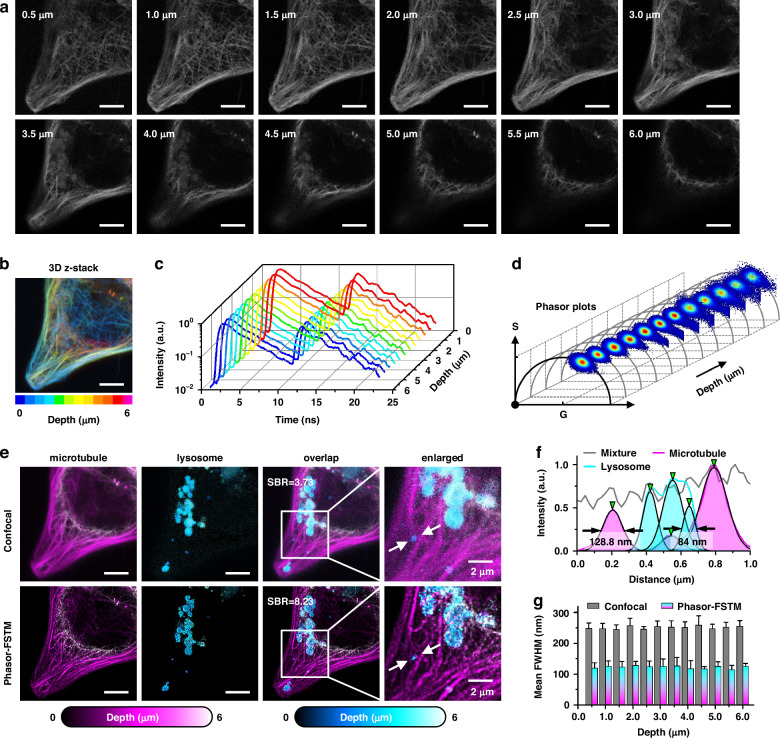
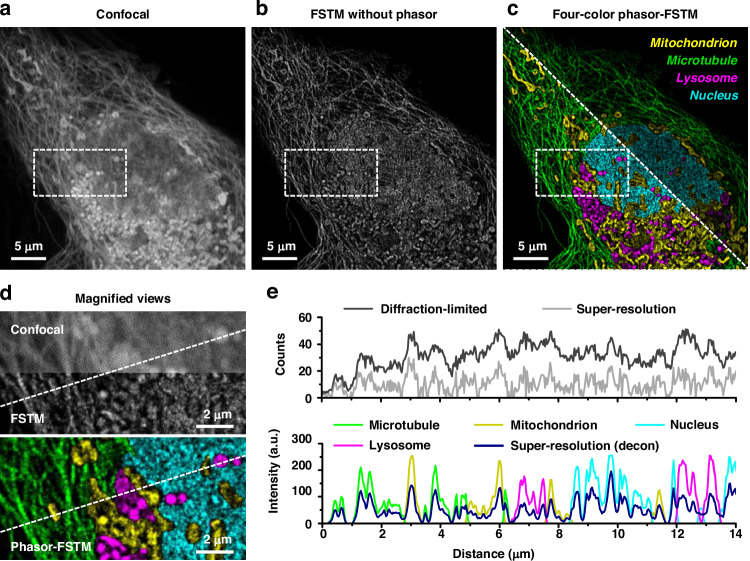
Multicolor microscopy and super-resolution optical microscopy are two widely used techniques that greatly enhance the ability to distinguish and resolve structures in cellular imaging. These methods have individually transformed cellular imaging by allowing detailed visualization of cellular and subcellular structures, as well as organelle interactions. However, integrating multicolor and super-resolution microscopy into a single method remains challenging due to issues like spectral overlap, crosstalk, photobleaching, phototoxicity, and technical complexity. These challenges arise from the conflicting requirements of using different fluorophores for multicolor labeling and fluorophores with specific properties for super-resolution imaging. We propose a novel multicolor super-resolution imaging method called phasor-based fluorescence spatiotemporal modulation (Phasor-FSTM). This method uses time-resolved detection to acquire spatiotemporal data from encoded photons, employs phasor analysis to simultaneously separate multiple components, and applies fluorescence modulation to create super-resolution images. Phasor-FSTM enables the identification of multiple structural components with greater spatial accuracy on an enhanced laser scanning confocal microscope using a single-wavelength laser. To demonstrate the capabilities of Phasor-FSTM, we performed two-color to four-color super-resolution imaging at a resolution of ~λ/5 and observed the interactions of organelles in live cells during continuous imaging for a duration of over 20 min. Our method stands out for its simplicity and adaptability, seamlessly fitting into existing laser scanning microscopes without requiring multiple laser lines for excitation, which also provides a new avenue for other super-resolution imaging technologies based on different principles to build multi-color imaging systems with the requirement of a lower budget.


Conflict of interest statement

Conflict of interest: The authors declare no competing interests.

Figures

Fig. 1
Fig. 1. Operating principle of Phasor-FSTM method.
a Schematic diagram of the optical system, and FLIM imaging in Phasor-FSTM mode. Pulses: Gaussian laser pulse (red solid line) and donut laser pulse (red dashed line); FDCs: Fluorescence decay curves; T: laser pulse period. b Separation of the FLIM data in time channels to obtain two datasets, each containing a complete fluorescence decay excited by the Gaussian and donut beams. c Separate phasor analysis on the two datasets to unmix the lifetime of each of the multiple components. d Spatial modulation to remove the diffraction-limited signals from Gaussian photons to achieve super-resolution. e Comparison of confocal, FLIM, FSTM, and Phasor-FSTM imaging. Confocal: diffraction-limited and structure indistinguishable; FLIM: diffraction-limited and structure distinguishable; FSTM: super-resolution and structure indistinguishable; Phasor-FSTM: super-resolution and structure distinguishable
Fig. 2
Fig. 2. Phasor-FSTM for two-color super-resolution imaging of a living HeLa cell.
a Intensity image of lysosomes and mitochondria composed of the photons in all time channels. b Fluorescence decay curve of the obtained FLIM image. c Gaussian and donut images obtained by temporal modulation. Inset: phasor plots and photon extraction using phasor analysis. d Intensity unmixing by phasor analysis to decompose the structures labeled with two dyes and excited with Gaussian and donut laser beams, and spatial modulation to achieve super-resolution (FSTM). e Phasor-FSTM (two-color super-resolution) image by overlapping two color-coded FSTM images in d. f Magnified views of the white squares in confocal, FSTM, and Phasor-FSTM images in ce. g Intensity profiles along the arrows in f. h Object identification using adaptive thresholding on the images of Phasor-Confocal and Phasor-FSTM. i 2D morphological analysis of mitochondria and lysosomes in confocal and FSTM images. Data are presented as the means ± SE. j Example of common mitochondrial network. Networks are mitochondrial structures with at last a single node and three branches. Scale bars, 5 μm (a, c–e, h) and 500 nm (f, j)
Fig. 3
Fig. 3. 3D z-stack images of lysosomes and microtubules.
a Unresolved confocal images at different imaging depths (z-step: 0.5 μm) in a HeLa cell. b 3D z-stack of confocal images in panel a before unmixing (different colors indicate different depths). c Fluorescence decay curves of the original FLIM data. d Phasor plots change with the imaging depth. e Comparison of two-color confocal and Phasor-FSTM in terms of 3D z-stack images. SBRs were calculated to demonstrate the improvement in image quality of the proposed method compared to confocal. f Normalized intensity profiles along the arrows in the enlarged images of e. g Mean FWHM values of the intensity profiles across the structures at five positions. Scale bars, 5 μm (a, b, e)
Fig. 4
Fig. 4. Phasor-FSTM for four-color super-resolution imaging in live cells.
a Confocal image of a single HeLa cell consisting of the mitochondrion (MitoTracker Deep Red FM), microtubule (Tubulin Tracker Deep Red), lysosome (LysoBrite NIR), and nucleus (Nuclear Red LCS1) structures. b FSTM image without the phasor process. c Four-color phasor-FSTM super-resolution images before (top right) and after (lower left) contrast adjustment. Mitochondrion: yellow; microtubule: green; lysosome: magenta; nucleus: cyan. d Magnified views of the white squares in a–c. e Photon number distributions in original diffraction-limited and super-resolution images, and intensity profiles in one-color and four-color super-resolution images post-deconvolution, plotted along the dotted lines in d
Fig. 5
Fig. 5. Phasor-FSTM monitors the interactions of mitochondria and lysosomes by long-term imaging of a live HeLa cell.
a Schematic of the process of the direct interactions between mitochondria and lysosomes. b A large field-of-view intensity image of mitochondria and lysosomes (without unmixing) at one time point during their mutual interactions. c–e Time-lapse phasor-FSTM images reveal different dynamic physical interactions between mitochondria and lysosomes in three marked regions in b. f Time-color-coded phasor-FSTM stack images in e (different colors indicate different imaging times). Magenta and green circles denote the moment when the lysosome pushes the mitochondria into maximum deformation. g Mean areas of mitochondrial and lysosomal structures in the three regions in 54 phasor-FSTM images. h Form factors of mitochondrial and lysosomal structures in the three regions in 54 phasor-FSTM images. Insets: Phasor-FSTM images of individual mitochondrion (bottom left) and lysosome (top right) and their adaptive threshold images with form factors of 2.945 and 1.255, respectively. i Branches and junctions of mitochondrial structure in the three regions in 54 phasor-FSTM images. Data are presented as the means ± SE. Scale bars, 2 μm (b) and 1 μm (cf, h)

References

    1. Lobingier, B. T. et al. An approach to spatiotemporally resolve protein interaction networks in living cells. Cell169, 350–360.e12 (2017). - PMC - PubMed
    1. Norregaard, K. et al. Manipulation and motion of organelles and single molecules in living cells. Chem. Rev.117, 4342–4375 (2017). - PubMed
    1. Huang, J. W. et al. The relevance of organelle interactions in cellular senescence. Theranostics12, 2445–2464 (2022). - PMC - PubMed
    1. Bückers, J. et al. Simultaneous multi-lifetime multi-color STED imaging for colocalization analyses. Opt. Express19, 3130–3143 (2011). - PubMed
    1. Wang, J. R. et al. Multi-color super-resolution imaging to study human coronavirus RNA during cellular infection. Cell Rep. Methods2, 100170 (2022). - PMC - PubMed

LinkOut - more resources