. 2025 Jan 2;16(1):138.
doi: 10.1038/s41467-024-55227-5.

STAT1 regulates immune-mediated intestinal stem cell proliferation and epithelial regeneration

Affiliations

STAT1 regulates immune-mediated intestinal stem cell proliferation and epithelial regeneration

Shuichiro Takashima et al. Nat Commun. .

Abstract

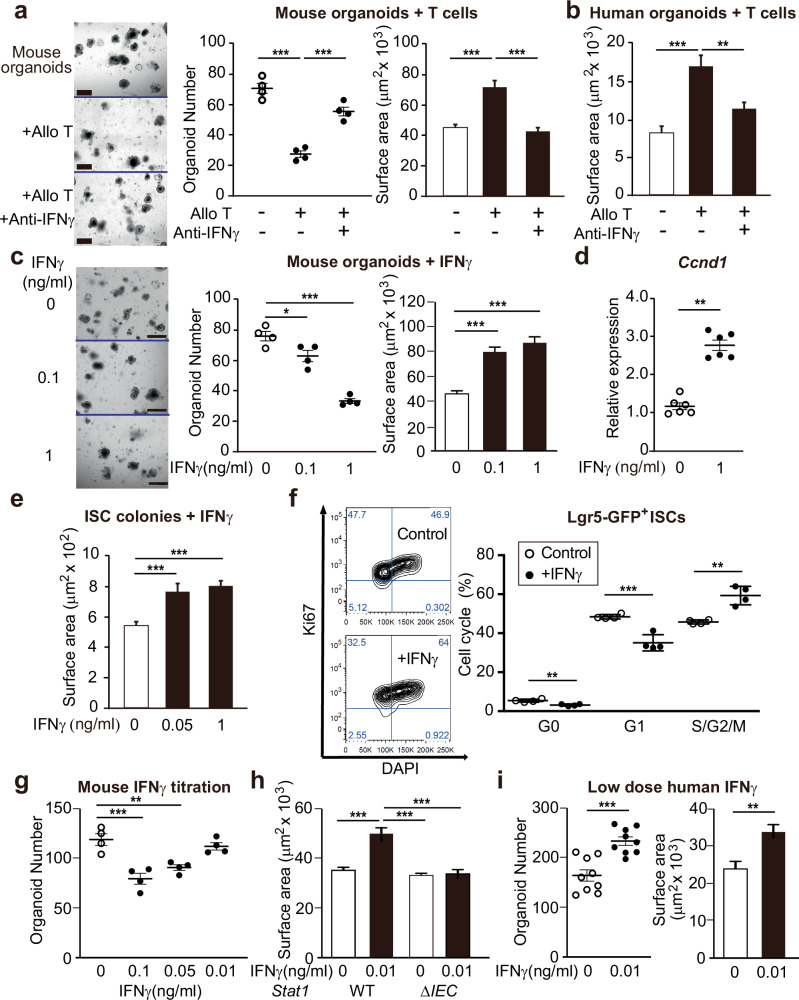
The role of the immune system in regulating tissue stem cells remains poorly understood, as does the relationship between immune-mediated tissue damage and regeneration. Graft vs. host disease (GVHD) occurring after allogeneic bone marrow transplantation (allo-BMT) involves immune-mediated damage to the intestinal epithelium and its stem cell compartment. To assess impacts of T-cell-driven injury on distinct epithelial constituents, we have performed single cell RNA sequencing on intestinal crypts following experimental BMT. Intestinal stem cells (ISCs) from GVHD mice have exhibited global transcriptomic changes associated with a substantial Interferon-γ response and upregulation of STAT1. To determine its role in crypt function, STAT1 has been deleted within murine intestinal epithelium. Following allo-BMT, STAT1 deficiency has resulted in reduced epithelial proliferation and impaired ISC recovery. Similarly, epithelial Interferon-γ receptor deletion has also attenuated proliferation and ISC recovery post-transplant. Investigating the mechanistic basis underlying this epithelial response, ISC STAT1 expression in GVHD has been found to correlate with upregulation of ISC c-Myc. Furthermore, activated T cells have stimulated Interferon-γ-dependent epithelial regeneration in co-cultured organoids, and Interferon-γ has directly induced STAT1-dependent c-Myc expression and ISC proliferation. These findings illustrate immunologic regulation of a core tissue stem cell program after damage and support a role for Interferon-γ as a direct contributor to epithelial regeneration.


Conflict of interest statement

Competing interests: The authors declare no competing financial interests. A.M.H. and C.A.L hold intellectual property related to Interleukin-22, and A.M.H. has a collaboration with Evive Biotechnology (Shanghai) Ltd, which supported a multicenter clinical trial studying use of Interleukin-22 in patients with GVHD. A.M.H. also serves in a volunteer capacity as a member of the Board of Directors of the American Society for Transplantation and Cellular Therapy (ASTCT).

Figures

Fig. 1
Fig. 1. Immune-mediated GI damage impacts the transcriptome of intestinal stem cells, upregulating STAT1 in GVHD.
a–d, f–h Single cell RNA sequencing (scRNA-seq) of freshly isolated ileal crypt cells from healthy B6 mice (Naive), B6-into-B6 syngeneic BMT recipients without GVHD (Syn), or B10.BR-into-B6 MHC-mismatched allogeneic BMT recipients with GVHD (Allo) 5 days after transplant. a Study design: Prior to scRNA-seq, BMT recipients were transplanted with both marrow and purified donor T cells following pre-transplant conditioning (TBI; 5.5 Gy x 2). b UMAP plots indicating the experimental conditions for sequenced cells (left) and distinct clusters with their cell type annotation (right). Star symbol indicates ISC clusters. c UMAP plots highlighting gene expression signatures corresponding to each cell type. d Phenotypic distances among epithelial populations. Heatmap shows average phenotypic distances between experimental conditions; histogram shows the distribution of phenotypic distances between non-GVHD and GVHD conditions (syn-BMT and allo-BMT) in units of log-normalized gene expression. e Phenotypic distances among epithelial populations from SI crypt scRNA-seq after LP-into-B6 MHC-matched (minor-antigen-mismatched) allo-BMT in units of log-normalized gene expression. Heatmap shows each population’s average phenotypic distance between homeostatic (Naive), non-GVHD T-cell-depleted transplant (BM), and GVHD-inducing BM + T cell transplant (BM + T); histogram shows the distribution of phenotypic distances between non-GVHD and GVHD transplant conditions (BM vs. BM + T). f GSEA comparing ISCs from syn-BMT and MHC-mismatched allo-BMT; NES: normalized enrichment score. g Volcano plot showing transcription factor genes differentially expressed (computed using MAST) in ISCs following syn-BMT and allo-BMT. Positive log fold change indicates increased expression after allo-BMT. h Expression of Stat1 in crypt epithelial populations highlighting upregulation in ISCs after allo-BMT; gene expression imputed using MAGIC (n = 3685 Naive, 3371 Syngeneic, 4670 Allogeneic cells); E enterocytes, EEC enteroendocrine cells, G goblet cells, I ISCs, P Paneth cells, T tuft cells. The boxplots represent three quartiles, and the whiskers indicate 1.5 times the interquartile range.
Fig. 2
Fig. 2. Intestinal deficiency of STAT1 or IFNγR both reduce epithelial proliferation post-transplant.
a–h Allogeneic B10.BR-into-B6 (Allo) or syngeneic B6-into-B6 (Syn) BMT using Stat1fl/flxVillin-Cre (Stat1ΔIEC) or Cre-negative Stat1fl/fl (Stat1WT) littermate controls. a Experimental design. b Survival curves; n = 3 Syn Stat1WT, 3 Syn Stat1ΔIEC, 15 Allo Stat1WT, 13 Allo Stat1ΔIEC mice; Log-rank-test (Allo Stat1WT vs Allo Stat1ΔIEC, p = 0.0034). c Body weight loss; n = 15 Stat1WT, 12 Stat1ΔIEC mice (p = 0.0179). d-e Representative staining (d) and quantification (e) of Ki67+ crypt cells, day 7 post-BMT (n = 168 Syn Stat1WT, 178 Syn Stat1ΔIEC, 426 Allo Stat1WT, 528 Allo Stat1ΔIEC crypts). f Ki67+ crypt cells 14 days post-BMT (n = 253 Allo Stat1WT, 408 Allo Stat1ΔIEC crypts). Representative staining (g) and quantification (h) of crypt Olfm4+ cells 14 days post-BMT (n = 388 Allo Stat1WT, 703 Allo Stat1ΔIEC crypts; scale bars = 50μm). i Analysis of crypt Ki67 immunohistochemistry after B10.BR-into-B6 or B6-into-B6 BMT using IFNαR-intact (WT) or IFNαR–/– knockout (KO) recipients (n = 98 Syn IFNαRWT, 86 Syn IFNαRKO, 83 Allo IFNαRWT, 61 Allo IFNαRKO crypts; Allo Ifnar1WT vs Allo Ifnar1ΔIEC, p = 0.9835). j–l Analyses after BMT into Ifngrfl/flxVillin-Cre (IFNγRΔEC) recipients or Cre-negative IFNγRfl/fl (IFNγRWT) littermate controls. j Analysis of crypt Ki67 immunohistochemistry after B10.BR-into-B6 or B6-into-B6 BMT (n = 175 Syn IFNγRWT, 106 Syn IFNγRΔIEC, 195 Allo IFNγRWT, 318 Allo IFNγRΔIEC crypts). Frequencies of crypt Ki67+ cells (k; n = 248 BM IFNγRWT, 351 BM + T IFNγRWT, 361 BM + T IFNγRΔIEC crypts) and frequencies of crypt Olfm4+ cells (l; n = 585 BM IFNγRWT, 978 BM + T IFNγRWT, 1053 BM + T IFNγRΔIEC crypts) 10 days after LP-into-B6 BMT with either donor marrow alone (BM) or marrow and T cells (BM + T). Panels (b, c, e, f, h, k, l) are combined from two independent experiments; (d, g, j) are representative of two independent experiments. Graphs indicate mean and s.e.m.; comparisons performed with two-tailed t tests (two groups) or one-way ANOVA multiple comparison testing (multiple groups); * p < 0.05, ** p < 0.01, *** p < 0.001. The exact p values are p < 0.001 unless specified otherwise.
Fig. 3
Fig. 3. T-cell-derived IFNγ induces STAT1-dependent epithelial regeneration.
a Representative images and quantification of B6 SI organoids co-cultured with allogeneic BALB/c T cells ± anti-IFNγ neutralizing antibodies; culture day 7; frequency: n = 4 wells/group; size: n = 152 (control), 64 ( + T cells), 114 ( + anti-IFNγ) organoids/group; scale bars = 500 μm. b Size of human SI organoids cultured 1:1 with human allogeneic T cells (500 single cells with 500 T cells) ± anti-IFNγ neutralizing antibodies; culture day 7; n = 75 (control), 107 ( + T cells), 99 ( + anti-IFNγ) organoids/group (T cells vs anti-IFNγ, p = 0.0011). c Representative images and quantification of SI organoids ± rmIFNγ for 7 days; n = 139 (0 ng/ml), 76 (0.1 ng/ml), 44 (1 ng/ml) organoids/group; scale bars = 500 μm (0 ng/ml vs 0.1 ng/ml, p = 0.0292). d Ccnd1 qPCR of mouse SI organoids ± rmIFNγ for 24 h; n = 6 wells/group; two-tailed Mann–Whitney analysis (p = 0.0022). e Size of SI ISC colonies ± rmIFNγ for 3 days; n = 69 (0 ng/ml), 31 (0.1 ng/ml), 73 (1 ng/ml) colonies/group. f Cell-cycle analysis of Lgr5-GFPhigh cells in SI organoids ± rmIFNγ (0.1 ng/ml) for 24 h; n = 4 wells/group (Control vs rmIFNγ, p = 0.0030 for G0; p = 0.0014 for S/G2/M). g Number of SI organoids +/- decreasing concentrations of IFNγ (culture day 5, n = 4 wells/group; 0 ng/ml vs 0.05 ng/ml, p = 0.0053). h Size of Stat1WT or Stat1ΔIEC B6 SI organoids ± “low dose” IFNγ [culture day 5; n = 132 (Stat1WT), 110 (WT + IFNγ), 112 (Stat1ΔIEC), 95 (ΔIEC + IFNγ) organoids/group]. i Quantification of human duodenal organoids +/- “low dose” IFNγ; culture day 7; frequency: n = 9 wells/group; size: n = 100 (0 ng/ml), 144 (0.01 ng/ml) organoids/group, p = 0.0011. Graphs indicate mean and s.e.m.; comparisons performed with two-tailed t tests (two groups) or one-way ANOVA multiple comparison testing (multiple groups), unless stated otherwise; ** p < 0.01, *** p < 0.001. The exact p values are p < 0.001 unless specified otherwise. Data are representative of five (a), two (be, gi), or three (f) independent experiments.
Fig. 4
Fig. 4. Myc expression is elevated in crypt stem cells after allogeneic BMT.
a–d Single cell RNA sequencing of small intestine crypt cells from healthy B6 mice (Naive) or five days after B6-into-B6 syngeneic or B10.BR-into-B6 allogeneic BMT. a GSEA of ISC cluster genes filtered for differential correlation with Stat1 expression in ISCs from syngeneic and allogeneic BMT recipients; NES: normalized enrichment score. b Myc expression in crypt epithelial populations, highlighting Myc upregulation in ISCs after allo-BMT; gene expression imputed using MAGIC; (n = 3685 Naive, 3371 Syngeneic, 4670 Allogeneic cells); E: enterocytes, EEC: enteroendocrine cells, G: goblet cells, I: ISCs, P: Paneth cells, T: tuft cells. The boxplots represent three quartiles, and the whiskers indicate 1.5 times the interquartile range. c Correlation of Myc expression with expression of IFNγ-responsive genes or with expression of Stat1 in ISCs during homeostasis and after syngeneic or allogeneic BMT. d Correlation between average MAGIC-imputed expression of Myc target genes (Hallmark MYC_v1 and v2 pathways) and average imputed cell-cycle-related genes (KEGG cell cycle pathway) in ISCs after allogeneic BMT. The plot shows average gene expression (2nd–98th percentiles). e-f Imaging of full-thickness ileum by 3-D whole mount microscopy four days after B10.BR-into-B6 allogeneic BMT using either TCD BM alone, which does not result in GVHD, or BM and T cells, resulting in GVHD. Shown are 2-D optical slices of the ISC compartment in the lower crypt region (e) or the very base of the crypt (f) from 3-D fluorescent imaging performed after staining with anti-c-Myc (green), anti-Olfm4 (orange glow), and DAPI (blue). Arrows indicate c-Myc+Olfm4+ ISCs; scale bar: 25 μm.
Fig. 5
Fig. 5. Myc is required for IFNγ-induced epithelial regeneration.
a, b Single cell RNA sequencing of B6 small intestine organoids after exposure to IFNγ; E: enterocytes, EEC: enteroendocrine cells, P/G: Paneth/goblet cells, I: ISCs, T: tuft cells. a UMAP plots indicating the experimental culture conditions and showing the cell type annotations for each cluster. Star symbol indicates ISC clusters. b Myc expression: n = 4599 (Ctrl), 3166 (6 h), 4533 (24 h), 6353 (48 h) cells. The boxplots represent three quartiles, and the whiskers indicate 1.5 times the interquartile range. qPCR analysis of mouse organoids (c, n = 6 wells/group) or ISC colonies (d, n = 4 wells/group) ± IFNγ (1 ng/ml) for gene expression of Irf1 (d, 0 vs 3 h, p = 0.0360), Myc (c, 3 vs 9 h, p = 0.0045; d, 0 vs 3 h, p = 0.0227), Axin2, and Ccnd1 (d, 0 vs 6 h, p = 0.0286; 0 vs 9 h, p = 0.0451); Kruskal-Wallis multiple comparison testing. e qPCR analysis of human organoids ± 6 h exposure to IFNγ (n = 3 donors/group); Friedman-tests; 0 vs 1 ng/ml, p = 0.0429 for IRF1; p = 0.0429 for MYC; p = 0.0429 for AXIN2; p = 0.0429 for CCND1. Representative images (f) and quantification (g) of mouse organoids ± 10058-F4 (μM); culture day 4; frequency: n = 4 wells/group; size: n = 353 (0), 395 (60), 352 (100), 0 (400) organoids/group; one-way ANOVA multiple comparison testing; 60 vs 100 μM, p = 0.0089. Representative images (h) and quantification (i) of mouse organoids ± IFNγ (ng/ml) ± 10058-F4 (60μM); culture day 4; n = 251 (No IFNγ), 236 (10058-F4), 231 (IFNγ 0.01), 238 (IFNγ 0.01 + 10058-F4), 228 (IFNγ 0.1), 223 (IFNγ 0.1 + 10058-F4) organoids/group; one-way ANOVA multiple comparison testing; No IFNγ vs 10058-F4, p = 0.1087. j qPCR for Ccnd1 gene expression in mouse organoids ± IFNγ + /− 10058-F4 for 6 h; n = 6 wells/group; Kruskal-Wallis multiple comparison testing; No IFNγ vs 0.1 ng/ml, p = 0.0197; IFNγ 0.1 ng/ml + 10058-F4 60 vs 100 μM, p = 0.0197. Graphs indicate mean and s.e.m.; * p < 0.05, ** p < 0.01, *** p < 0.001. The exact p values are p < 0.001 unless specified otherwise. Scale bars = 500 μm. Panels (c, d, f–g) are representative of two independent experiments.
Fig. 6
Fig. 6. STAT1 regulates epithelial Myc expression in immune-mediated GI damage.
a Diagram of the Myc gene locus (NCBI Refseq) with mapping of the genome location, ATAC-seq peaks (blue) from sorted Lgr5GFP ISCs (GSE83394), ENCODE (Accession EM10E0600598) candidate cis-regulatory elements (cCREs) indicating a proximal enhancer (black) and promoter regions (gray), and location of primers (red) used to detect STAT1 binding by qPCR following anti-STAT1 antibody and isotype control ChIP. b Δ% of input of anti-STAT1/isotype ChIP-qPCR of Irf1, Myc and negative control (NC) Foxp3 loci performed on ISC colonies treated with IFNγ (3 h, 1 ng/ml). c Myc and Ccnd1 qPCR analysis of mouse Stat1WT or Stat1ΔIEC SI organoids cultured ± IFNγ (n = 6 wells/group); Stat1WT vs IFNγ, p = 0.0022 for both Myc and Ccnd1; Stat1ΔIEC vs IFNγ, p = 0.0649 for Myc, p = 0.1255 for Ccnd1; combined from two independent experiments. d, e Allogeneic B10.BR-into-B6 BMT using Stat1ΔIEC recipients or Stat1WT littermate control recipients. d qPCR analysis of SI crypts harvested day 7 post-BMT (n = 9 Stat1WT, 8 Stat1ΔIEC recipients; combined from two independent experiments). e Immunofluorescent staining and quantification of c-Myc (green) in ileum (day 5 post-BMT; n = 9 independent sections each from 3 Stat1WT and 3 Stat1ΔIEC recipients; scale bars = 20 μm; two-tailed t test). f Olfm4-Cre x RiboTag (Olfm4-Ribo) mice were treated intraperitoneally with 20μg IFNγ or PBS twice, 48 and 24 h prior to harvest, as well as tamoxifen 20 h prior to harvest. Hemagglutinin-labeled Olfm4+ ISC ribosomes were then isolated from small intestine, and qPCR was performed on the associated RNA transcripts; n = 7 mice/group; combined from three independent experiments. Graphs indicate mean and s.e.m.; comparisons performed with two-tailed Mann–Whitney unless otherwise specified; ** p < 0.01, *** p < 0.001. The exact p values are p < 0.001 unless specified otherwise.
Fig. 7
Fig. 7. Proposed schematic model of ISC Myc regulation.
While regulation of ISC Myc expression may be primarily Wnt-driven at baseline, we propose that there is additional STAT1-dependent regulation of Myc expression driven by IFNγ in the setting of GVHD.

References

    1. Sato, T. et al. Single Lgr5 stem cells build crypt-villus structures in vitro without a mesenchymal niche. Nature459, 262–265 (2009). - PubMed
    1. Barker, N. et al. Identification of stem cells in small intestine and colon by marker gene Lgr5. Nature449, 1003–1007 (2007). - PubMed
    1. van der Flier, L. G., Haegebarth, A., Stange, D. E., van de Wetering, M. & Clevers, H. OLFM4 is a robust marker for stem cells in human intestine and marks a subset of colorectal cancer cells. Gastroenterology137, 15–17 (2009). - PubMed
    1. Noah, T. K., Donahue, B. & Shroyer, N. F. Intestinal development and differentiation. Exp. Cell Res.317, 2702–2710 (2011). - PMC - PubMed
    1. Sato, T. et al. Paneth cells constitute the niche for Lgr5 stem cells in intestinal crypts. Nature469, 415–418 (2011). - PMC - PubMed

Publication types

MeSH terms