

Machine learning derived retinal pigment score from ophthalmic imaging shows ethnicity is not biology
- PMID: 39746957
- PMCID: PMC11696055
- DOI: 10.1038/s41467-024-55198-7
Machine learning derived retinal pigment score from ophthalmic imaging shows ethnicity is not biology
Abstract
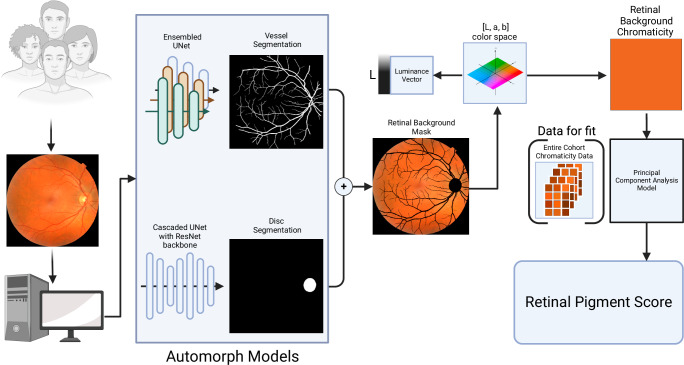
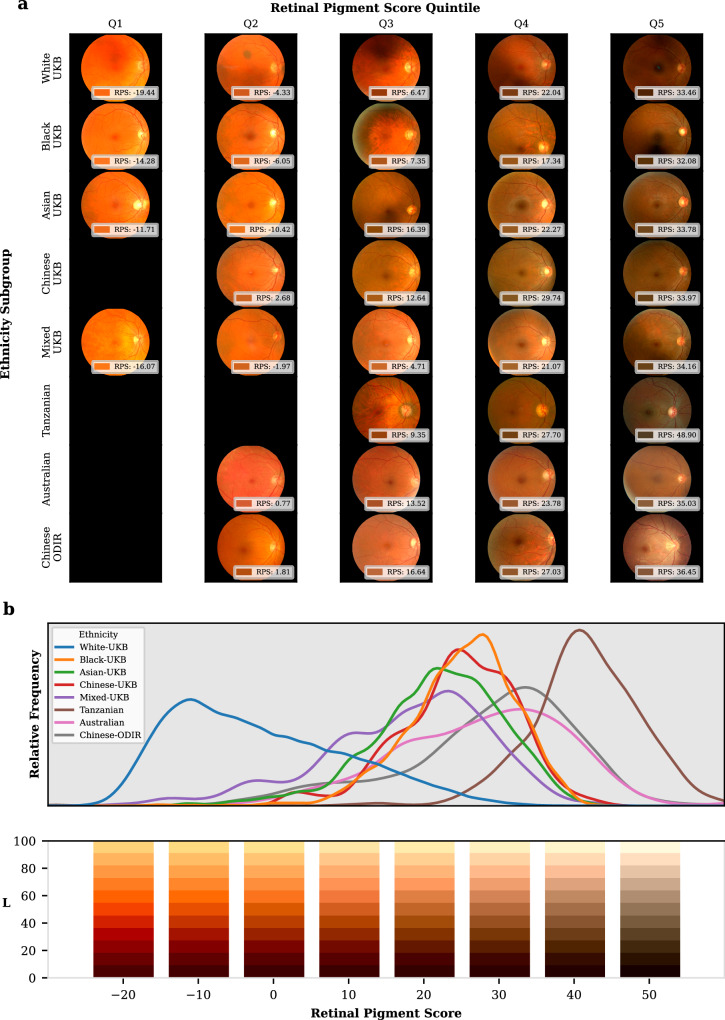
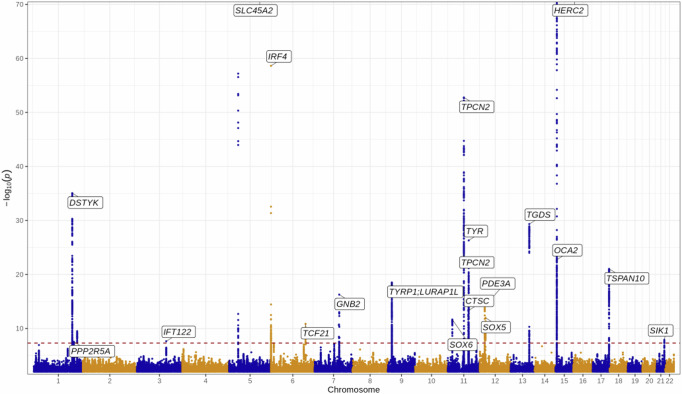
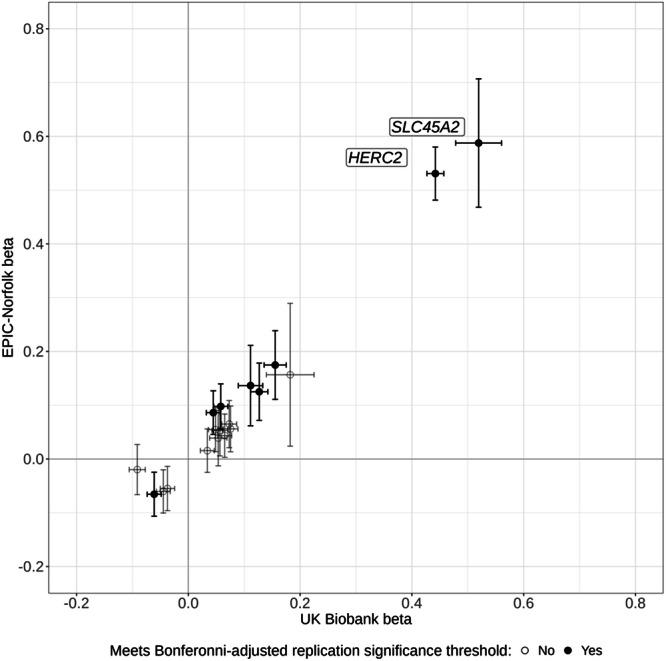
Few metrics exist to describe phenotypic diversity within ophthalmic imaging datasets, with researchers often using ethnicity as a surrogate marker for biological variability. We derived a continuous, measured metric, the retinal pigment score (RPS), that quantifies the degree of pigmentation from a colour fundus photograph of the eye. RPS was validated using two large epidemiological studies with demographic and genetic data (UK Biobank and EPIC-Norfolk Study) and reproduced in a Tanzanian, an Australian, and a Chinese dataset. A genome-wide association study (GWAS) of RPS from UK Biobank identified 20 loci with known associations with skin, iris and hair pigmentation, of which eight were replicated in the EPIC-Norfolk cohort. There was a strong association between RPS and ethnicity, however, there was substantial overlap between each ethnicity and the respective distributions of RPS scores. RPS decouples traditional demographic variables from clinical imaging characteristics. RPS may serve as a useful metric to quantify the diversity of the training, validation, and testing datasets used in the development of AI algorithms to ensure adequate inclusion and explainability of the model performance, critical in evaluating all currently deployed AI models. The code to derive RPS is publicly available at: https://github.com/uw-biomedical-ml/retinal-pigmentation-score .
© 2024. The Author(s).
Conflict of interest statement
Competing interests: A.P.K. has acted as a paid consultant or lecturer to Abbvie, Aerie, Allergan, Google Health, Heidelberg Engineering, Novartis, Reichert, Santen,Thea and Topcon. A.Y.L. reports support from the US Food and Drug Administration, grants from Santen, Carl Zeiss Meditec, and Novartis, personal fees from Genentech, Topcon, and Verana Health, outside of the submitted work; This article does not reflect the opinions of the Food and Drug Administration. A.T. report grants from Bayer and Novartis and personal fees from Abbvie, Allegro, Annexon, Apellis, Bayer, Heidelberg Engineering, Iveric Bio, Kanghong, Novartis, Oxurion, Roche/Genentech, Thea. C.E. reports personal fees from Heidelberg Engineering, Boehringer Ingelheim, and Inozyme pharmaceuticals outside of the submitted work. P.A.K. has acted as a consultant for Retina Consultants of America, Topcon, Roche, Boehringer-Ingleheim, and Bitfount and is an equity owner in Big Picture Medical. He has received speaker fees from Zeiss, Novartis, Gyroscope, Boehringer-Ingleheim, Apellis, Roche, Abbvie, Topcon, and Hakim Group. He has received travel support from Bayer, Topcon, and Roche. He has attended advisory boards for Topcon, Bayer, Boehringer-Ingleheim, RetinAI, and Novartis. P.J.F. has acted as a consultant for Alphasights, GLG, Google Health, Guidepoint, PwC, Santen. A.B. is Founder and CEO of not-for-profit Peek Vision and receives a salary. The remaining authors declare no competing interests.
Figures
Update of
-
Ethnicity is not biology: retinal pigment score to evaluate biological variability from ophthalmic imaging using machine learning.medRxiv [Preprint]. 2023 Jul 6:2023.06.28.23291873. doi: 10.1101/2023.06.28.23291873. medRxiv. 2023. Update in: Nat Commun. 2025 Jan 2;16(1):60. doi: 10.1038/s41467-024-55198-7. PMID: 37461664 Free PMC article. Updated. Preprint.
References
Publication types
MeSH terms
Grants and funding
LinkOut - more resources
Full Text Sources
