. 2025 Jan 2;16(1):285.
doi: 10.1038/s41467-024-55394-5.

Single-cell data reveal heterogeneity of investment in ribosomes across a bacterial population

Affiliations

Single-cell data reveal heterogeneity of investment in ribosomes across a bacterial population

Antrea Pavlou et al. Nat Commun. .

Abstract

Ribosomes are responsible for the synthesis of proteins, the major component of cellular biomass. Classical experiments have established a linear relationship between the fraction of resources invested in ribosomal proteins and the rate of balanced growth of a microbial population. Very little is known, however, about how the investment in ribosomes varies over individual cells in a population. We therefore extended the study of ribosomal resource allocation from populations to single cells, using a combination of time-lapse fluorescence microscopy and statistical inference. We found a large variability of ribosome concentrations and growth rates in conditions of balanced growth of the model bacterium Escherichia coli in a given medium, which cannot be accounted for by the population-level growth law. A large variability in the allocation of resources to ribosomes was also found during the transition of the bacteria from a poor to a rich growth medium. While some cells immediately adapt their ribosome synthesis rate to the new environment, others do so only gradually. Our results thus reveal a range of strategies for investing resources in the molecular machines at the heart of cellular self-replication. This raises the fundamental question whether the observed variability is an intrinsic consequence of the stochastic nature of the underlying biochemical processes or whether it improves the fitness of Escherichia coli in its natural environment.


Conflict of interest statement

Competing interests: The authors declare no competing interests.

Figures

Fig. 1
Fig. 1. Measured and estimated quantities in mother machine experiments with a ribosomal reporter strain.
A Schematic outline of the mother machine and the use of fluorescence microscopy to quantify cell length and fluorescence intensity over time. The fluorescence intensities of a cell reported in the text are the means of the intensities of pixels in the segmented cell area. B, C Cell length in log scale (orange dots) and green fluorescence intensity (green dots) of individual bacteria of the Rib strain, carrying a fusion of the ribosomal subunit S2 and the green fluorescent protein GFPmut2. The experiment consisted in several consecutive upshifts and downshifts (vertical dashed lines) between minimal medium with glucose (glc) or acetate (ace). D, E Cell length and fluorescence intensity measurements were used to estimate time-varying growth rates and ribosome synthesis rates, respectively, using appropriate statistical inference methods (Methods). The gray solid curves in panels B and C represent the fits of the single-cell data obtained from the inference methods. The black dashed curves in D and E represent the corresponding estimates of the growth rate μ(t) and the ribosome synthesis rate vr(t) for this same mother cell. Blue and green solid curves represent the mean of the estimates over all cells considered in the experiment and confidence intervals are given as the standard deviation. The blue dashed lines in (D) represent the mean growth rates over all mother cells over the entire duration of the experiment (0.27 h−1 for acetate and 0.79 h−1 for glucose). Source data are provided as a Source Data file.
Fig. 2
Fig. 2. Inference procedures for estimating growth rates and ribosome synthesis rates from single-cell data.
Time-lapse measurements of the length of mother cells are used as input by the growth-rate estimation method, returning time-varying estimates of the growth rate μ(t). The growth rate estimates μ^(t), along with time-lapse average fluorescence intensity measurements corresponding to overall intracellular ribosomal concentrations, are then used for the estimation of single-cell ribosome synthesis rates vr(t). The two estimation methods rely on regularization to cope with measurement noise and return smoothed estimates. This requires values for the regularization parameters (λ^ and σ^, θ^) which are estimated for each experiment to account for possibly different experimental conditions, machine settings, etc. (Methods and Supplementary Note 2).
Fig. 3
Fig. 3. Investment in ribosomes on the single-cell level during balanced growth.
A Verification of balanced growth conditions for selected data from the microfluidics experiment in Fig. 1. Each cross corresponds to the computed values of μ + γ and vr/r for an individual generation of an individual mother cell of the Rib strain growing on acetate (red) or on glucose (blue) for at least five generations. The data points are concentrated around the diagonal (R2 = 0.94), indicating that the method is capable of reproducing the expected relationship between the quantities during balanced growth. B Relation between the mean of the growth rates μ and the mean of the total ribosome concentrations r for the balanced growth dataset from panel A (filled circles). The microfluidics data are compared with population-level measurements for the same strain growing in batch on glucose, acetate, or other carbon sources (open circles) (Fig. S2). Data points for acetate are colored in red, for glucose in blue, and for other carbon sources in gray. In order to make the two data sets comparable, all ribosome concentrations were normalized by the mean of the ribosome concentrations for glucose and acetate. A line was fitted to the batch data and plotted as a visual aid. Each point is the mean of 5 replicates and confidence intervals are given by two times the standard error of the mean. The growth rates and the relative ribosome concentrations during growth on glucose and acetate agree between the batch growth and microfluidics datasets. C Relation between ribosome concentrations and growth rates of individual generations of individual cells from the balanced growth dataset from panel A (data points for acetate in red, data points for glucose in blue). While the line fitted to the data in panel B, shown for reference, captures the global trend in the data (R2 = 0.64), the variability of single-cell ribosome concentrations is important. D As in panel C, but after discretizing the data points for glucose and acetate into ten equal-sized bins. Within each growth condition, the ribosome concentration across individual cells weakly depends on growth rate, as quantified by the slope of the straight line fitted to the binning points (0.56 ± 0.06 for glucose and 0.22 ± 0.08 for acetate), which is much smaller than the slope of the growth law in panel B (1.2 ± 0.04). Source data are provided as a Source Data file.
Fig. 4
Fig. 4. Adaptation dynamics of investment in ribosomes after a nutrient upshift and downshift.
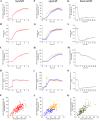
A–D Mean adaptation of the ribosome synthesis rate vr(t), growth rate μ(t), ribosome concentration r(t), and ribosome synthesis activity vr(t)/r(t) after an acetate-glucose upshift applied to the Rib strain growing in a mother machine (Fig. 1). The above quantities were estimated from the data for different mother cells using the inference methods of Fig. 2 and averaged over 129 cells. The time-courses show a distinct jump in ribosome synthesis rate, growth rate, and ribosome synthesis activity directly after the upshift. E Correlation of the single-cell ribosome synthesis rates and growth rates (red dots), averaged over the first two hours after the upshift. The Pearson correlation coefficient ρ equals 0.75. F–I Clustering of the single-cell ribosome synthesis rates after the upshift using k-means (Methods) illustrates the different behavior of faster adapters (orange, 77 cells) and slower adapters (blue, 52 cells). Faster adapters have a significantly higher ribosome concentration before (and after) the upshift (Fig. S15). J Like in panel E, but indicating the cells included in the cluster of faster (orange) and slower (blue) adapters. KN As in panel A-D, but for a glucose-acetate downshift carried out in the same experiment (130 cells). The average adaptation time-course displays an undershoot of the ribosome synthesis rate, growth rate, and ribosome synthesis activity before settling at the steady-state value for growth on acetate, while the ribosome concentration decreases more gradually. O Correlation of the single-cell ribosome synthesis rates and growth rates (green dots), averaged over the first two hours after the downshift (ρ = 0.81). Confidence intervals in the above plots are given by two times the standard error of the mean. Source data are provided as a Source Data file.
Fig. 5
Fig. 5. Explanation for the occurrence of faster and slower adaptation of ribosome synthesis after a nutrient upshift.
Faster adapters have a higher ribosome concentration than slower adapters before the upshift from acetate to glucose (Fig. 4H). This presumably allows them to have a higher ribosome reserve, that is, a higher excess capacity that can be allocated to the synthesis of new ribosomes immediately after the upshift. This allows faster adapters to make a higher jump in ribosome synthesis rate after the upshift (Fig. 4F), and therefore growth rate (Fig. 4G). Supplementary Note 3 mathematically develops the above reasoning in the context of the model used for the inference and analysis of the ribosome synthesis rates.

Similar articles

Cited by

References

    1. Hwa, T. & Scott, M. Bacterial growth laws and their applications. Curr. Opin. Biotechnol.22, 559–565 (2011). - PMC - PubMed
    1. Jun, S., Si, F., Pugatch, R. & Scott, M. Fundamental principles in bacterial physiology - history, recent progress, and the future with focus on cell size control: A review. Rep. Prog. Phys.81, 056601 (2018). - PMC - PubMed
    1. Bruggeman, F. J., Planqué, R., Molenaar, D. & Teusink, B. Searching for principles of microbial physiology. FEMS Microbiol. Rev.44, 821–844 (2020). - PMC - PubMed
    1. Schaechter, M., Maaløe, O. & Kjeldgaard, O. N. Dependency on medium and temperature of cell size and chemical composition during balanced growth of Salmonella typhimurium. J. Gen. Microbiol. 19, 592–606 (1958). - PubMed
    1. Neidhardt, F. C. & Magasanik, B. Studies on the role of ribonucleic acid in the growth of bacteria. Biochim. Biophys. Acta42, 99–116 (1960). - PubMed

Publication types

MeSH terms

Substances

LinkOut - more resources