. 2025 Jan 2;16(1):28.
doi: 10.1038/s41467-024-55378-5.

Intratumor heterogeneity of EGFR expression mediates targeted therapy resistance and formation of drug tolerant microenvironment

Affiliations

Intratumor heterogeneity of EGFR expression mediates targeted therapy resistance and formation of drug tolerant microenvironment

Bassel Alsaed et al. Nat Commun. .

Abstract

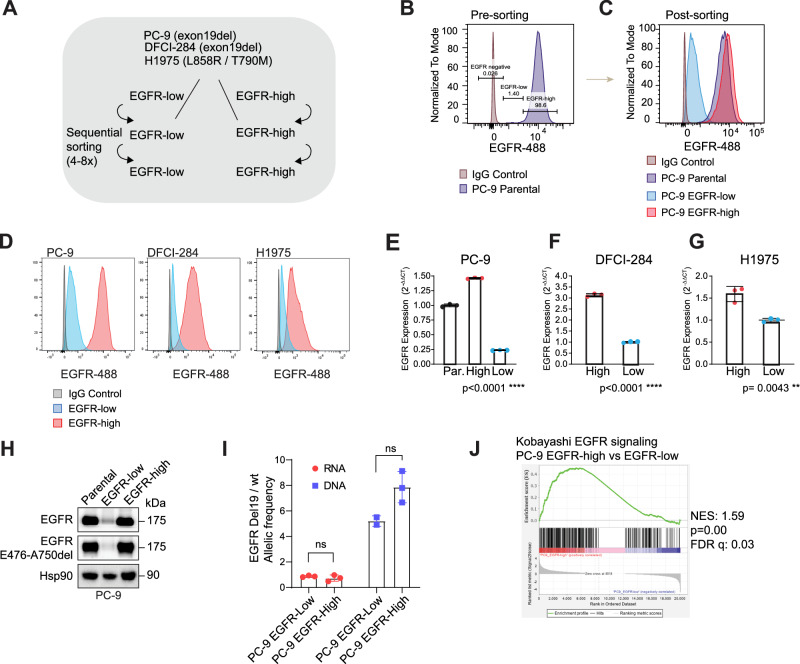
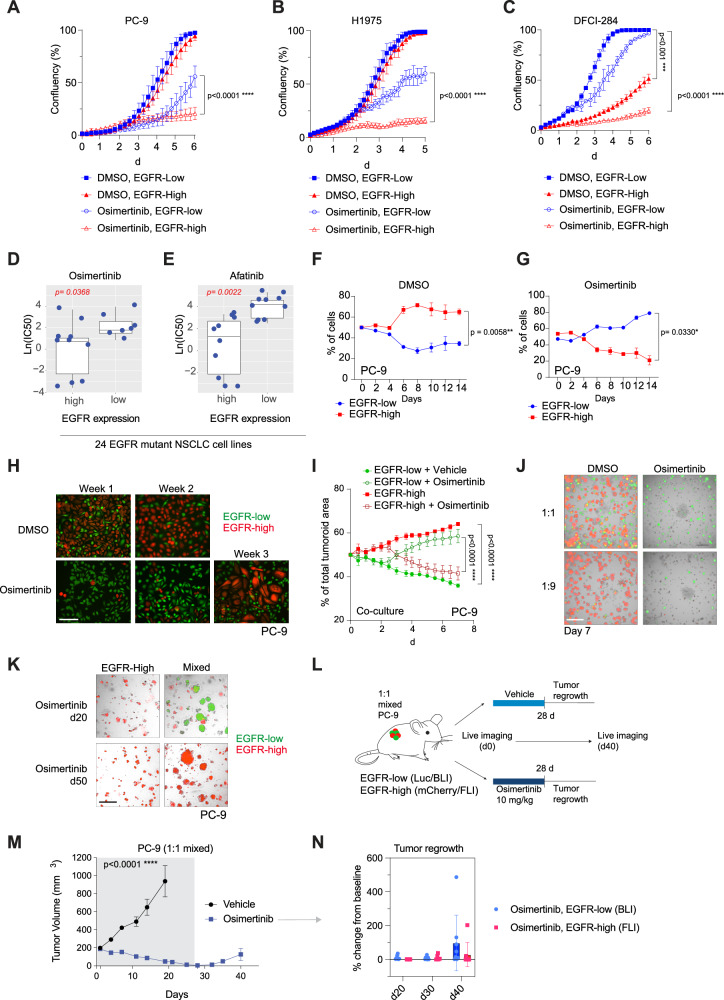
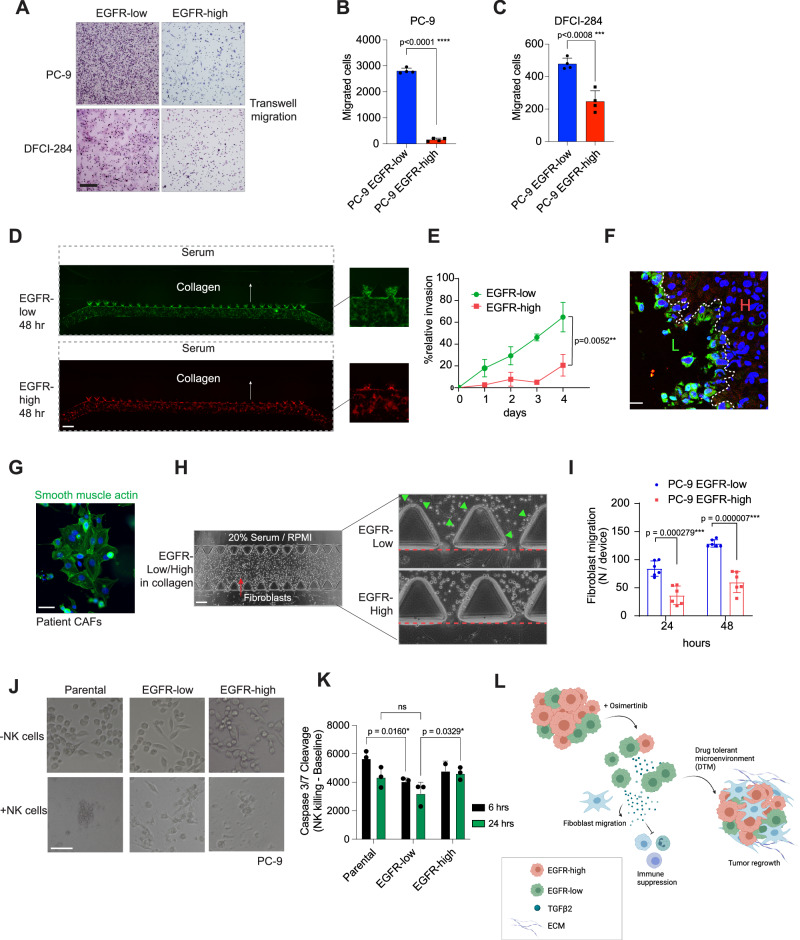
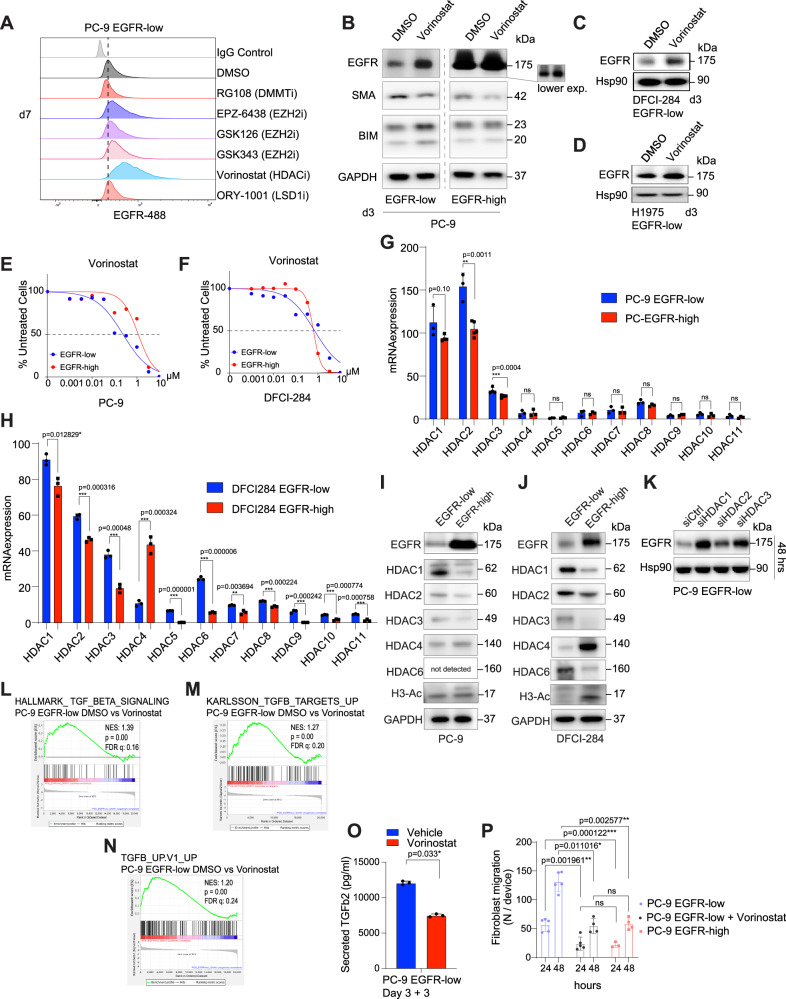
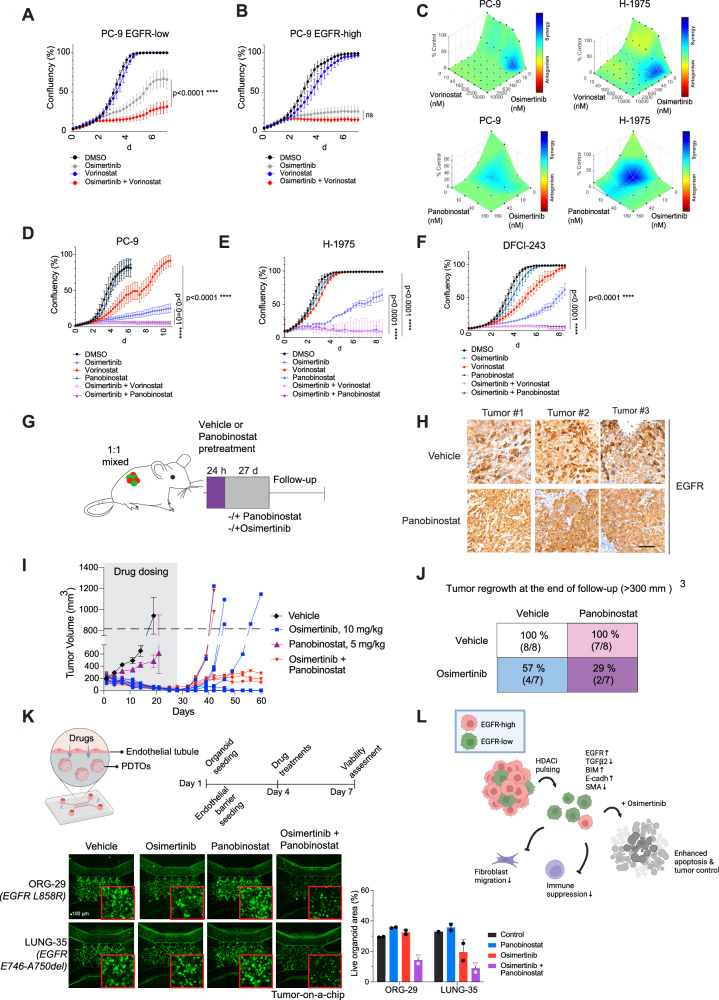
Epidermal growth factor receptor (EGFR) tyrosine kinase inhibitors are commonly used to treat non-small cell lung cancers with EGFR mutations, but drug resistance often emerges. Intratumor heterogeneity is a known cause of targeted therapy resistance and is considered a major factor in treatment failure. This study identifies clones of EGFR-mutant non-small cell lung tumors expressing low levels of both wild-type and mutant EGFR protein. These EGFR-low cells are intrinsically more tolerant to EGFR inhibitors, more invasive, and exhibit an epithelial-to-mesenchymal-like phenotype compared to their EGFR-high counterparts. The EGFR-low cells secrete Transforming growth factor beta (TGFβ) family cytokines, leading to increased recruitment of cancer-associated fibroblasts and immune suppression, thus contributing to the drug-tolerant tumor microenvironment. Notably, pharmacological induction of EGFR using epigenetic inhibitors sensitizes the resistant cells to EGFR inhibition. These findings suggest that intrinsic drug resistance can be prevented or reversed using combination therapies.


Conflict of interest statement

Competing interests: H.M.H. has been working within the past 3 years as a part-time Medical Advisor for Amgen AB. C.A. received research fees from Revolution Medicines, Aelin Therapeutics, Verastem, Roche and Boehringer-Ingelheim. P.A.J has consulting fees from AstraZeneca, Boehringer-Ingelheim, Pfizer, Roche/Genentech, Takeda Oncology, ACEA Biosciences, Eli Lilly and Company, Araxes Pharma, Ignyta, Mirati Therapeutics, Novartis, LOXO Oncology, Daiichi Sankyo, Sanofi Oncology, Voronoi, SFJ Pharmaceuticals, Takeda Oncology, Transcenta, Silicon Therapeutics, Syndax, Nuvalent, Bayer, Esai, Biocartis, Allorion Therapeutics, Accutar Biotech and Abbvie, Monte Rosa, Scorpion Therapeutics, Merus, Frontier Medicines, Hongyun Biotechnology and Duality; post-marketing royalties from DFCI owned intellectual property on EGFR mutations licensed to Lab Corp; sponsored research agreements with AstraZeneca, Daichi-Sankyo, PUMA, Boehringer Ingelheim, Eli Lilly and Company, Revolution Medicines and Astellas Pharmaceuticals; stock ownership in Gatekeeper Pharmaceuticals. B.N. is an inventor on patent applications related to the dTAG system (WO/2017/024318, WO/2017/024319, WO/2018/148440, WO/2018/148443, and WO/2020/146250). The Nabet laboratory receives or has received research funding from Mitsubishi Tanabe Pharma America, Inc. The remaining authors declare no competing interests.

Figures

Fig. 1
Fig. 1. Heterogenous expression of EGFR in EGFR-mutant NSCLC.
A Immunohistochemistry staining for total EGFR in patient-derived xenograft (PDX) tumors shows heterogeneous expression of EGFR. The upper row displays PDX models with distinct EGFR heterogeneity, whereas the lower row shows samples with dispersed staining patterns. The black dotted line in the upper row highlights the areas of differential EGFR expression. Scale bar is 100 μm. B Flow staining for membrane EGFR in selected PDX models. The plot shows viable single epithelial (EpCam + ) cells. IgG-488 was used as a negative control. C EGFR-low cells are positive for the cytokeratin 7 (CK7) epithelial marker. DAPI marks the nuclei. Scale bar is 100 μm. D Treatment-naïve patients’ tumors harbor heterogeneous regions for EGFR. Scale bar is 400 μm. E EGFR heterogeneity in 13 treatment-naive NSCLC patient samples. Heterogeneity was evaluated by a thoracic pathologist.
Fig. 2
Fig. 2. EGFR-mutant NSCLC cell lines display heterogeneity in EGFR.
A Sorting scheme. Three EGFR-mutant cell lines were sequentially sorted for total EGFR using a viability marker. B EGFR expression in parental PC-9 cells before sequential sorting. IgG-488 was used as a negative control. C EGFR expression in PC-9 parental versus EGFR-low and EGFR-high cell lines after 6 rounds of sequential sorting. IgG-488 was used as a negative control. D EGFR expression in all three cell lines after 6 rounds of sorting. IgG-488 was used as a negative control. EG EGFR mRNA expression in PC-9 / DFCI-284 / H1975, EGFR-high, and EGFR-low cell lines. N = 3 biologically independent experiments. H PC-9 EGFR-low and EGFR-high cells have differential expression on mutant EGFR. Western blot analysis showing total EGFR and EGFR E476-A750del expression. Hsp90 was used as a loading control. I PC-9 EGFR-low and EGFR-high cells have similar allelic frequencies. EGFRdel19 / EGFRwt allelic frequency in PC-9 EGFR-low versus PC-9 EGFR-high cells. Allelic frequency was measured both in RNA and DNA level. N = 3 biologically independent experiments. J PC-9 EGFR-high cells are enriched with EGFR signaling compared to the EGFR-low cells. Gene-set enrichment analysis (GSEA). Three biological replicates. Data in (E, F, G, I) are presented as mean ± SD and analyzed by an unpaired student’s t-test.
Fig. 3
Fig. 3. EGFR-low cells are tolerant to EGFR inhibition and enabling EGFR inhibitor resistance.
AC EGFR-low cells are tolerant to osimertinib. N = 3 biologically independent experiments. D Low EGFR expression is associated with poor EGFR inhibitor response. Osimertinib sensitivity in cell lines categorized by high or low EGFR mRNA expression. Each dot represents an individual EGFR-mutant NSCLC cell line. E Afatinib sensitivity in cell lines categorized by high or low EGFR mRNA expression. Each dot represents an individual EGFR-mutant NSCLC cell line. F, G EGFR-low cells are tolerant to osimertinib over time. Labelled EGFR-low and EGFR-high cells were mixed in 1:1 ratio, and the population ratios were followed-up over time using flow cytometry. N = 3 biologically independent experiments. (H) EGFR-low cells are intrinsically tolerant to osimertinib, but EGFR-high cells can regrow over time in mixed culture. 10 nM osimertinib was used. Scale bar is 1000 μm. I EGFR-low tumoroids are more tolerant to osimertinib over time. 1:1 mixture of EGFR-low:high cells was used and the cells were treated with vehicle or 10 nM osimertinib. N = 3 biologically independent experiments each consisting of three technical replicates. J EGFR-low cells are the initial cell type of resistance in 1:1 (low:high) and 1:9 (low:high) mixed cells. Cells were treated with vehicle DMSO or 10 nM Osimertinib in tumoroid culture. Scale bar is 400 μm. K EGFR-high cells can form drug resistance grow over time, but only in mixed cultured. Cells were treated with 10 nM osimertinib and followed over time. Scale bar is 250 μm. L Treatment scheme for PC-9 EGFR-low:high xenograft. 1:1 ratio of cells was grafted into mice, and after tumor formation the mice were treated with either vehicle or osimertinib for 14 days, after which the tumors were collected for analysis. (M, N) EGFR-low cells escape drug treatment earlier than EGFR-high cells. In vivo measurement of labelled EGFR-high (mCherry) and EGFR-low (Luciferase) cells in xenograft mice. Data dots represent individual mice, N = 8 mice per group. Data in (A, B, C, F, G, N) are presented as mean ± SD and as mean ± SEM in (M, I). Data were analyzed by two-way ANOVA, Tukey’s test in (A, B, C), by a paired student’s t test in (F, G), and by tow-way RM ANOVA in (I, M). N = 24 in (D, E).
Fig. 4
Fig. 4. EGFR-low cells exhibit increased TGFβ expression and secretion, leading to a more mesenchymal phenotype.
A Volcano plot comparing RNA sequencing data from PC-9 EGFR-high versus EGFR-low cells. The red circle highlights ITGB3. N = 3 biologically independent experiments. (B– EGFR-low cells express higher levels of ITGB3 and ITGAV mRNA in both PC-9 EGFR-low and DFCI-284 EGFR-low cells compared to the EGFR-high cells. N = 3 biologically independent experiments. F Schematic illustrating the activation mechanism of latent TGFβ. TGFβ is secreted by cells in a complex with LTBP, and excess TGFβ can be stored in the ECM. Heterodimerized αVβ3 integrins activate TGFβ from the ECM by inducing mechanical forces, after which the released TGFβ binds its receptors to activate downstream signaling. G, H RNA expression of TGFB1 and TGFB2 in PC-9/DFCI-284 EGFR-low and EGFR-high cells. TGFB3 was undetectable. N = 3 biologically independent experiments. I EGFR-low cells secrete more activated TGFβ2 than EGFR-high cells. Secretion of activated TGFβ2 was measured using ELISA. Medium was collected after 3 days of culture. Low: EGFR-low cell lines, High: EGFR-high cell lines. N = 3 biologically independent experiments. J Enrichment of TGFβ-signaling in PC-9 EGFR-low cells. GSEA with 3 biologically independent experiments. K EGFR-low cells exhibit a more EMT-like phenotype. Hsp90 was used as a loading control. L EGFR-low cells express more FN1 mRNA in all three cell lines. N = 3 biologically independent experiments. M PC-9 EGFR-low xenograft tumors are more positive for fibronectin 1 than EGFR-high tumors. Scale bar is 200 μm. N CRISPR-based knockout of ITGB3, FN1, or TGFB2 sensitizes EGFR-low cells to osimertinib. Cells were treated with vehicle DMSO or 10 nM osimertinib. N = 2 biologically independent experiments each consisting of four technical replicates. Data in (B, C, D, E, G, H, N) are presented as mean ± SD and as mean ± SEM in (I, L). Data were analyzed by one-way ANOVA, Dunnett’s test in (B, D, G), by a paired student’s t-test in (C, E, H), an unpaired student’s t-test in (I), and by two-way ANOVA in (L).
Fig. 5
Fig. 5. EGFR-low cells are more invasive and modulate the tumor microenvironment.
A EGFR-low cells show enhanced motility in a transwell migration assay. Migrated cells were stained with hematoxylin. Scale bar is 100 μm. B, C Quantification of the transwell migration assay. N = 3 biologically independent experiments. D Microfluidic invasion assay. PC-9 EGFR-low or EGFR-high cells were seeded into the proximal side channel of the microfluidic chip, and their invasion towards collagen was measured over time. Serum was added to the proximal side channel to attract the cells. Scale bar is 1000 μm. E Quantification of the microfluidic invasion assay. The y-axis indicates EGFR-low and EGFR-high cell invasion area within collagen in the middle channel. N = 3 biologically independent experiments. F EGFR-low cells reside in the invasive front of the PC-9 xenograft tumors. Distribution of EGFR-low vs EGFR-high cells in 1:1 grafted tumors. L: EGFR-low, H: EGFR-high. Scale bar is 50 μm. G SMA expression in patient tumor-derived CAFs. Scale bar is 30 μm. H Microfluidic fibroblast migration assay. Patient CAFs were seeded into the proximal side channel, and PC-9 EGFR-low or EGFR-high cells were seeded into the middle chamber. Serum was added to the proximal side channel to attract the cells. Fibroblasts that migrated into the channel are highlighted with green triangles. Scale bar is 1000 μm. I EGFR-low cells attract more fibroblasts. Quantification of the CAF migration assay. N = 3 technical replicates, representative experiment of 6 microfluidic chips. J NK cell killing in PC-9 parental, EGFR-low and EGFR-high cell lines. Scale bar is 100 μm. K EGFR-low cells are less sensitive to NK cell killing in two different time points. N = 3 biologically independent experiments. L Schematic of osimertinib resistance formation over time. EGFR-low cells are intrinsically more tolerant to EGFR inhibitor and can survive the initial drug insult better than EGFR-high cells. Surviving EGFR-low cells secrete more TGFβ, attract fibroblasts to the microenvironment and are more resistant to immune cell killing, enabling the regrowth of all the remaining tumor cells. Data in (B, C) are presented as mean ± SEM and as mean ± SD in (E, I, K). Data were analyzed by an unpaired student’s t-test in (B, C), by a paired student’s t-test in (I), by two-way ANOVA in (E), and by two-way ANOVA, Tukey’s test in (K).
Fig. 6
Fig. 6. EGFR expression can be modulated using epigenetic inhibitors.
A Epigenetic modulator screen for EGFR expression. Cells were treated with the modulators for 7 days, after which the membrane EGFR was measured in viable single cells. IC50 value of each drug was used. IgG control was used as a negative control. B Vorinostat upregulates EGFR, reduces SMA and induces BIM expression. GAPDH was used as a loading control. C, D EGFR expression is induced by vorinostat also in DFCI-284/H1975 EGFR-low cells. Hsp90 was used as a loading control. E, F EGFR-low cells are more sensitive to vorinostat treatment. G, H mRNA of different HDACs in PC-9/DFCI-284 EGFR-low vs EGFR-high cells. N = 3 biologically independent experiments. I, J HDAC protein expression in EGFR-low vs EGFR-high cell lines. H3-Ac marks overall H3 acetylation in the cells. GAPDH was used as a loading control. K Knock down of HDACs induces robust EGFR activation. Western blot analysis in PC-9 EGFR-low cells. Hsp90 was used as a loading control. (L-N) TGFβ signatures in PC-9 EGFR-low cells with or without 1 μM vorinostat treatment. O Vorinostat decreases the secretion of TGFβ2. TGFβ2 was measured from the cell culture medium after Cells were treated for 3 days with vehicle DMSO or 1 μM vorinostat, after which the medium was changed. TGFβ2 was measured after 3 days from the medium change. N = 3 biologically independent experiments. P Vorinostat reverses the fibroblast attraction induced by EGFR-low cells. Data represent three individual experiments. Each experiment was repeated 3 times with 5 microfluidic chips in all conditions except for 3 chips in PC9 EGFR-high 24 h due to Matrigel disruption. Data in (G, H, O, P) are presented as mean ± SD. Data were analyzed by an unpaired student’s t-test in (G, H, P), by a paired student’s t-test in (O).
Fig. 7
Fig. 7. Pharmacological upregulation of EGFR sensitizes cells to osimertinib and prohibits tumor regrowth.
A, B Vorinostat synergizes with osimertinib. PC-9 EGFR-low vs EGFR-high cells were treated with either vehicle, 10 nM osimertinib, 1 uM vorinostat or the combination of the two drugs. C Panobinostat synergizes with osimertinib in a lower concentration. Cells were treated with drugs and synergy assay was performed after 72 h of drug treatment. Blue color indicates drug synergy. DF HDAC inhibitors prevent the regrowth of osimertinib-treated cells. Cell lines were treated with either vehicle, 10 nM osimertinib, 1 uM vorinostat, 50 nM panobinostat, or with combination of osimertinib + vorinostat or osimertinib + panobinostat. G Mouse treatment scheme. 1:1 mixed PC-9 EGFR-low:EGFR-high cells were mixed and grafted into xenograft mice. After the tumors were formed, the mice were first pre-treated with either Vehicle or Panobinostat. After the pre-treatment the mice were received either vehicle, panobinostat, osimertinib or the combination of the two drugs for 21 days. Follow-up was until day 60. H Panobinostat increases EGFR expression in vivo treated tumors. Representative tumor images shown from both treatment groups. Scale bar is 100 μm. I, J Panobinostat reduces tumor regrowth. Tumor growth was followed-up until day 60. Tumors bigger than 300 mm2 were considered as regrown. J Schematic how HDAC inhibition prevents osimertinib resistance formation over time. HDAC inhibitor can induce higher expression of EGFR in the EGFR-low cells, thus making them more sensitive for osimertinib treatment. This can lower the secretion of TGFβ, fibroblasts attraction and immune suppression induced by the EGFR-low cells and prevent or delay tumor regrowth. K Combination drug testing on a tumor-on-a-chip (TOC) model. Two EGFR mutant patient-derived organoid models were integrated into the TOC together with endothelial tubule to test drug permeability. After the formation of the tubule and the tumor niche, 40 nM osimertinib, 1 uM vorinostat, 20 nM panobinostat, and their combinations were injected into the endothelial tubule and incubated for 72 h. Representative pictures of the chips are shown. The quantification graph illustrates the % coverage of live organoids within the tumor area of the chip. N = 2 technical replicates. L Therapeutic strategy to eradicate EGFR-low cells. Treatment with an HDAC inhibitor induces a phenotypic switch characterized by increased EGFR expression and a decreased EMT-like state, leading to reduced fibroblast attraction and immune suppression. Consequently, the combination of the HDAC inhibitor with osimertinib enhances tumor cell killing and diminishes tumor regrowth. Data in (A, B, D, E, F, K) are presented as mean ± SD. Data were analyzed by two-way ANOVA in (A, B, D, E, F). N = 3 biologically independent experiments in (A, B, D, E, F).

References

    1. Sharma, S. V., Bell, D. W., Settleman, J. & Haber, D. A. Epidermal growth factor receptor mutations in lung cancer. Nat. Rev. Cancer7, 169–181 (2007). - PubMed
    1. Leonetti, A. et al. Resistance mechanisms to osimertinib in EGFR-mutated non-small cell lung cancer. Br. J. Cancer121, 725–737 (2019). - PMC - PubMed
    1. Soria, J. C. et al. Osimertinib in Untreated EGFR-Mutated Advanced Non-Small-Cell Lung Cancer. N. Engl. J. Med.378, 113–125 (2018). - PubMed
    1. Tumbrink, H. L., Heimsoeth, A. & Sos, M. L. The next tier of EGFR resistance mutations in lung cancer. Oncogene40, 1–11 (2021). - PubMed
    1. Blatter, S. & Rottenberg, S. Minimal residual disease in cancer therapy–Small things make all the difference. Drug Resist Updat.21-22, 1–10 (2015). - PubMed

Publication types

MeSH terms

Associated data