. 2025 Jan 2;16(1):272.
doi: 10.1038/s41467-024-55056-6.

Invasion of glioma cells through confined space requires membrane tension regulation and mechano-electrical coupling via Plexin-B2

Affiliations

Invasion of glioma cells through confined space requires membrane tension regulation and mechano-electrical coupling via Plexin-B2

Chrystian Junqueira Alves et al. Nat Commun. .

Abstract

Glioblastoma (GBM) is a malignant brain tumor with diffuse infiltration. Here, we demonstrate how GBM cells usurp guidance receptor Plexin-B2 for confined migration through restricted space. Using live-cell imaging to track GBM cells negotiating microchannels, we reveal endocytic vesicle accumulation at cell front and filamentous actin assembly at cell rear in a polarized manner. These processes are interconnected and require Plexin-B2 signaling. We further show that Plexin-B2 governs membrane tension and other membrane features such as endocytosis, phospholipid composition, and inner leaflet surface charge, thus providing biophysical mechanisms by which Plexin-B2 promotes GBM invasion. Together, our studies unveil how GBM cells regulate membrane tension and mechano-electrical coupling to adapt to physical constraints and achieve polarized confined migration.


Conflict of interest statement

Competing interests: K.D. Costa discloses his role as scientific co-founder and Chief Scientific Officer of Novoheart, Medera Inc. NovoHeart did not play any role in the design, conduct, or funding of this study. The other authors declare no competing interests.

Figures
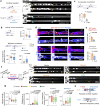
Fig. 1
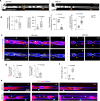
Fig. 1. Confined migration of GSCs requires endocytosis.
a Left, schematic illustration of spontaneous migration of GSCs in microchannels with periodic 3 or 8 µm constrictions. Right, still frames from videography show SD2 GSCs labeled with NucSpot invading into microchannels at 12 hr after seeding. Chevrons point to constrictions. b Diagrams and quantification of velocity across constrictions (n = 20 cells per condition) and sums of distances traveled by forward or backward movements over 17 hr. For sums of distances traveled forward: 3 µm, n = 31 cells; 8 µm, n = 38 cells. For sums of distances traveled backward: 3 µm, n = 34 cells; 8 µm, n = 40 cells. Box plots show 25–75% percentiles, minimal and maximal values (whiskers), median (line), and mean (cross). Mann–Whitney–Wilcoxon test, two-sided. c Diagram and box plots show velocity ratio when crossing 2nd vs. 1st constriction. n = 10 cells per group. Two-sided unpaired t-test. Box plots show 25–75% percentiles, minimal and maximal values (whiskers), median (line), and mean (cross). Two-sided unpaired t-test. d Still frames from live-cell fluorescent imaging of SD2 GSCs traversing constrictions (note different time frames for 3 or 8 µm). Dashed lines outline cell boundary. Arrows points to F-actin at rear zone (SPY555-actin) or MemGlow-labeled endosomes at front zone of cell. e Quantifications of fluorescence intensity ratio for SPY-actin or MemGlow at rear vs. front zones during confined migration through 3 or 8 µm constrictions. n = 10 cells per group. Two-sided unpaired t-test. Bar graphs show means ± SEM. f Left, experimental timeline for endocytosis inhibitor treatment before microchannel invasion assay. Right, still frames from videography show stalled SD2 GSCs treated by inhibitors. g Box plots of velocity through constriction, stalling time at constrictions, and sum of forward and backward movements affected by endocytosis inhibitors. Box plots show 25–75% percentiles, minimal and maximal values (whiskers), median (line), and mean (cross). For velocity across constrictions: vehicle, n = 20 cells; Dynasore, n = 16 cells; Pitstop2, n = 15 cells; EIPA, n = 16 cells. For stalling time at constriction: vehicle, n = 22 cells; Dynasore, n = 19 cells; Pitstop2, n = 26 cells; EIPA, n = 28 cells. For sums of distances traveled forward: vehicle, n = 20 cells; Dynasore, n = 16 cells; Pitstop2, n = 15 cells; EIPA, n = 16 cells. For sums of distances traveled backward: vehicle, n = 20 cells; Dynasore, n = 16 cells; Pitstop2, n = 15 cells; EIPA, n = 16 cells. Kruskal–Wallis test followed by Dunn’s multiple comparisons test. h Schematic illustration of polarized migration through constrictions, which further augments migration consistency. Note regionalized accumulation of endocytic vesicles at cell front and F-actin assembly at rear to propel cells through 3 µm constriction. Source data are provided as a Source Data file.
Fig. 2
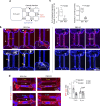
Fig. 2. Plexin-B2 regulates cytoskeletal and membrane tension in GSCs.
a Schematic of CRISPR/Cas9-mediated PLXNB2 knockout (KO) with small guide (sg) RNA targeting second coding exon. b Western blots show Plexin-B2 expression in SD2 GSCs, with β-actin as loading control. Note Plexin-B2 precursor at 240 kDa and mature form at 170 kDa. c IF images show Plexin-B2 expression in SD2 GSCs, with Hoechst nuclear counterstain. d Left, schematic of atomic force microscopy (AFM) indentation method to probe cell stiffness by cantilever deflection. Middle, AFM indentation curves of SD2; right, box plots of cell stiffness, showing 25–75% quartiles, median (line), and mean (plus sign). n = 6 cells per group. Kruskal–Wallis test followed by Dunn’s multiple comparisons test. e Left, depiction of membrane tension measurement with optical tweezers. Middle, force measurements during tether extrusion (shaded box). Right, quantifications of tether extrusion forces. Box plots show 25–75% percentiles, minimal and maximal values (whiskers), median (line), and mean (cross). n = 5 cells per group. Kruskal–Wallis test followed by Dunn’s multiple comparisons test. f Left, schematic of FLIM of cell membranes labeled with Flipper-TR membrane dye, with low and high membrane tension associated with shorter and longer lifetimes, respectively (figure modified after ref. ). Middle top, representative FLIM images, with lifetime heatmap shown on right. Middle bottom, images show similar fluorescence intensities of Flipper-TR dye in Ctrl and PB2 KO cells. Right top, violin plots show fluorescence lifetime from 3 images per group. Two-sided unpaired t-test. Right bottom, phasor plots of FLIM image data, with arrow indicating a shift to shorter lifetime values for PB2 KO cells. g Live-cell imaging of SD3 GSCs labeled with SPY-actin show differences of cortical F-actin (arrows) between Ctrl and PB2 KO GSCs. NucSpot for nuclear staining. Right, box plots of SPY-actin cortical intensity, with 25–75% quartiles, median (line), and mean (plus sign). For Ctrl, n = 37 cell cortical areas; for PB2 KO, n = 28 cell cortical areas. Two-sided unpaired t-test. h Model of Plexin-B2 regulation of cortical contractility and membrane tension. Source data are provided as a Source Data file.
Fig. 3
Fig. 3. Plexin-B2 affects membrane internalization in GSCs.
a Dextran uptake assay of SD2 GSCs labeled with SPY-Actin. Enlarged images of boxed areas are shown below. Box plots show areas of dextran+ puncta per cell, with 25–75% quartiles, median (line), and mean (plus sign). n = 85 cells for Ctrl, n = 44 cells for PB2 KO. Mann–Whitney–Wilcoxon test, two-sided. b Top, live cell confocal plane images of SD2 GSCs with side views of z-stacks show intracellular localization of diffuse dextran-Alexa 488 in PB2 KO cells, whereas Ctrl cells contained only dextran+ endocytic vesicles. Bottom, histograms of fluorescence profiles show bimodal distribution of dextran-Alexa 488 fluorescence intensities in PB2 KO GSCs (blue and brown arrows). n = 177 cells for Ctrl, n = 161 cells for PB2 KO. Mann–Whitney–Wilcoxon test, two-sided. c, d Left, schematic of myr-palm-GFP or -CFP attached to inner membrane leaflet. Right, live cell images at 72 hr after transfection show fluorescent probes on endomembranes (arrow) in control GSCs, but membrane retention of the probes (arrowhead) in PB2 KO GSCs. For myr-palm-GFP: n = 21 cell membranes for WT; n = 13 cell membranes for PB2 KO. For myr-palm-CFP: n = 6 cell membranes for WT; n = 5 cell membranes for PB2 KO. Two-sided unpaired t-test. Bar graphs show means ± SEM. e Left, schematic of TauSTED super-resolution microscopy of GSCs labeled with MemGlow and NucSpot. Middle, TauSTED live-cell images show reduced endocytic vesicles (arrowheads) in PB2 KO cells compared to Ctrl. Right, box plots show areas of MemGlow+ clusters per cell. Box plots show 25–75% percentiles, minimal and maximal values (whiskers), median (line), and mean (cross). n = 26 cells for Ctrl, n = 13 cells for PB2 KO. Two-sided unpaired t-test. f Working model of regulation of cortical and membrane tension by Plexin-B2, affecting endocytosis in GSCs. Source data are provided as a Source Data file.
Fig. 4
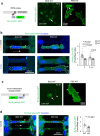
Fig. 4. Plexin-B2 is required for migration of GSCs through confined space.
a Still frames from live-cell videography show compromised migration of PB2 KO SD3 (visualized by NucSpot) into microchannels with 3 µm constrictions (denoted by orange chevron signs) as compared to Ctrl cells. b Quantifications of velocity through constrictions (Ctrl, n = 11 cells; PB2 KO, n = 12 cells), stalling time at constriction (Ctrl, n = 25 cells; PB2 KO, n = 19 cells), sums of distances traveled forward (n = 11 cells per group), and sums of distances traveled backward (n = 12 cells per group). Box plots show 25–75% quantiles, minimal and maximal values (whiskers), median (line), and mean (cross). Two-sided unpaired t-test. c Still frames from live-cell imaging of SD3 traversing 3 µm constrictions reveal F-actin assembly at rear zone (SPY555-actin, arrowhead) and MemGlow-labeled endosomes at front (arrow) in Ctrl but not in stalled KO cells. Note different time stamps for Ctrl and PB2 KO. Dashed lines delineate cell boundary. d Right, quantifications of the ratio of fluorescence intensity for SPY-actin or MemGlow at rear vs. front zones during confined migration. Bar graphs show means ± SEM. n = 10 cells per group. Two-sided unpaired t-test. e Left, still frames from live-cell imaging show a long tether (arrows) connecting PB2 KO cells in microchannel with 8 µm constriction. f Box plot quantifications of SPY-actin tether length. Box plots show 25–75% percentiles, minimal and maximal values (whiskers), median (line), and mean (cross). n = 24 cells for Ctrl; n = 20 cells for PB2 KO. Two-sided unpaired t-test. Source data are provided as a Source Data file.
Fig. 5
Fig. 5. Confined migration in long tunnels.
a Schematic of microdevice with central chambers connected by pairs of narrow tunnels of 50 μm length and 3 or 8 µm width. b Representative still images from videography show successful passage of Ctrl SD3 through 3 µm tunnel in 60 min timeframe, but stalled PB2 KO cell after 90 min. Long arrows on left denote migration direction. Note SPY-actin at rear zone (arrowhead) and diffuse MemGlow-labeled endocytic vesicles (arrow) in Ctrl, both reduced in PB2 KO GSC. Dashed lines delineate cell boundary. c Box plots show the number of successful migration events per cell through the 3 µm tunnel in 17 hr timeframe and the speed in the tunnel. Box plots show 25–75% percentiles, minimal and maximal values (whiskers), median (line), and mean (cross). n = 9 cells per group. Two-sided unpaired t-test. d Left, still images show SPY-actin at rear zone of Ctrl GSCs traversing through tunnels, more prominent in 3 µm than 8 µm tunnels, and reduced in PB2 KO cells. Arrows denote direction of migration. Right, bar graphs show ratios of SPY-actin fluorescence intensity at rear vs. front during passage through tunnels. For 3 µm: n = 21 cells for Ctrl; n = 20 cells for PB2 KO. For 8 µm: n = 17 cells for Ctrl; n = 16 cells for PB2 KO. One-way ANOVA followed by Tukey’s multiple comparison test. Data represent mean ± SEM. Source data are provided as a Source Data file.
Fig. 6
Fig. 6. Plexin-B2 KO affects PIP2 localization and inner membrane surface charge in GSCs.
a Left, schematic of PH(PLCD1)-GFP PIP2 probe. Right, live-cell imaging at 72 hr post transfection reveals that the PH(PLCD1)-GFP probes were largely internalized in control GSCs (arrow), but retained on membrane of PB2 KO GSCs (arrowhead). b Left, still images from videography show accumulation of PH(PLCD1)-GFP probes (arrow) in front of the nucleus (NucSpot) of migrating control SD2 in tunnels, more so in 3 than 8 µm tunnel, but not in PB2 KO cells. Dashed lines delineate cell boundary. Long arrow denotes direction of migration. Right, quantifications of the ratio of PH(PLCD1)-GFP fluorescence intensity at front vs. rear of GSCs during passage. For 3 µm: n = 15 cells for WT, n = 13 cells for PB2 KO. For 8 µm: n = 13 cells for WT, n = 16 cells for PB2 KO. One-way ANOVA followed by Tukey’s multiple comparison test. Data represent mean ± SEM. c Left, schematic of R( + 8)-prenyl-GFP probe for negative surface charge of inner leaflet of plasma membrane. Right, live-cell imaging at 72 hr post-transfection shows internalization of the probes (arrow) in control GSCs, in contrast to the predominant membrane localization in PB2 KO GSCs (arrowhead). d Left, still images from videography show accumulation of the R( + 8)-pre-GFP probe (arrow) at front zone of control GSC traversing 3 µm tunnel, but not in PB2 KO cells. Right, bar graphs show the ratio of R-pre-GFP fluorescence intensity at rear vs. front of GSC when passing through tunnels. n = 22 cells for WT, n = 27 cells for PB2 KO. Mann–Whitney–Wilcoxon test, two-sided. Data represent mean ± SEM. Source data are provided as a Source Data file.
Fig. 7
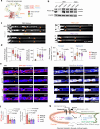
Fig. 7. Plexin-B2 function regulates inner membrane surface charge.
a Illustration of voltage sensitive membrane dye FluoVolt, with fluorescence quenched by electron transfer from electron-rich donor (high inner membrane surface charge), mediated by “molecular wire” in plasma membrane (figure modified after ref. ). b Left, live-cell images show reduced FluoVolt fluorescence in plasma membrane of PB2 KO cells (higher negative charges of inner membrane). Right, box plots of membrane FluoVolt intensity. Box plots show 25–75% percentiles, minimal and maximal values (whiskers), median (line), and mean (cross). n = 25 cells for Ctrl, n = 27 cells for PB2 KO. Two-sided unpaired t-test. Data represent mean ± SEM. c Top, still images from live-cell imaging show higher FluoVolt fluorescence at rear zone (arrowhead) in Ctrl GSCs when traversing tunnels, more so in 3 than 8 µm tunnel, but not in PB2 KO cells. Calcium chelator BAPTA-AM disrupted polarized FluoVolt pattern. White arrow denotes migration direction. Bottom, bar graphs show the ratio of FluoVolt intensity at rear vs. front during confined migration. n = 15 cells per group for Ctrl. vs KO, one-way ANOVA followed by Tukey’s multiple comparison test. n = 21 cells for vehicle and n = 16 cells for BAPTA-AM, two-sided unpaired t-test. Bar graphs represent mean ± SEM. d Live-cell images and quantifications show the effects of constitutive active (CA) RAP1B-V12 or dominant-negative (DN) RAP1B-N17 on FluoVolt intensity in Ctrl or PB2 KO GSCs. Box plots show 25–75% percentiles, minimal and maximal values (whiskers), median (line), and mean (cross). n = 25 cells per group. Kruskal–Wallis test followed by Dunn’s multiple comparisons test. e Model of Plexin-B2 signaling affecting membrane surface charge and electric field during polarized confined migration, with PIP2 enrichment at cell front and Ca2+ at rear zone, and asymmetry of FluoVolt and R( +8)-pre-GFP. Source data are provided as a Source Data file.
Fig. 8
Fig. 8. Confined migration of GSCs requires the flexible extracellular ring of Plexin-B2.
a Structure model of the extracellular domain of human Plexin-B2 show the locations of lock1 and lock2 mutations predicted to form disulfide bridges that lock the ring structure. b Western blots show absence of mature Plexin-B2 (170 kDa) in PB2 KO GSC, and expression of lock mutants in PB2 KO for both SD2 and SD3. β-actin serves as a loading control. c Still images from videography show passage of GSCs (nuclei visualized by NucSpot) through microchannels by wildtype PB2 rescue construct, but not PB2 lock mutants, nor PB2 with deletion of extracellular domain (dECTO). Chevrons point to 3 µm constrictions. d Box plots show velocity through constrictions (Rescue, n = 20 cells; dECTO, n = 20 cells; Lock1, n = 21 cells; Lock2, n = 17 cells), stalling time at constrictions (Rescue, n = 20 cells; dECTO, n = 14 cells; Lock1, n = 28 cells; Lock2, n = 22 cells), and sum of forward and backward movements constrictions (Rescue, n = 20 cells; dECTO, n = 20 cells; Lock1, n = 21 cells; Lock2, n = 17 cells), with 25–75% quartiles, minimal and maximal values (whiskers), median (line), and mean (cross). One-way ANOVA followed by Dunnett’s multiple comparisons test. e Still images from videography show wildtype but not PB2 mutants restored localization of SPY-actin (arrowhead) at cell rear and MemGlow+ endocytic vesicles (arrow) at cell front in GSC traversing 3 µm constrictions (chevrons). f Bar graphs show fluorescence intensity ratio of SPY-actin and MemGlow at rear vs. front of GSCs during confined migration. For SPY-actin: n = 11 cells for Recue; n = 15 cells for dECTO; n = 10 cells for Lock1; n = 10 cells for Lock2. For MemGlow: n = 15 cells for Recue; n = 18 cells for dECTO; n = 10 cells for Lock1; n = 10 cells for Lock2. Kruskal–Wallis test followed by Dunn’s multiple comparisons test. Data represent mean ± SEM. g Model of Plexin-B2 signaling in regulating mechano-electrical coupling of membrane tension and membrane surface charge during polarized confined migration. Note regionalized enrichment of endocytosis/PIP2 at cell front and F-actin/Ca2+ at rear zone and asymmetry of FluoVolt and R( + 8)-pre-GFP membrane probes. Source data are provided as a Source Data file.

Update of

Similar articles

Cited by

References

    1. Cuddapah, V. A., Robel, S., Watkins, S. & Sontheimer, H. A neurocentric perspective on glioma invasion. Nat. Rev. Neurosci.15, 455–465 (2014). - PMC - PubMed
    1. Mair, D. B., Ames, H. M. & Li, R. Mechanisms of invasion and motility of high-grade gliomas in the brain. Mol. Biol. Cell29, 2509–2515 (2018). - PMC - PubMed
    1. Beeghly, G. F., Amofa, K. Y., Fischbach, C. & Kumar, S. Regulation of tumor invasion by the physical microenvironment: lessons from breast and brain cancer. Annu Rev. Biomed. Eng.24, 29–59 (2022). - PMC - PubMed
    1. Kim, Y. et al. Perspective of mesenchymal transformation in glioblastoma. Acta Neuropathol. Commun.9, 50 (2021). - PMC - PubMed
    1. Venturini, V. et al. The nucleus measures shape changes for cellular proprioception to control dynamic cell behavior. Science370, eaba2644 (2020). - PubMed

Publication types