. 2025 Jan 2;16(1):317.
doi: 10.1038/s41467-024-55447-9.

ChromatinHD connects single-cell DNA accessibility and conformation to gene expression through scale-adaptive machine learning

Affiliations

ChromatinHD connects single-cell DNA accessibility and conformation to gene expression through scale-adaptive machine learning

Wouter Saelens et al. Nat Commun. .

Abstract

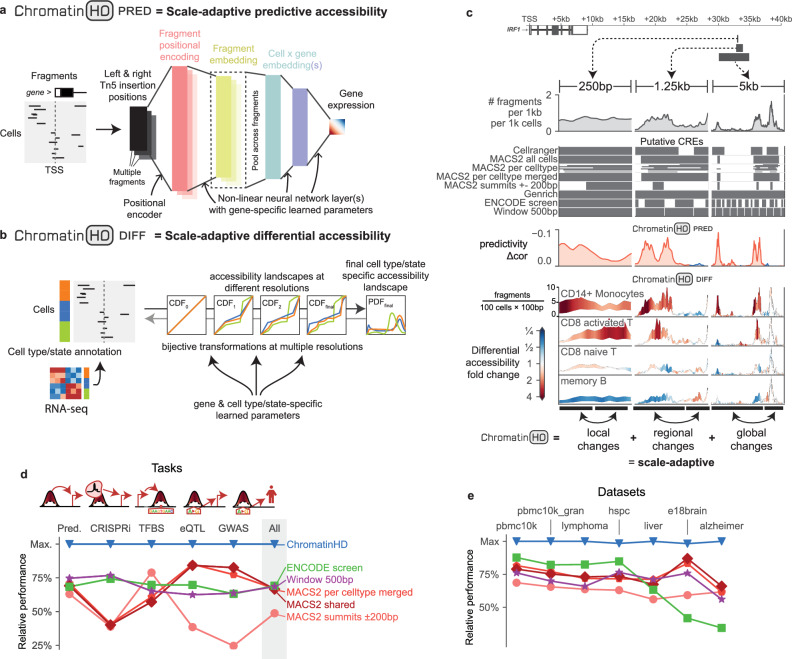
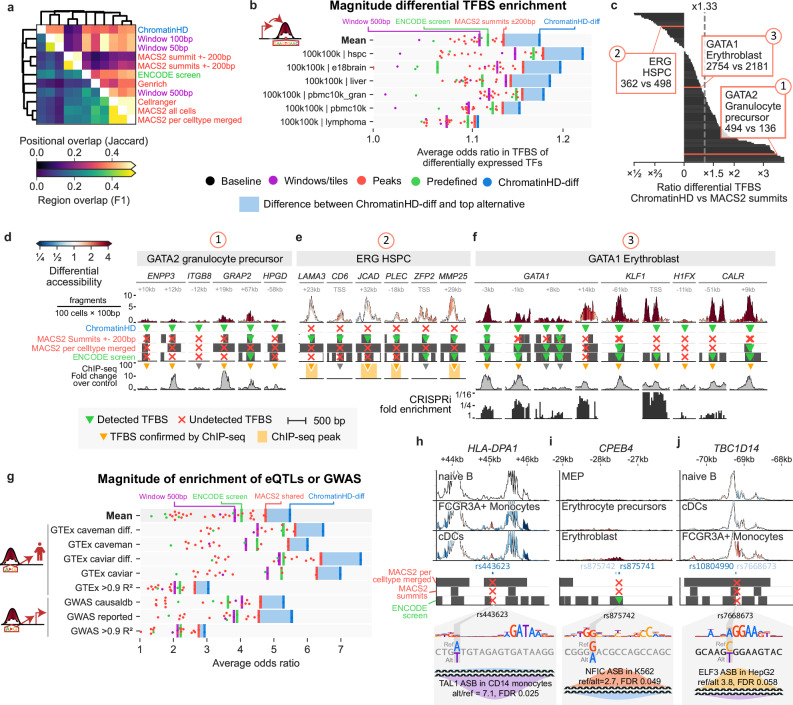
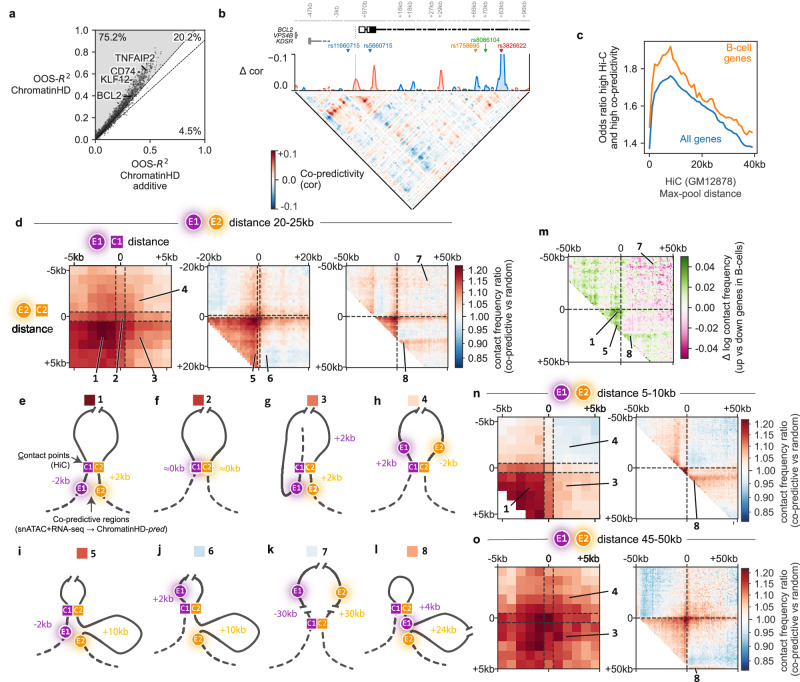
Gene regulation is inherently multiscale, but scale-adaptive machine learning methods that fully exploit this property in single-nucleus accessibility data are still lacking. Here, we develop ChromatinHD, a pair of scale-adaptive models that uses the raw accessibility data, without peak-calling or windows, to link regions to gene expression and determine differentially accessible chromatin. We show how ChromatinHD consistently outperforms existing peak and window-based approaches and find that this is due to a large number of uniquely captured, functional accessibility changes within and outside of putative cis-regulatory regions. Furthermore, ChromatinHD can delineate collaborating regulatory regions, including their preferential genomic conformations, that drive gene expression. Finally, our models also use changes in ATAC-seq fragment lengths to identify dense binding of transcription factors, a feature not captured by footprinting methods. Altogether, ChromatinHD, available at https://chromatinhd.org , is a suite of computational tools that enables a data-driven understanding of chromatin accessibility at various scales and how it relates to gene expression.


Conflict of interest statement

Competing interests: The authors declare no competing interests.

Figures

Fig. 1
Fig. 1. Central concepts behind ChromatinHD-pred and ChromatinHD-diff.
a ChromatinHD-pred inputs raw fragments in a neural network architecture, that will (1) transform the positions of each fragment close to a TSS (e.g. -10kb or -100kb) into a positional encoding, (2) transforms this positional encoding into a fragment embedding, typically with a smaller number of features, using one or more non-linear neural network layers, (3) pools the fragment information for each cell and gene. b ChromatinHD-diff uses cell type/state annotations derived from, for example, single-cell RNA-seq to construct a complex multi-resolution cell type/state-specific probability distribution. To do this, we apply several bijective transforms on the cumulative density function (CDF), to ultimately be able to estimate the likelihood of observing a particular cut site using the probability density function (PDF). c Three nested regions exemplifying how ChromatinHD models capture predictive and differential accessibility at different scales. Raw data of the same regions is presented in Supplementary Fig. 1. Red and blue Δcor represents regions that are respectively positively and negatively associated with gene expression. d Summarized relative performance for various tasks: accuracy of prediction (pred.), correlation between predictivity and CRISPRi sensitivity (CRISPRi), enrichment for transcription factor binding sites (TFBSs), enrichment for eQTLs (eQTL), enrichment for genome-wide association study variants (GWAS), and an average of the relative performance across tasks (all). Only methods that were second-best performing for any of the tasks are shown. Full details for each task is shown in Figs. 2 and 3. e The average of the relatively performance against the top performing method across all tasks (from d) for individual datasets. Source data are provided as a Source Data file.
Fig. 2
Fig. 2. ChromatinHD-pred improves linking putative regulatory regions to gene expression.
a Accuracy for prediction of gene expression on unseen cells from the same dataset. b Accuracy for prediction of gene expression on a different dataset from the same cellular context. The blue box highlights the difference in performance between ChromatinHD-pred and the second-best performing method. c Example of interpretation of a ChromatinHD-pred model on the IRF1 gene in the pbmc10k dataset, highlighting (with arrows) how the predictivity of a region is often located in the periphery and outside of peaks, or is variable within peaks. Also shown is the predictivity on two test datasets (pbmc10k_gran, pbmc3k). Only windows where at least 0.2 fragments per 1000 cells are present are shown, padded on both sides with 800 bp to show the genomic context. d, e Correlation between smooth region importance (predictivity for ChromatinHD-pred, correlation for CRE-based methods) and CRISPRi fold enrichment in 50 bp windows. Colors in (e) denote different genes as shown in (d). f Two example regions where ChromatinHD-pred corresponds to the CRISPRi enrichment, while CRE-based methods fail. False positives and false negatives are defined as the difference between the z-scores of the CRE-based region importance with the z-scores of ChromatinHD’s predictivity. Source data are provided as a Source Data file.
Fig. 3
Fig. 3. ChromatinHD-diff detects functional differential accessibility within and outside of canonical cis-regulatory elements.
a Similarity between differentially accessible regions (DARs) identified by various methods according to overlap between individual positions (Jaccard) and overlap between regions (F1). b Magnitude of enrichment of transcription factor binding sites (TFBSs) in DARs for which the TF is differentially expressed in the cluster. c Ratio between the number of TFBSs identified in differential MACS2 summits versus differential ChromatinHD-diff regions. TF-cluster combinations were selected as those with differential expression (z-score > 3) and differential binding (odds-ratio > 1.5). d DARs in granulocyte precursors containing a GATA2 TFBS identified by ChromatinHD-diff, and whether it is also identified by alternative methods. Shown is ChIP-seq data (fold-change over control) of GATA2 in K-562 cells. e DARs in hematopoietic stem and progenitor cells (HSPCs) containing an ERG binding site according to MACS2 summits, and whether it is also identified by alternative methods. ERG binding peaks in TSU-1621MT cells are shown. f DARs in erythroblasts containing a differential GATA1 TFBS identified by ChromatinHD-diff, and whether it is also identified by alternative methods. Shown is the ChIP-seq data (fold-change over control) of GATA1 in K-562 cells, and the CRISPRi fold-change enrichment of gRNAs in K-562 cells for high-vs-low bins of the gene’s expression. g Magnitude of enrichment of eQTLs or GWAS variants in DARs. hj Examples of GWAS variants located in a ChromatinHD-diff DAR but not identified by alternative methods, highlighting how such variants can be located in the periphery of peaks in (h), outside of peaks in (i) or at a specific location within peaks in (j). Shown below is a putative mechanism for these variants based on allele-specific binding (ASB) and changes in binding affinity using ADASTRA v5.1.3. Source data are provided as a Source Data file.
Fig. 4
Fig. 4. Size-adaptability and decoupling of baseline and differential accessibility are critical for understanding functional accessibility changes.
a Size distribution of differentially accessible regions (DARs) for different methods overlaid with that of ChromatinHD-diff (blue). b Various features of DARs split by DAR size: the number of differential genomic positions, number of differential regions, CRISPRi fold enrichment (in the hspc data), GWAS odds ratio (in the hspc data using reported immune GWAS variants), eQTL odds ratio (in the hspc data using CAVIAR fine-mapped GTEx variants), and average transcription factor binding sites (TFBSs) odds-ratio for differentially expressed TFs (in the pbmc10k data). c, d Enrichment for various measures of functionality split by average accessibility and differential accessibility. Differential accessibility is defined as either the standard deviation of the accessibility landscapes across cell types defined by ChromatinHD-diff (CRISPRi, GWAS and eQTL) or as the log-fold change between the accessibility in a cell type versus the average (TFBS). e Comparison between differential positions identified by ChromatinHD-diff versus those of the best performing alternative, MACS2 per cell type merged together with a Wilcoxon rank-sum test. Shown are the % of positions that a method identifies as differential within a mean/variance bin (according to ChromatinHD-diff). Highlighted is the false-discovery rate, i.e. the percentage of positions which have a low change in accessibility (<1.6 fold-change) according to ChromatinHD-diff among those that are predicted to be differential by the peak-calling approach, and false-negative rate, i.e. the percentage of positions which are not differential by the peak-calling methods among those that were found differential by ChromatinHD-diff within the particular window of baseline and differential accessibility. Source data are provided as a Source Data file.
Fig. 5
Fig. 5. A 1-5 kb shift in co-predictivity and DNA contact highlights preferential DNA conformations connecting two co-predictive regions.
a Predictive test-set accuracy of additive and non-additive ChromatinHD-pred models across all genes (n = 5000). Percentage of genes with out-of-sample-R2 ratio higher or lower than 1.25 are indicated. b Examples of co-predictive regions for BCL2. Immune-related GWAS SNPs are shown and colored according to haplotype (LD r2 > 0.9). c Odds-ratio for finding high co-predictivity (higher than median) and high Hi-C signal (higher than median) within a slice of genomic distances (1kb-10kb, 10kb-20kb, …) performed for the original Hi-C data (Hi-C max-pool distance = 0), and for max-pooled Hi-C data where we took the maximal Hi-C signal at various genomic distances around the original position. B-cell genes were defined as being differentially expressed in naive, memory or plasma cells compared to all other cell types in the dataset. d Hi-C pileups of potential DNA contact points (C1 and C2) close to two co-predictive regions (E1 and E2, distance 20-25 kb, corΔz-score > 0). Shown is the relative Hi-C signal centered on the co-predictive pair divided by a random pair around the same gene with the same genomic distance. The numbers 1-8 refer to various putative conformations of enhancers and contact points, further described in panels (el). el Illustrations of how different distances between predictive regions and DNA contact points from d may inform on DNA conformation. m Difference in log contact frequency between up and down-regulated genes in B-cells. no Same as d but with E1-E2 distances of 5–10 kb and 45–50 kb respectively. Source data are provided as a Source Data file.
Fig. 6
Fig. 6. ChromatinHD learned a complex dependency between predictivity and fragment size.
a Relationship between the abundance of a fragment size bin (± 10 bp) and the overall loss in predictive accuracy (predictivity, Δcor) when fragments of these sizes were removed from the data. b Abundance, normalized predictivity (predictivity divided by abundance) and average effect of different fragment size bins. The effect is defined as the difference in predicted gene expression between the original data and when the respective fragment is removed. Fragment sizes were split into footprint, mono-, mono, mono + , di-, di + , tri, tri+ and multi fragments by taking the middle point between the local maxima and minima of normalized predictivity. c Motif enrichment for windows with mono− (80-120 bp) versus TF footprint (0-80 bp) fragments, compared to the overall enrichment of a motif in predictive windows. d Relationship of the # of (indirectly) bound TFs within a 100 bp window according to ENCODE GM12878 data (x-axis) and predictivity as defined by ChromatinHD-pred (blue), # of footprints according to HINT-ATAC on the pbmc10k data (red), ratio of Mono− versus TF footprint fragments (green) and overall number of fragments (orange). Shown is the mean and standard error of a spline fit using R’s gam function with smoothing parameter sp = 1. ChIP-seq data of top 30 TFs (ordered by the correlation between predictivity and number of binding sites within 100 bp windows); data for all TFs is shown in Supplementary Fig. 8a. Source data are provided as a Source Data file.

Similar articles

References

    1. Wu, C., Wong, Y. C. & Elgin, S. C. The chromatin structure of specific genes: II. Disruption of chromatin structure during gene activity. Cell16, 807–814 (1979). - PubMed
    1. Levy, A. & Noll, M. Chromatin fine structure of active and repressed genes. Nature289, 198–203 (1981). - PubMed
    1. Ma, S. et al. Chromatin potential identified by shared single-cell profiling of rna and chromatin. Cell183, 1103–1116.e20 (2020). - PMC - PubMed
    1. Bravo González-Blas, C. et al. SCENIC+: single-cell multiomic inference of enhancers and gene regulatory networks. Nat. Methods 1–13 10.1038/s41592-023-01938-4 (2023). - PMC - PubMed
    1. Tedesco, M. et al. Chromatin Velocity reveals epigenetic dynamics by single-cell profiling of heterochromatin and euchromatin. Nat. Biotechnol.40, 235–244 (2022). - PubMed

Publication types

Associated data

LinkOut - more resources